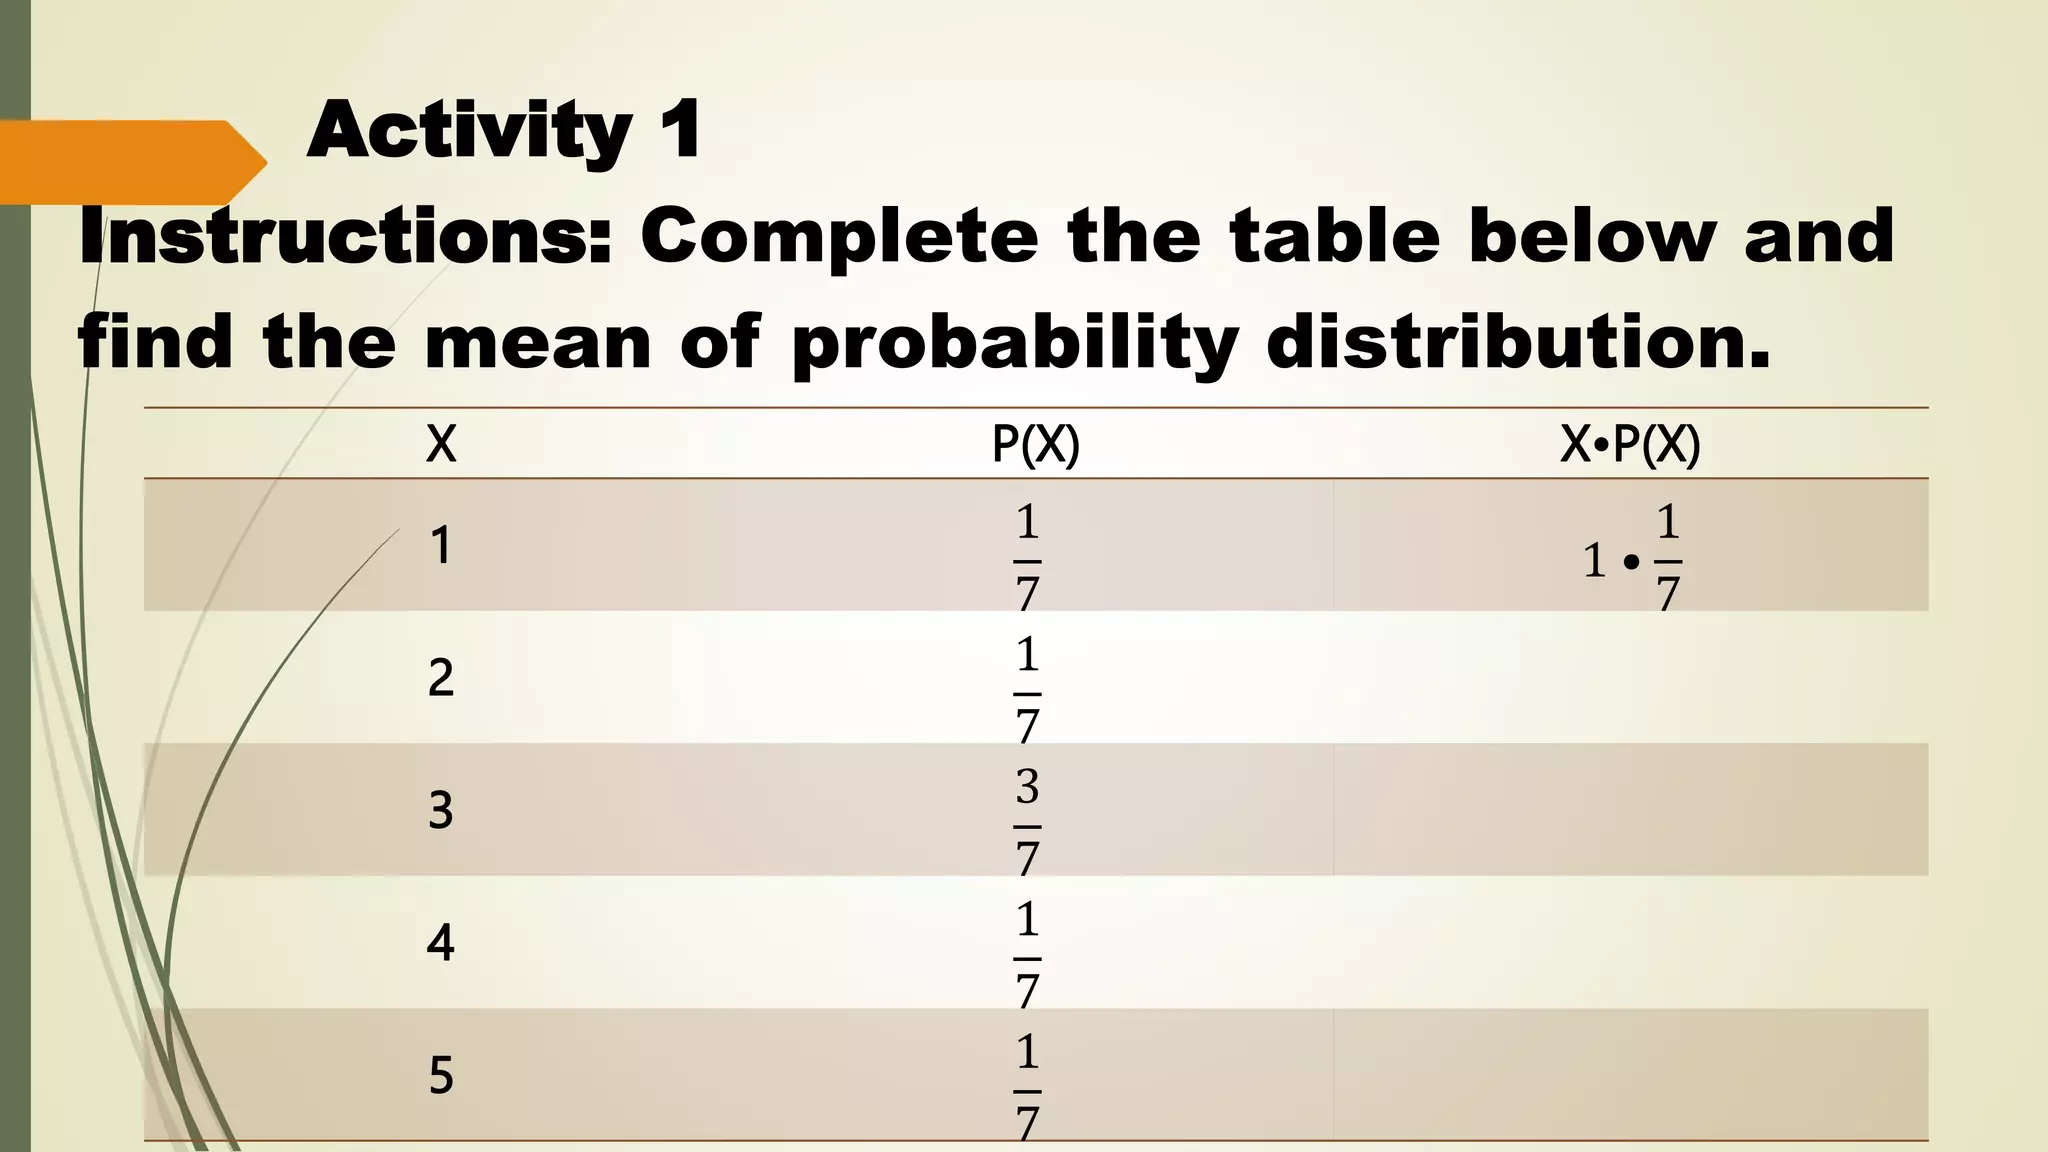
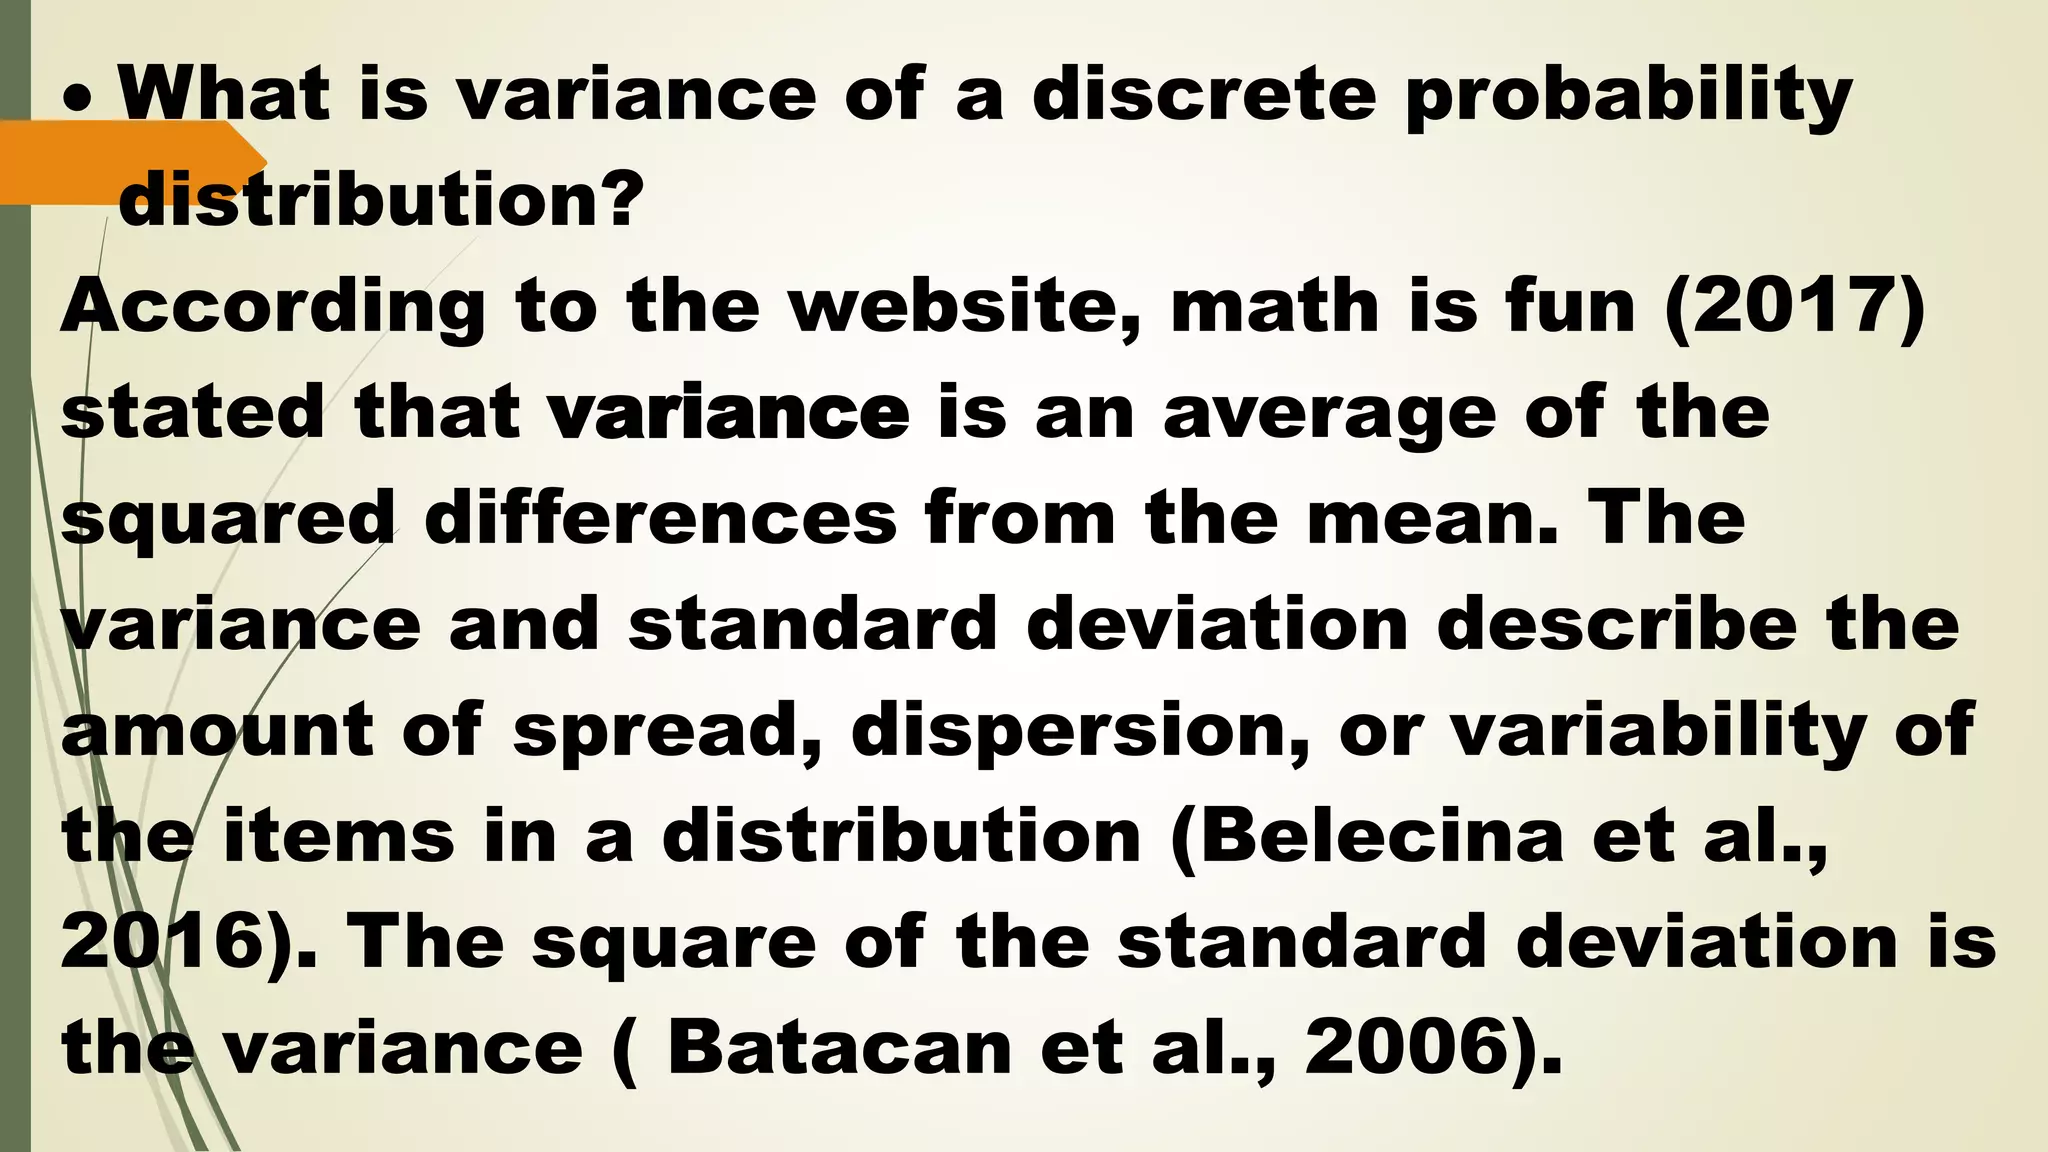
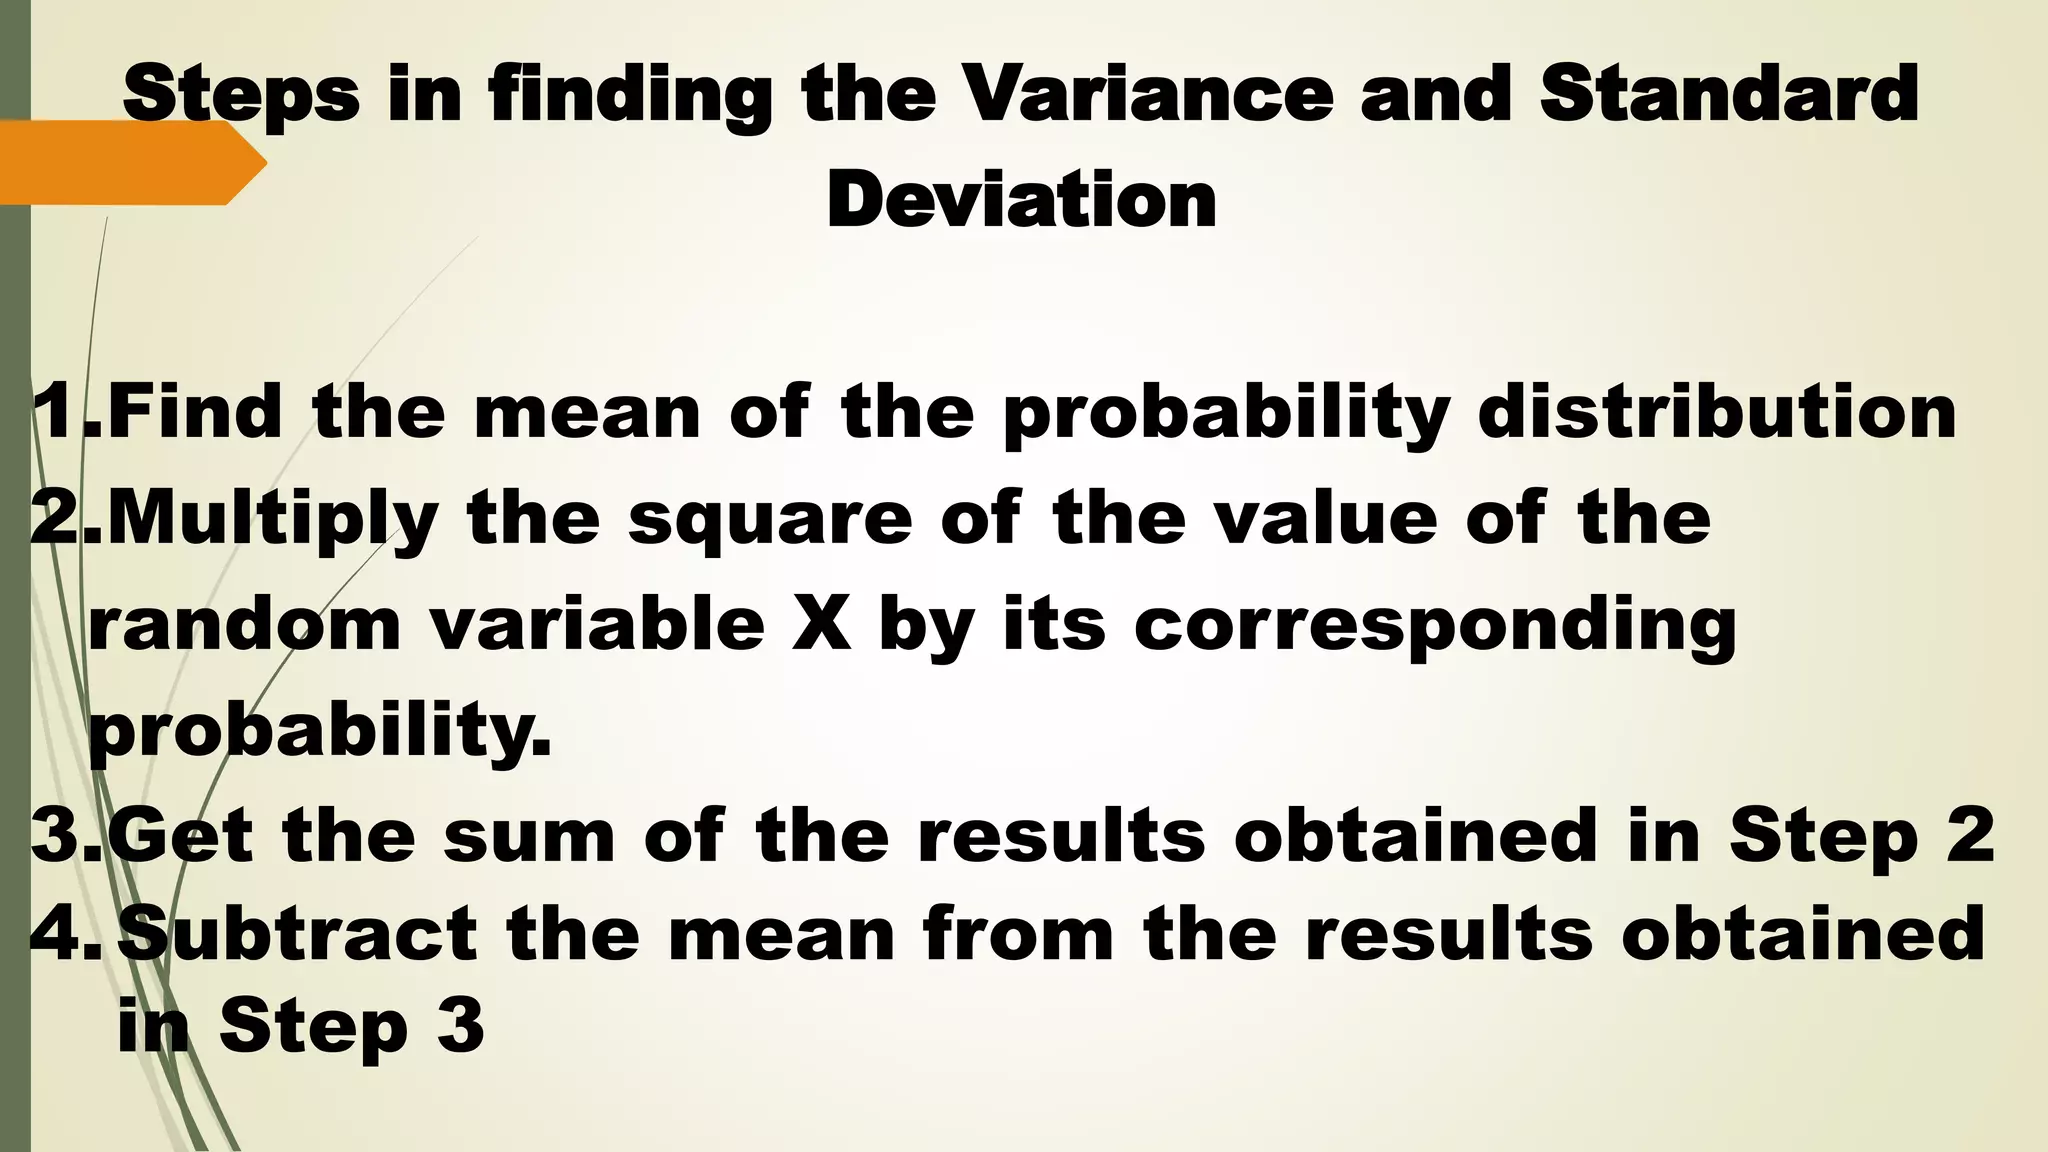
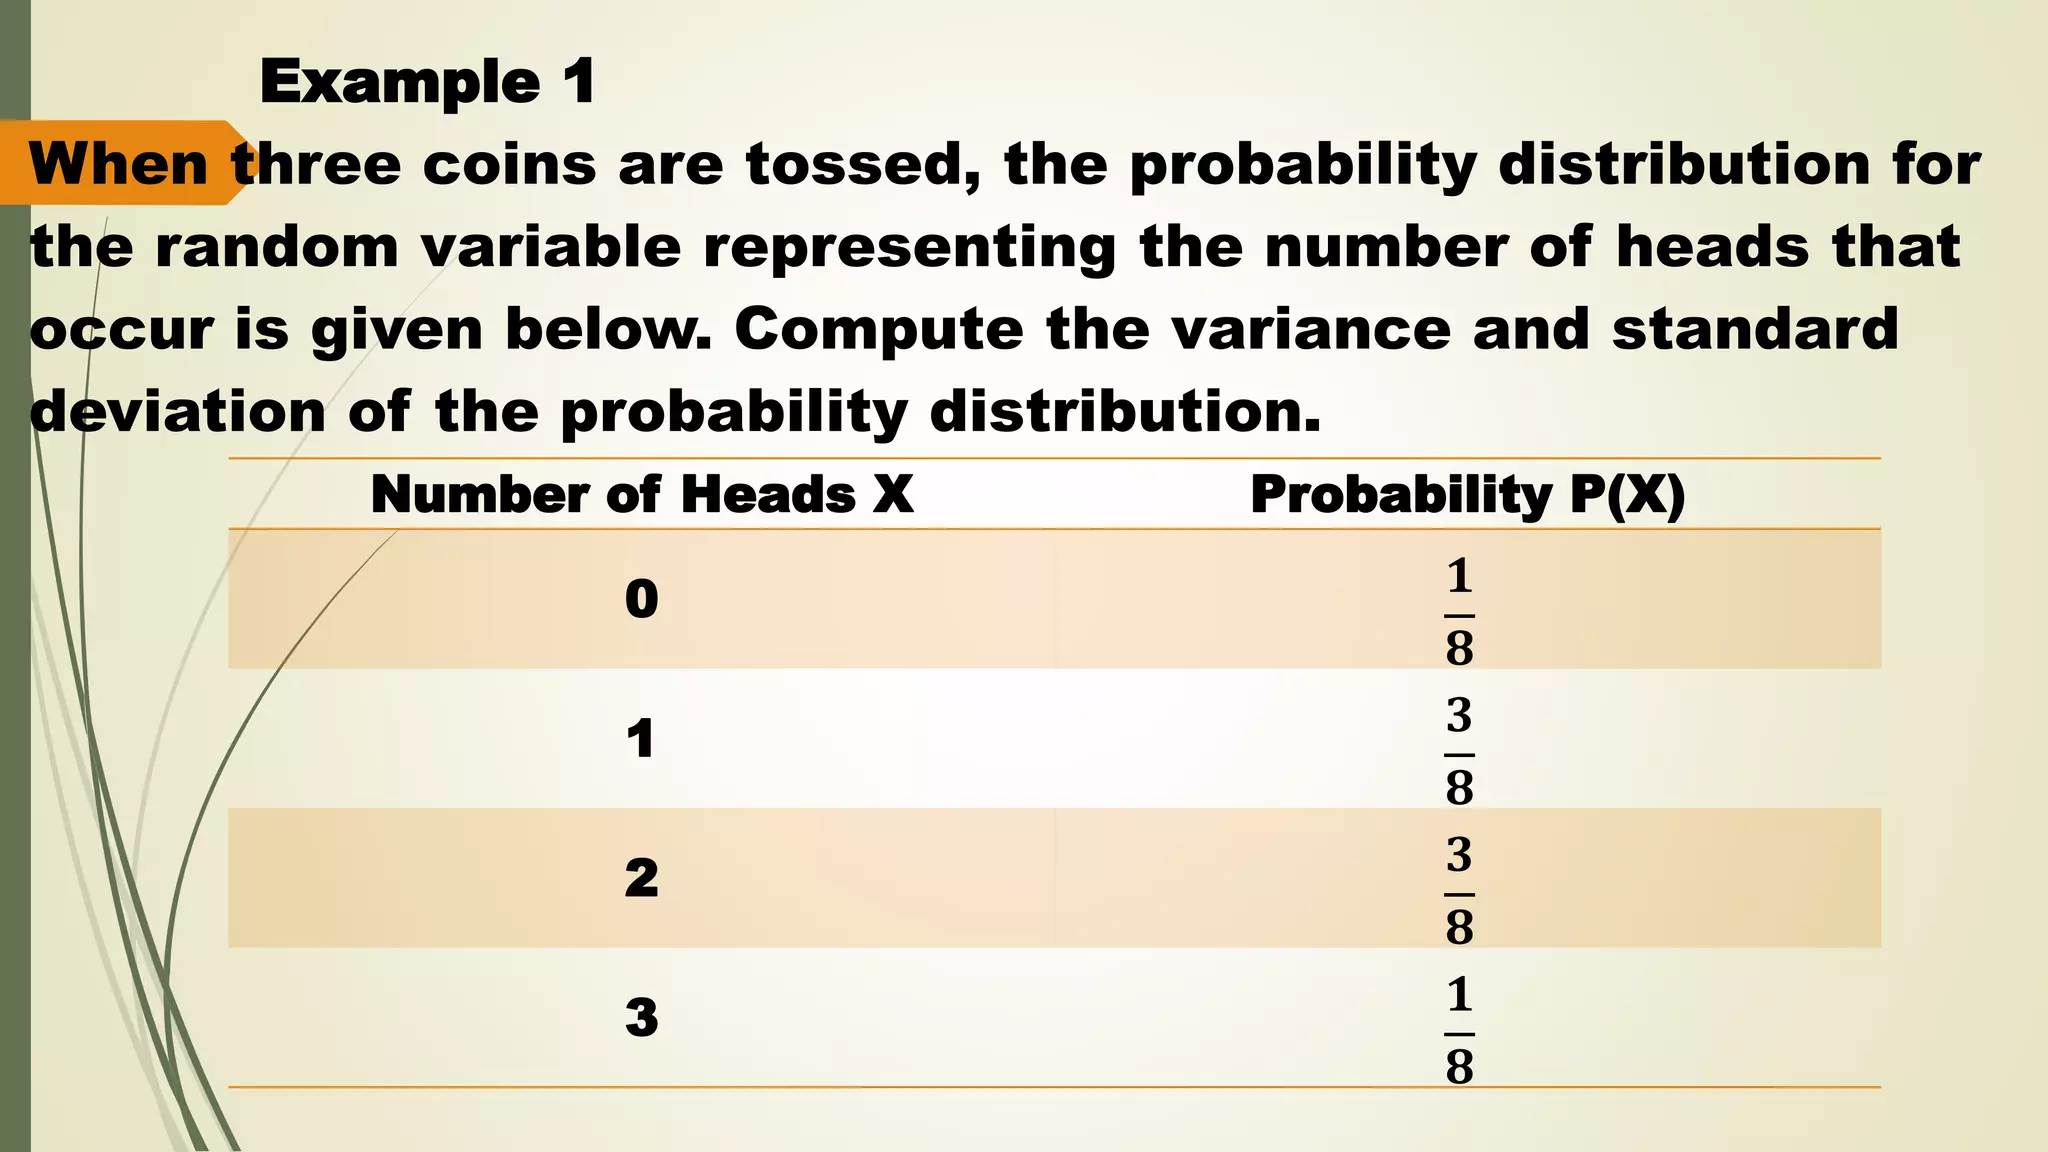
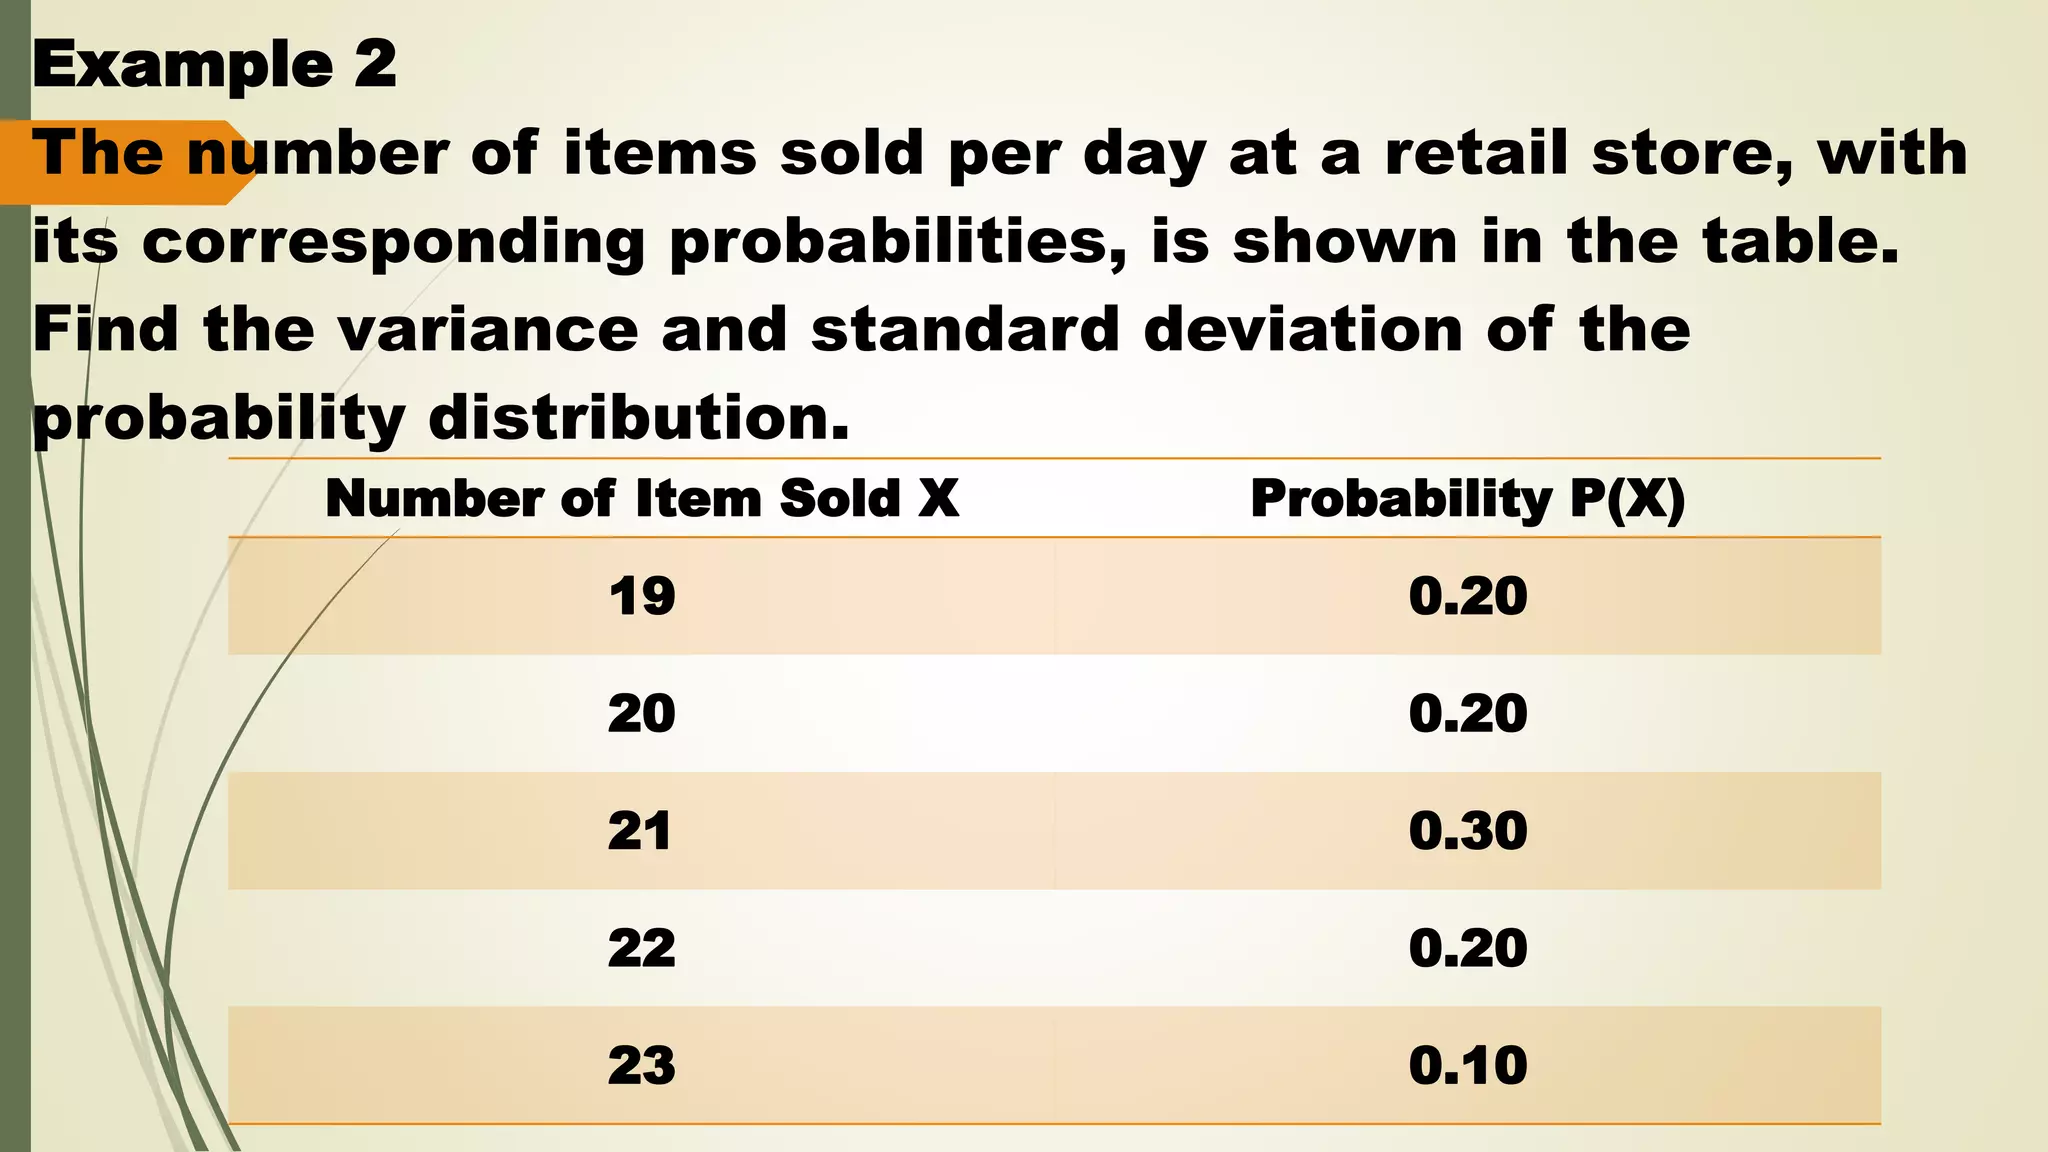
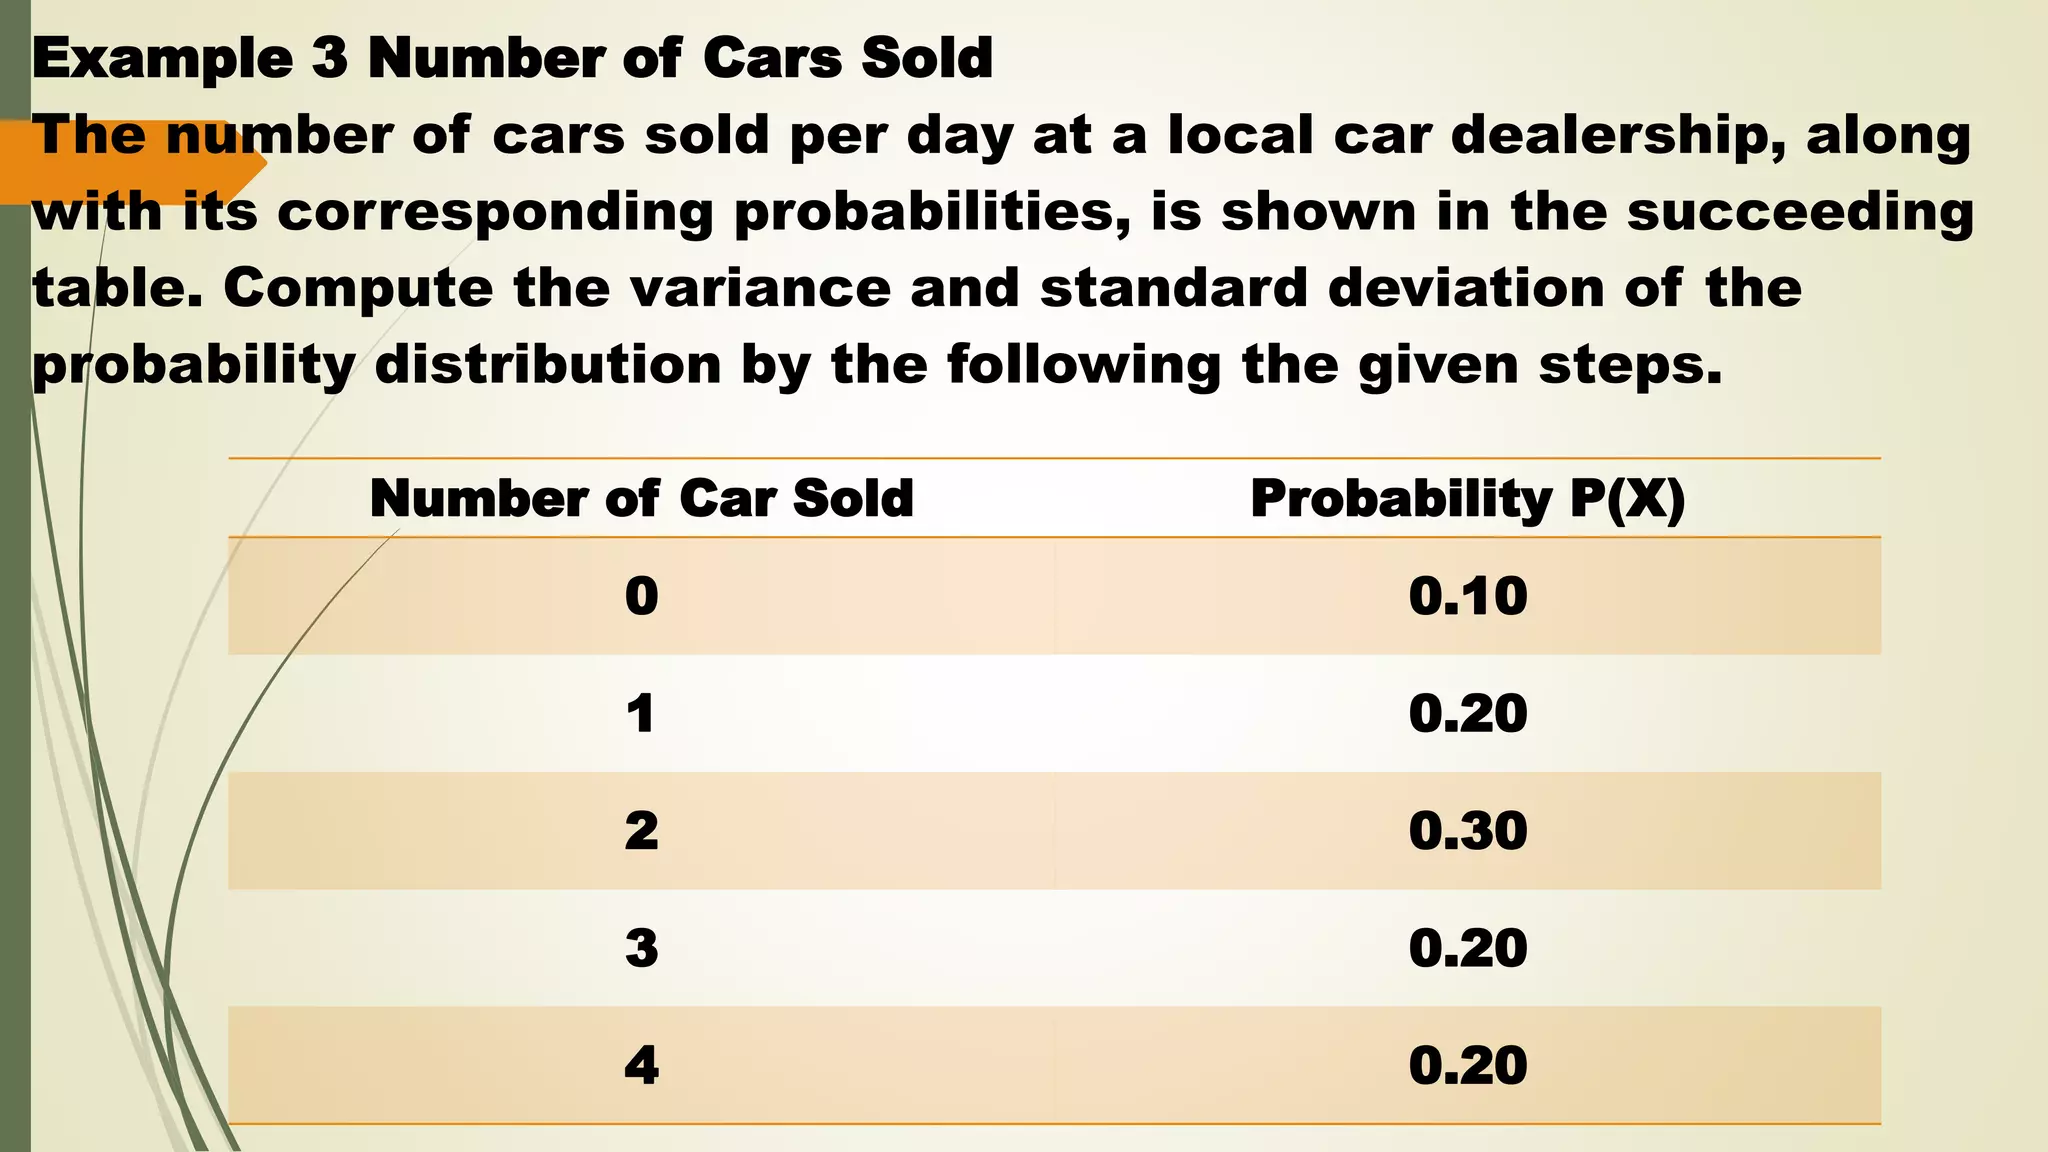
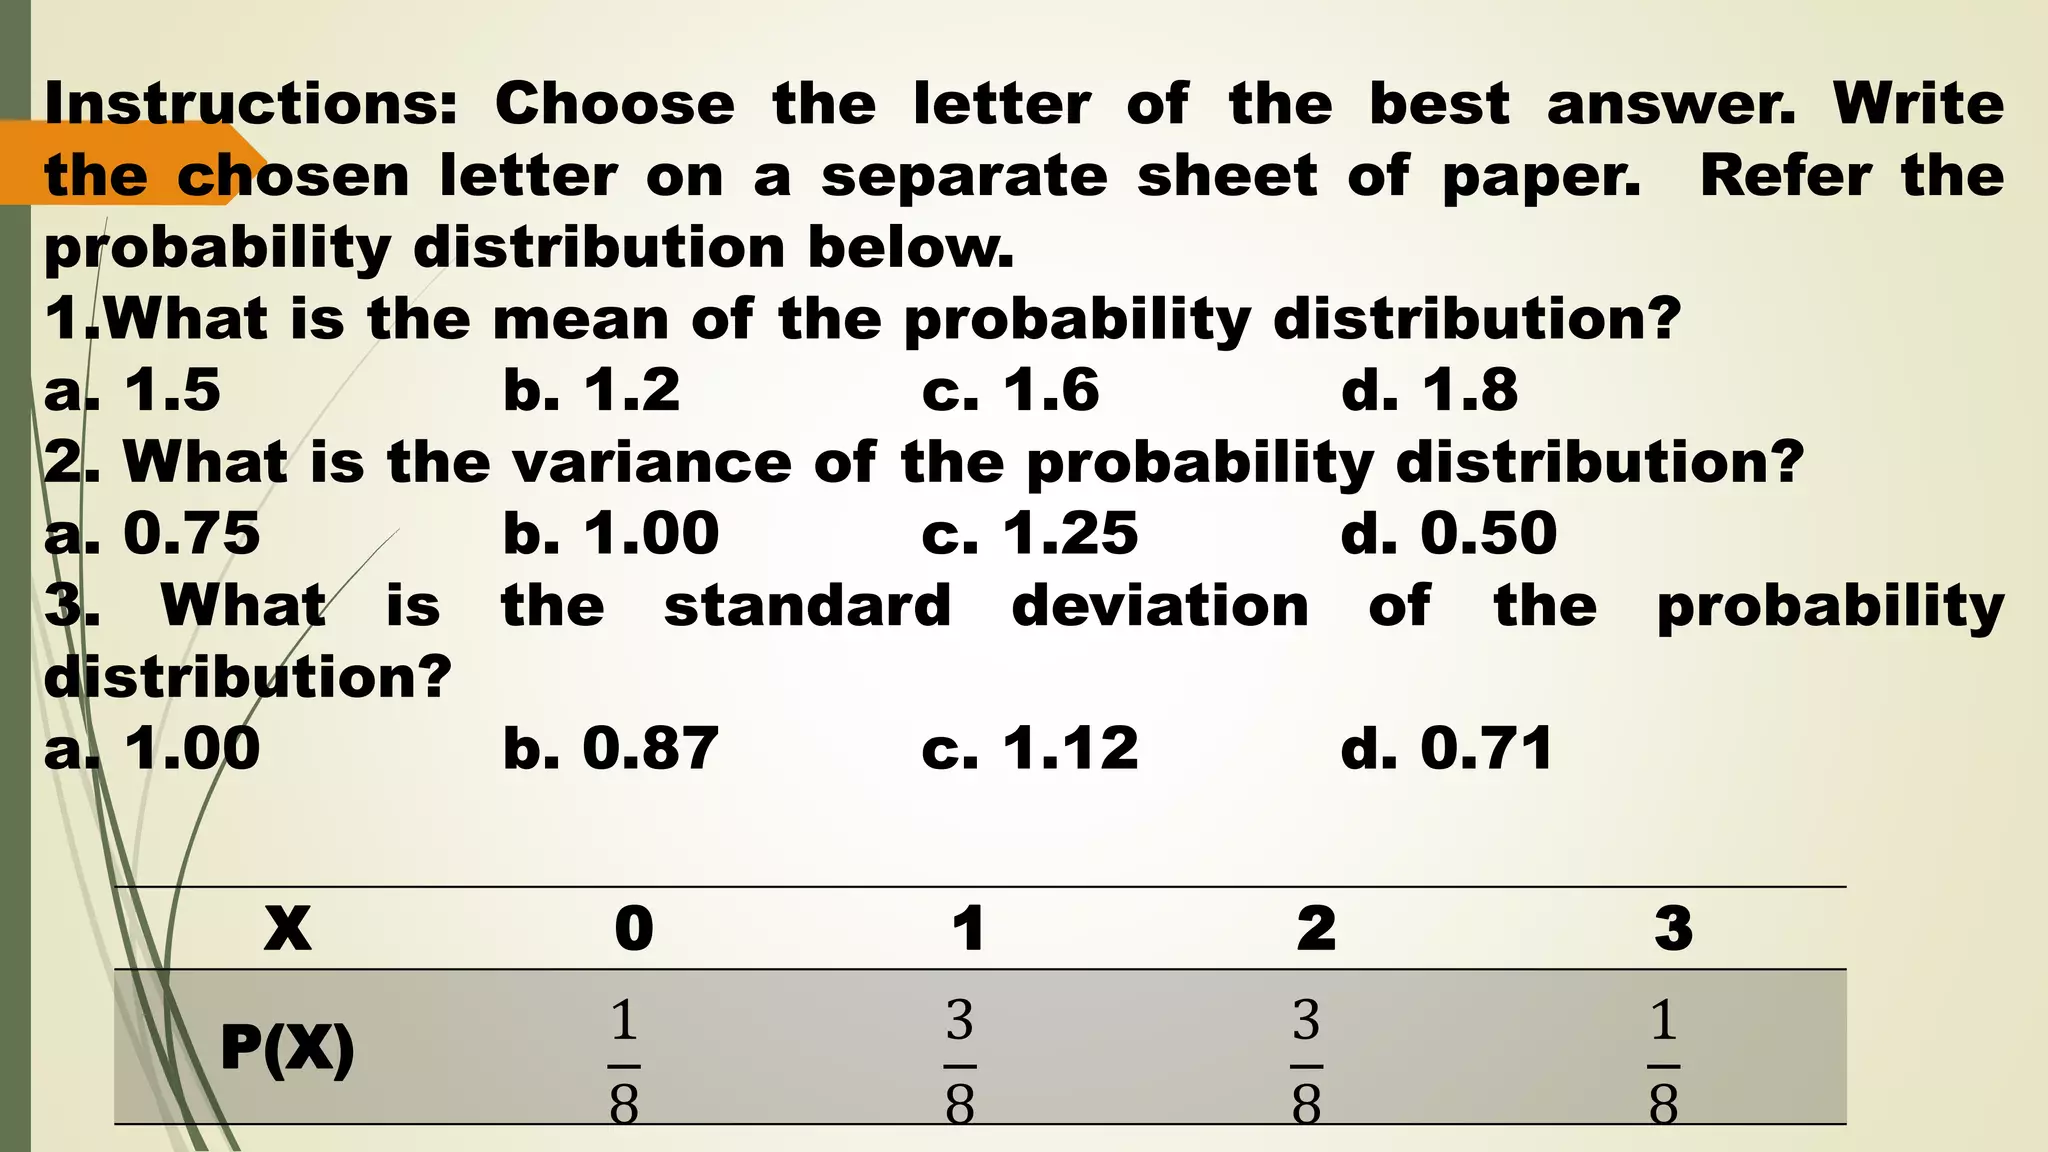
This document discusses how to compute the variance of a discrete probability distribution. It begins by defining variance as the average of the squared differences from the mean. It then outlines the steps to calculate variance: 1) find the mean, 2) multiply the square of each value by its probability, 3) sum these results, and 4) subtract the mean. Several examples are provided to demonstrate how to apply these steps to compute the variance and standard deviation of given probability distributions.
2. Activity 1
Instructions: Complete the table below and
find the mean of probability distribution.
X P(X) X•P(X)
1 1
7
1 •
1
7
2 1
7
3 3
7
4 1
7
5 1
7
3. What is variance of a discrete
probability distribution?
How to compute the variance of a
discrete probability distribution?
Are there steps in computing the
variance of a discrete probability
distribution? If there are, what are
those steps?
4. What is variance of a discrete probability
distribution?
According to the website, math is fun (2017)
stated that variance is an average of the
squared differences from the mean. The
variance and standard deviation describe the
amount of spread, dispersion, or variability of
the items in a distribution (Belecina et al.,
2016). The square of the standard deviation is
the variance ( Batacan et al., 2006).
5. Steps in finding the Variance and Standard
Deviation
1.Find the mean of the probability distribution
2.Multiply the square of the value of the
random variable X by its corresponding
probability.
3.Get the sum of the results obtained in Step 2
4.Subtract the mean from the results obtained
in Step 3
6. Example 1
When three coins are tossed, the probability distribution for
the random variable representing the number of heads that
occur is given below. Compute the variance and standard
deviation of the probability distribution.
Number of Heads X Probability P(X)
0 𝟏
𝟖
1 𝟑
𝟖
2 𝟑
𝟖
3 𝟏
𝟖
7. Example 2
The number of items sold per day at a retail store, with
its corresponding probabilities, is shown in the table.
Find the variance and standard deviation of the
probability distribution.
Number of Item Sold X Probability P(X)
19 0.20
20 0.20
21 0.30
22 0.20
23 0.10
8. Example 3 Number of Cars Sold
The number of cars sold per day at a local car dealership, along
with its corresponding probabilities, is shown in the succeeding
table. Compute the variance and standard deviation of the
probability distribution by the following the given steps.
Number of Car Sold Probability P(X)
0 0.10
1 0.20
2 0.30
3 0.20
4 0.20
9. X 0 1 2 3
P(X) 1
8
3
8
3
8
1
8
Instructions: Choose the letter of the best answer. Write
the chosen letter on a separate sheet of paper. Refer the
probability distribution below.
1.What is the mean of the probability distribution?
a. 1.5 b. 1.2 c. 1.6 d. 1.8
2. What is the variance of the probability distribution?
a. 0.75 b. 1.00 c. 1.25 d. 0.50
3. What is the standard deviation of the probability
distribution?
a. 1.00 b. 0.87 c. 1.12 d. 0.71
10. “Your success will be determined
by your own confidence and
fortitude.”
-Michelle Obama