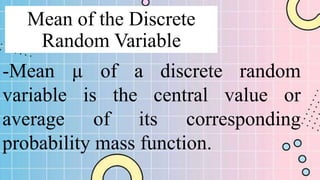
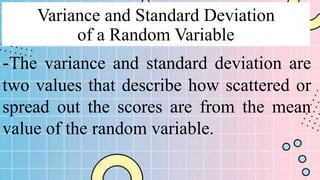
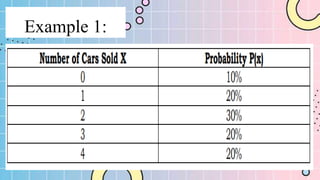
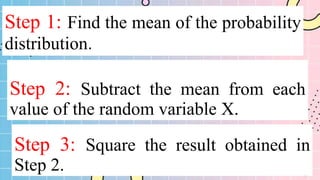
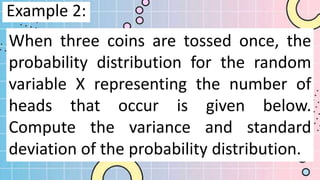
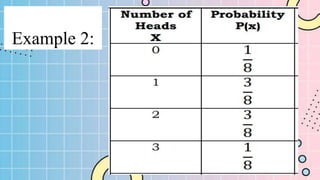
Mean of the Discrete Random
Variable
Mean of the Discrete
Random Variable
-Mean µ of a discrete random
variable is the central value or
average of its corresponding
probability mass function.
Mean of the Discrete
Random Variable
-It is also called as the Expected
Value.
Mean of the Discrete
Random Variable
-It is computed using the formula:
µ = ∑ 𝑋𝑃(𝑥)
-where X is the outcome
-𝑃(𝑥) is the probability of the
outcome
Example 1:
Determine the mean or Expected
Value of random variable below.
Examples 1:
Example 1:
Therefore, mean is 2 for the above
random variable.
Example 2:
Find the mean of the random variable Y
representing the number of red color
chocolates per 160-gram pack of colored
chocolate packages that has the following
probability distribution.
Example 2:
Example 2:
So, the mean of the probability
distribution is 5.63. This implies that
the average number of red chocolates
per 160-gram is 5.63.
Example 3:
The probabilities that a customer will buy
1, 2, 3, 4, or 5 items in a grocery store are
3/10 , 1/10, 1/10, 2/10, and 3/10,
respectively. What is the average number
of items that a customer will buy?
STEPS IN FINDING THE
MEAN
Step 1: Construct the probability
distribution for the random variable
X representing the number of items
that the customer will buy.
STEPS IN FINDING THE
MEAN
Step 2: Multiply the value of the
random variable X by the
corresponding probability.
STEPS IN FINDING THE
MEAN
Step 3: Add the results obtained in
Step 2. Results obtained is the mean
of the probability distribution.
Example 3:
So, the mean of the probability
distribution is 3.1. This implies that
the average number of items that the
customer will buy is 3.1.
Variance and Standard
Deviation of a Random Variable
Variance and Standard Deviation
of a Random Variable
-The variance and standard deviation are
two values that describe how scattered or
spread out the scores are from the mean
value of the random variable.
Variance and Standard Deviation
of a Random Variable
σ2
- variance
σ -standard deviation
µ - mean
p(x) – probability of the outcome
Variance
-denoted as σ2
-determined using the formula:
σ2
= ∑ (𝑥 − µ)2
p(x)
Standard Deviation
-the square root of the variance
-denoted as σ
-determined using the formula:
σ = ∑ (𝑥 − µ)2
p(x)
Example 1:
The number of cars sold per day at a
local car dealership, along with its
corresponding probabilities, is shown in
the succeeding table. Compute the
variance and the standard deviation of
the probability distribution by following
the given steps.
Example 1:
STEPS IN FINDING
THE VARIANCE AND
STANDARD DEVIATION
Step 1: Find the mean of the probability
distribution.
Step 2: Subtract the mean from each
value of the random variable X.
Step 3: Square the result obtained in
Step 2.
Step 4: Multiply the results obtained in
Step 3 by the corresponding probability.
Step 5: Get the sum of the results
obtained in Step 4. Results obtained is
the value of the variance of probability
distribution.
To Solve for Standard
Deviation
-get the square root of the variance
σ = ∑ (𝑥 − µ)2
p(x)
Example 2:
When three coins are tossed once, the
probability distribution for the random
variable X representing the number of
heads that occur is given below.
Compute the variance and standard
deviation of the probability distribution.
Example 2:

STATISTICS-MODULE 2.MEAN OF DISCRETE RANDOM VARIABLE

  • 1.
    Mean of theDiscrete Random Variable
  • 2.
    Mean of theDiscrete Random Variable -Mean µ of a discrete random variable is the central value or average of its corresponding probability mass function.
  • 3.
    Mean of theDiscrete Random Variable -It is also called as the Expected Value.
  • 4.
    Mean of theDiscrete Random Variable -It is computed using the formula: µ = ∑ 𝑋𝑃(𝑥) -where X is the outcome -𝑃(𝑥) is the probability of the outcome
  • 5.
    Example 1: Determine themean or Expected Value of random variable below.
  • 6.
  • 7.
    Example 1: Therefore, meanis 2 for the above random variable.
  • 8.
    Example 2: Find themean of the random variable Y representing the number of red color chocolates per 160-gram pack of colored chocolate packages that has the following probability distribution.
  • 9.
  • 10.
    Example 2: So, themean of the probability distribution is 5.63. This implies that the average number of red chocolates per 160-gram is 5.63.
  • 11.
    Example 3: The probabilitiesthat a customer will buy 1, 2, 3, 4, or 5 items in a grocery store are 3/10 , 1/10, 1/10, 2/10, and 3/10, respectively. What is the average number of items that a customer will buy?
  • 12.
    STEPS IN FINDINGTHE MEAN Step 1: Construct the probability distribution for the random variable X representing the number of items that the customer will buy.
  • 13.
    STEPS IN FINDINGTHE MEAN Step 2: Multiply the value of the random variable X by the corresponding probability.
  • 14.
    STEPS IN FINDINGTHE MEAN Step 3: Add the results obtained in Step 2. Results obtained is the mean of the probability distribution.
  • 15.
    Example 3: So, themean of the probability distribution is 3.1. This implies that the average number of items that the customer will buy is 3.1.
  • 16.
    Variance and Standard Deviationof a Random Variable
  • 17.
    Variance and StandardDeviation of a Random Variable -The variance and standard deviation are two values that describe how scattered or spread out the scores are from the mean value of the random variable.
  • 18.
    Variance and StandardDeviation of a Random Variable σ2 - variance σ -standard deviation µ - mean p(x) – probability of the outcome
  • 19.
    Variance -denoted as σ2 -determinedusing the formula: σ2 = ∑ (𝑥 − µ)2 p(x)
  • 20.
    Standard Deviation -the squareroot of the variance -denoted as σ -determined using the formula: σ = ∑ (𝑥 − µ)2 p(x)
  • 21.
    Example 1: The numberof cars sold per day at a local car dealership, along with its corresponding probabilities, is shown in the succeeding table. Compute the variance and the standard deviation of the probability distribution by following the given steps.
  • 22.
  • 23.
    STEPS IN FINDING THEVARIANCE AND STANDARD DEVIATION
  • 24.
    Step 1: Findthe mean of the probability distribution. Step 2: Subtract the mean from each value of the random variable X. Step 3: Square the result obtained in Step 2.
  • 25.
    Step 4: Multiplythe results obtained in Step 3 by the corresponding probability. Step 5: Get the sum of the results obtained in Step 4. Results obtained is the value of the variance of probability distribution.
  • 26.
    To Solve forStandard Deviation -get the square root of the variance σ = ∑ (𝑥 − µ)2 p(x)
  • 27.
    Example 2: When threecoins are tossed once, the probability distribution for the random variable X representing the number of heads that occur is given below. Compute the variance and standard deviation of the probability distribution.
  • 28.