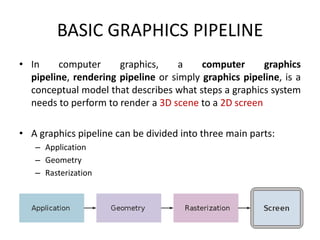
The document outlines the basics of computer graphics, covering fundamental concepts such as images, objects, pixels, resolution, aspect ratios, text mode, and graphics mode. It explains the graphics pipeline, including application, geometry, and rasterization stages, as well as different types of display devices like CRT, LCD, and LED. Additionally, it discusses bitmap vs vector graphics, output primitives, graphic functions, standards, and trends like virtual reality.

![20-06-2020
LIGHT EMITTING DIODE [LED] MONITOR LIQUID CRYSTAL DISPLAY [LCD] MONITOR
CATHODE RAY TUBE [CRT] MONITOR](https://image.slidesharecdn.com/chapter-ibasicsofcomputergraphics-241107140348-26f54da0/85/CHAPTER-I-BASICS-OF-COMPUTER-GRAPHICS-pdf-4-320.jpg)


![Pixel and Resolution
20-06-2020
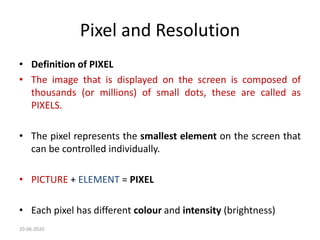
• Definition of RESOLUTION
• Resolution refers to total number of count of pixels in an
digital image.
• For example, if an image has M rows and N columns, then its
resolution can be defined as M x N.
• Where, M[rows] = HEIGHT and N[columns] = WIDTH.](https://image.slidesharecdn.com/chapter-ibasicsofcomputergraphics-241107140348-26f54da0/85/CHAPTER-I-BASICS-OF-COMPUTER-GRAPHICS-pdf-10-320.jpg)


![TEXT MODE AND GRAPHICS MODE
• Definition of TEXT MODE
• It is also known as character mode or alphanumeric
mode, text mode is a display mode divided into rows and
columns of boxes showing only alphanumeric characters.
• In this mode every character is drawn as a dot pattern.
• In this mode there is no way to show or display pictures.
• Example, Command Prompt [CMD].
20-06-2020](https://image.slidesharecdn.com/chapter-ibasicsofcomputergraphics-241107140348-26f54da0/85/CHAPTER-I-BASICS-OF-COMPUTER-GRAPHICS-pdf-15-320.jpg)
![TEXT MODE AND GRAPHICS MODE
• Definition of GRAPHIC MODE
• Graphics mode is a computer display mode that generates
image using pixels.
• Today, most users operate their computer in a graphics mode
opposed to a text mode or command line environment.
• In this mode we can display pictures, charts, graphs very
easily.
• Example, Graphical User Interface [GUI]
20-06-2020](https://image.slidesharecdn.com/chapter-ibasicsofcomputergraphics-241107140348-26f54da0/85/CHAPTER-I-BASICS-OF-COMPUTER-GRAPHICS-pdf-16-320.jpg)


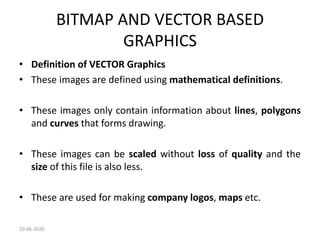
![BITMAP AND VECTOR BASED
GRAPHICS
• FULL-COLOR IMAGES
• These images use
• RED, GREEN, BLUE [RGB] &
• CYAN, MAGENTA, YELLOW, BLACK [CMYK]
20-06-2020](https://image.slidesharecdn.com/chapter-ibasicsofcomputergraphics-241107140348-26f54da0/85/CHAPTER-I-BASICS-OF-COMPUTER-GRAPHICS-pdf-30-320.jpg)

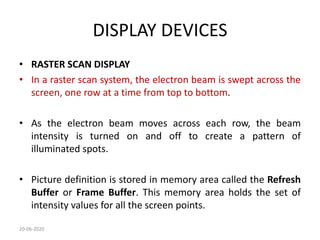
![DISPLAY DEVICES
• CATHODE RAY TUBE [CRT]
• The electron gun emits a beam of electrons cathode rays.
• The electron beam passes through focusing and deflection
systems that direct it towards specified positions on the
phosphor-coated screen.
• When the beam hits the screen, the phosphor emits a small
spot of light at each position contacted by the electron beam.
• It redraws the picture by directing the electron beam back
over the same screen points quickly.
20-06-2020](https://image.slidesharecdn.com/chapter-ibasicsofcomputergraphics-241107140348-26f54da0/85/CHAPTER-I-BASICS-OF-COMPUTER-GRAPHICS-pdf-33-320.jpg)


![DISPLAY DEVICES
• LIQUID CRYSTAL DISPLAY [LCD]
• LCD (Liquid Crystal Display) is a type of flat panel display
which uses liquid crystals in its primary form of operation.
• Liquid crystals do not emit light directly, instead using
a backlight or reflector to produce images in color
or monochrome.
20-06-2020](https://image.slidesharecdn.com/chapter-ibasicsofcomputergraphics-241107140348-26f54da0/85/CHAPTER-I-BASICS-OF-COMPUTER-GRAPHICS-pdf-46-320.jpg)


![DISPLAY DEVICES
• LIGHT EMMITING DIODE [LED]
• A LED display is a flat panel display that uses an array of light-
emitting diodes as pixels for a video display.
• Their brightness allows them to be used outdoors where they
are visible in the sun for store signs and billboards.
• An LED panel has several LED’s while an LED display has
several LED panels.
20-06-2020](https://image.slidesharecdn.com/chapter-ibasicsofcomputergraphics-241107140348-26f54da0/85/CHAPTER-I-BASICS-OF-COMPUTER-GRAPHICS-pdf-50-320.jpg)