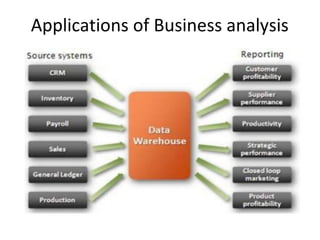
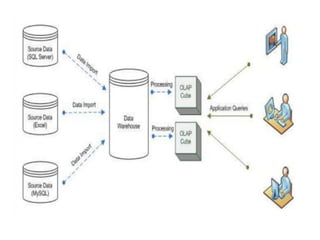
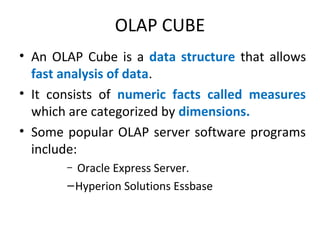
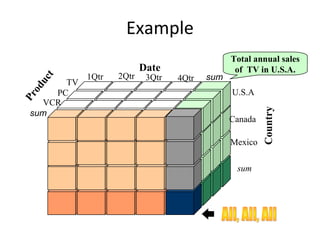
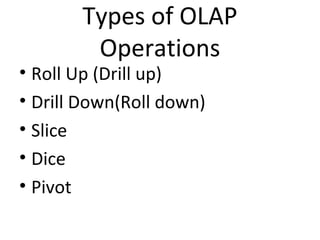
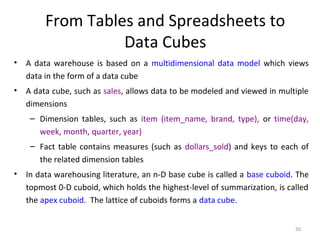
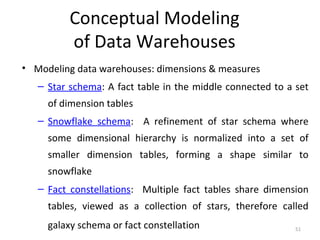
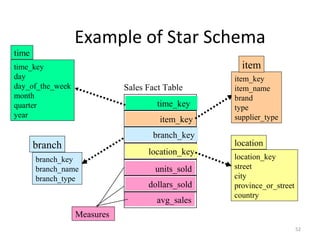
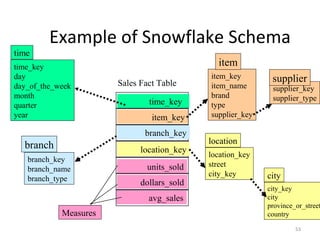
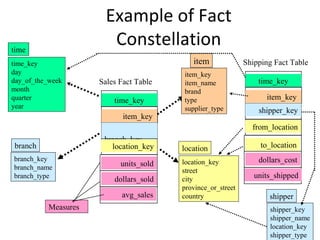
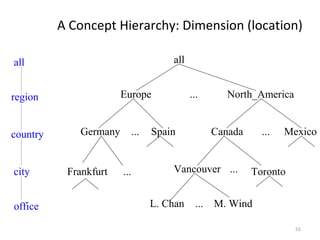
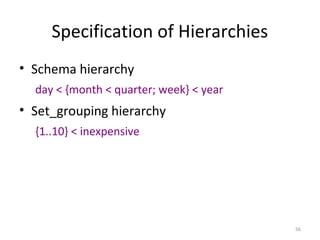
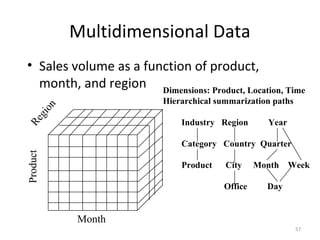
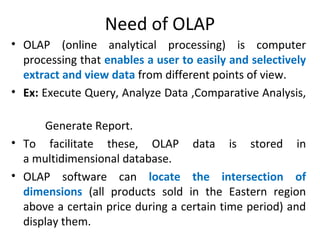
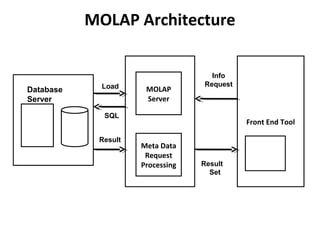
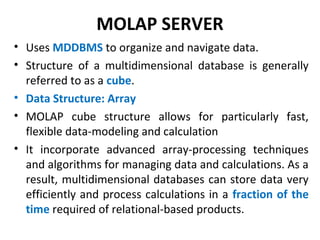
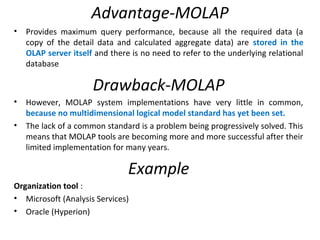
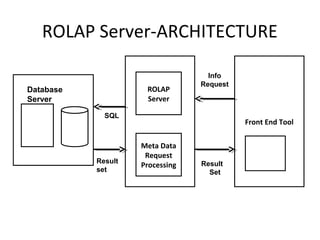
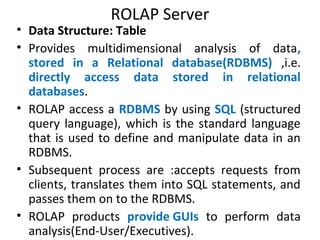
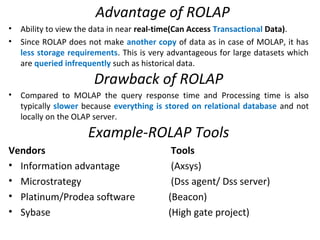
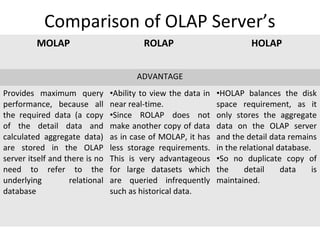
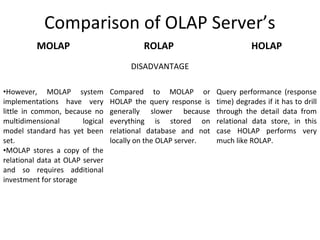
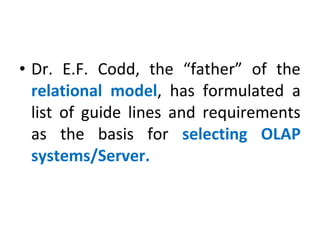
The document discusses various business analysis tools and techniques. It begins by defining business analysis and the responsibilities of business analysts. It then covers topics like reporting tools, query tools, OLAP, data mining, and executive information systems. Under OLAP, it discusses multidimensional data modeling concepts like star schemas, snowflake schemas, and fact constellations. It also covers OLAP operations and different types of OLAP servers including MOLAP, ROLAP, and HOLAP servers.
Business Intelligence: Multidimensional AnalysisMichael Lamont
An introduction to multidimensional business intelligence and OnLine Analytical Processing (OLAP) suitable for both a technical and non-technical audience. Covers dimensions, attributes, measures, Key Performance Indicators (KPIs), aggregates, hierarchies, and data cubes.
In computing, a data warehouse (DW, DWH), or an enterprise data warehouse (EDW), is a database used for reporting (1) and data analysis (2). Integrating data from one or more disparate sources creates a central repository of data, a data warehouse (DW). Data warehouses store current and historical data and are used for creating trending reports for senior management reporting such as annual and quarterly comparisons.
Choosing the Right Business Intelligence Tools for Your Data and Architectura...Victor Holman
Watch video presentation and get a FREE performance management kit at
http://www.lifecycle-performance-pros.com
This presentation takes you through the steps of understanding your business intelligence needs and identifying the right tools for you. We discuss the different types of BI tools. We to discuss the criteria for selecting each type of tools. We to discuss popular Business Intelligence vendors and how to rate them. And we are going to discuss the job functions and responsibilities for a typical BI implementation
Delivering fast, powerful and scalable analyticsMariaDB plc
This session will provide insight on making the most of your data assets with analytics, and what you need for your next analytics project. We’ll showcase how the MariaDB AX solution delivers fast and scalable analytics using real-world use cases.
Data Warehouse approaches with Dynamics AXAlvin You
Dynamics AX의 BI 구축을 위해 필요한 Data Warehouse 내용입니다.
• What is a Data Warehouse
• Data Warehouse Approaches
• Why Invest in a Data Warehouse
• Getting Started
• BI Models
• BI Solutions
The seminar is about Data warehousing, in here we are gonna discuss about what is data warehousing, comparison b/w database and data warehouse, different data warehouse models.about Data mart, and disadvantages of data warehousing.
Business Intelligence and Multidimensional DatabaseRussel Chowdhury
It was an honor that my employer assigned me to study with Business Intelligence that follows SQL Server Analysis
Services. Hence I started and prepared a presentation as a startup guide for a new learner.
* Thanks to all the contributions gathered here to prepare the doc.
Unit 8 - Information and Communication Technology (Paper I).pdfThiyagu K
This slides describes the basic concepts of ICT, basics of Email, Emerging Technology and Digital Initiatives in Education. This presentations aligns with the UGC Paper I syllabus.
Palestine last event orientationfvgnh .pptxRaedMohamed3
An EFL lesson about the current events in Palestine. It is intended to be for intermediate students who wish to increase their listening skills through a short lesson in power point.
The French Revolution, which began in 1789, was a period of radical social and political upheaval in France. It marked the decline of absolute monarchies, the rise of secular and democratic republics, and the eventual rise of Napoleon Bonaparte. This revolutionary period is crucial in understanding the transition from feudalism to modernity in Europe.
For more information, visit-www.vavaclasses.com
Model Attribute Check Company Auto PropertyCeline George
In Odoo, the multi-company feature allows you to manage multiple companies within a single Odoo database instance. Each company can have its own configurations while still sharing common resources such as products, customers, and suppliers.
Instructions for Submissions thorugh G- Classroom.pptxJheel Barad
This presentation provides a briefing on how to upload submissions and documents in Google Classroom. It was prepared as part of an orientation for new Sainik School in-service teacher trainees. As a training officer, my goal is to ensure that you are comfortable and proficient with this essential tool for managing assignments and fostering student engagement.
Synthetic Fiber Construction in lab .pptxPavel ( NSTU)
Synthetic fiber production is a fascinating and complex field that blends chemistry, engineering, and environmental science. By understanding these aspects, students can gain a comprehensive view of synthetic fiber production, its impact on society and the environment, and the potential for future innovations. Synthetic fibers play a crucial role in modern society, impacting various aspects of daily life, industry, and the environment. ynthetic fibers are integral to modern life, offering a range of benefits from cost-effectiveness and versatility to innovative applications and performance characteristics. While they pose environmental challenges, ongoing research and development aim to create more sustainable and eco-friendly alternatives. Understanding the importance of synthetic fibers helps in appreciating their role in the economy, industry, and daily life, while also emphasizing the need for sustainable practices and innovation.
Read| The latest issue of The Challenger is here! We are thrilled to announce that our school paper has qualified for the NATIONAL SCHOOLS PRESS CONFERENCE (NSPC) 2024. Thank you for your unwavering support and trust. Dive into the stories that made us stand out!
2024.06.01 Introducing a competency framework for languag learning materials ...Sandy Millin
http://sandymillin.wordpress.com/iateflwebinar2024
Published classroom materials form the basis of syllabuses, drive teacher professional development, and have a potentially huge influence on learners, teachers and education systems. All teachers also create their own materials, whether a few sentences on a blackboard, a highly-structured fully-realised online course, or anything in between. Despite this, the knowledge and skills needed to create effective language learning materials are rarely part of teacher training, and are mostly learnt by trial and error.
Knowledge and skills frameworks, generally called competency frameworks, for ELT teachers, trainers and managers have existed for a few years now. However, until I created one for my MA dissertation, there wasn’t one drawing together what we need to know and do to be able to effectively produce language learning materials.
This webinar will introduce you to my framework, highlighting the key competencies I identified from my research. It will also show how anybody involved in language teaching (any language, not just English!), teacher training, managing schools or developing language learning materials can benefit from using the framework.
Embracing GenAI - A Strategic ImperativePeter Windle
Artificial Intelligence (AI) technologies such as Generative AI, Image Generators and Large Language Models have had a dramatic impact on teaching, learning and assessment over the past 18 months. The most immediate threat AI posed was to Academic Integrity with Higher Education Institutes (HEIs) focusing their efforts on combating the use of GenAI in assessment. Guidelines were developed for staff and students, policies put in place too. Innovative educators have forged paths in the use of Generative AI for teaching, learning and assessments leading to pockets of transformation springing up across HEIs, often with little or no top-down guidance, support or direction.
This Gasta posits a strategic approach to integrating AI into HEIs to prepare staff, students and the curriculum for an evolving world and workplace. We will highlight the advantages of working with these technologies beyond the realm of teaching, learning and assessment by considering prompt engineering skills, industry impact, curriculum changes, and the need for staff upskilling. In contrast, not engaging strategically with Generative AI poses risks, including falling behind peers, missed opportunities and failing to ensure our graduates remain employable. The rapid evolution of AI technologies necessitates a proactive and strategic approach if we are to remain relevant.
2. Topics
• Reporting and Query tools and Applications
• Online Analytical Processing (OLAP)
• Multidimensional Data Model
• OLAP Guidelines
• Cognos Impromptu
• Multidimensional versus Multirelational OLAP
• Categories of Tools.
3. BUSINESS ANALYSIS
– It is the practice of identifying business needs,
capturing, analyzing and documenting
requirements and supporting the communication
and delivery of requirements with relevant
stakeholders to define and implement an
acceptable solution.
– The person who carries out this task is called
a business analyst or BA.
– Major Task of business analyst
Data analysis
Decision Making
5. BUSINESS ANALYST-RESPONSIBILITIES
• Collect, manipulate, analyze data and making
Decision.
• They prepare reports, which may be in the
form of visualizations such as graphs, charts
detailing the significant results they deduced.
• For example, data analysts might perform
basic statistics such as variations and
averages. They also might predict yields or
create and interpret histograms.
6. Reporting And Query Tools And
Application Tools / DECISION
SUPPORT TOOLS
Tool categories:
• Reporting Tool
• Managed Query
• Executive Information System
• OLAP
• Data Mining
7. Reporting Tool
• Rich, interactive display – Wide variety of tables, charts, graphs and other
visual BI tools can be configured and linked to source data to generate
interactive data visualizations.
• Share reports via a web browser – Interactive reports can be quickly shared
through a web browser or any mobile device to end User.
• Unify disparate data sources – Use data from multiple sources in a single
report, including data from Excel, text/CSV files, any database (SQL Server,
Oracle, MySQL), and Google platforms
• Fast query response – Query response is in seconds, even when dealing with
huge amounts of data or working off commodity hardware
8. Types of reporting tools
• Production Reporting Tools Companies
generate regular operational reports or
support high volume batch jobs, such as
calculating and printing pay checks.
• Report Writers (Desktop tools for end users)
Crystal Reports / Actuate Reporting System
/Excel.
14. Various forms of Reporting
Charts-Bar chart ,Pie chart
Histograms
Table
Graph
Text
Tree
15. Example for Business Intelligence Software
Report Server
Crystal report
Microsoft Power BI
Rapid Miner
Palo
IBM Watson analytics.
SAP Lumira
Jasper Report Business Intelligence
Jmagallanus
Seal Report
16. Managed Query Tools
• Business Objects is the preferred tool for
creating and editing queries for all authorized
users of the Warehouse data collections.
• joining tables, create Views, apply triggers
and efficient nested querying.
• Import data from various formats such as
delimited files, Excel spreadsheets, and fixed
width files.
• Export data in various formats such as
delimited files, Excel spreadsheets, text,
HTML, XML.
17.
18.
19. Example of Managed Query Tools
• DBComparer
• EMS SQL Manager Lite for SQL Server
• SQuirreL SQL Client is a JAVA-based database
administration tool for JDBC compliant
databases.
• SQLite Database Browser
20. OLAP Tools
• Provide an intuitive way to view corporate data.
• Provide navigation through the hierarchies and
dimensions with the single click.
• Aggregate data along common business subjects
or dimensions.
• Users can perform OLAP operations such as drill
down, Roll up, Slice,Dice, Pivot.
21.
22. OLAP CUBE
• An OLAP Cube is a data structure that allows
fast analysis of data.
• It consists of numeric facts called measures
which are categorized by dimensions.
• Some popular OLAP server software programs
include:
– Oracle Express Server.
–Hyperion Solutions Essbase
23. Total annual sales
of TV in U.S.A.Date
Product
Country
sum
sum
TV
VCR
PC
1Qtr 2Qtr 3Qtr 4Qtr
U.S.A
Canada
Mexico
sum
Example
25. Roll Up (Drill up)
• Roll-up performs aggregation on a data cube
by climbing up hierarchy or by dimension reduction
26. Roll Up (Drill up)
(Cont..)
• Roll-up is performed by climbing up a concept hierarchy for
the dimension location.
• Initially the concept hierarchy was "street < city < province <
country".
• On rolling up, the data is aggregated by ascending the
location hierarchy from the level of city to the level of
country.
• When roll-up is performed, one or more dimensions from the
data cube are removed.
27. Drill Down(Roll down)
• Drill-down is the reverse operation of roll-up. It is performed
by either of the following ways:
By stepping down a concept hierarchy for a dimension
By introducing a new dimension.
28. Drill Down(Roll down)
(Cond..)
• Drill-down is performed by stepping down a concept
hierarchy for the dimension time.
• Initially the concept hierarchy was "day < month < quarter <
year."
• On drilling down, the time dimension is descended from the
level of quarter to the level of month.
• When drill-down is performed, one or more dimensions from
the data cube are added.
• It navigates the data from less detailed data to highly
detailed data.
29. Slice
• The slice operation selects one particular dimension
from a given cube and provides a new sub-cube.
Consider the following diagram that shows how slice
works.
30. Slice(Cont..)
• Here Slice is performed for the
dimension "time" using the criterion
time = "Q1".
• It will form a new sub-cube by selecting
one or more dimensions.
31. Dice
• Dice selects two or more dimensions from a given cube and
provides a new sub-cube. Consider the following diagram
that shows the dice operation.
32. Dice(Cont..)
• The dice operation on the cube based on the
following selection criteria involves three
dimensions.
• (location = "Toronto" or "Vancouver")
• (time = "Q1" or "Q2")
• (item =" Mobile" or "Modem")
33. Pivot
• The pivot operation is also known as rotation. It
rotates the data axes in view in order to provide an
alternative presentation of data. Consider the
following diagram that shows the pivot operation.
• In this the item and location axes in 2-D slice are rotated.
35. OLAP vs Data Mining
• Both data mining and OLAP are two of the common Business Intelligence
(BI) technologies. Business intelligence refers to computer-based methods
for identifying and extracting useful information from business data.
• In large data warehouse environments, many different types of analysis can
occur. Can enrich data warehouse with advance analytics using OLAP (On-
Line Analytic Processing) and data mining.
OLAP Data Mining
For data analysis For Decision Making(Future Prediction)
Provides summary data and generates
rich calculations
Data mining discovers hidden patterns in
data. Data mining operates at a detail
level instead of a summary level.
Ex: How do sales of mutual funds in North
America for this quarter compare with
sales a year ago?
Who is likely to buy a mutual fund in the
next six months?
Functions/Tasks are Rollup, Drill
Down,Slice,dice ,pivot
Functions/Tasks are
classification,association,clustering,regres
sion.
36. DATA MINING
• Data mining is the field of computer science which,
deals with extracting interesting patterns from large
sets of data. It combines many methods from
artificial intelligence, neural network, machine
learning, statistics and database management.
• Data mining is also known as Knowledge Discovery
in data (KDD).
• Data mining usually deals with following four tasks:
association ,clustering, classification, regression.
37. Functions of Data Mining
• Association is looking for relationships between
variables.
• Clustering is identifying similar groups from
unstructured data.
• Classification is learning rules that can be applied to
new data,ie.Classification models predict categorical
class labels for any application.
• Regression is finding functions with minimal error to
model data.
38. Data Mining Tools
• Provide insights into corporate data that are not easily
discerned with managed query or OLAP tools.
• Use a variety of statistical and Artificial Intelligence
algorithms to analyze the correlation of variables in
data.
• To investigate interesting patterns and relationship
by applying functions such as association,
clustering,regression,outlier analysis.
• Example:
IBM’s Intelligent Miner
DataMind Corp.’s DataMind
41. Executive Information System
Tools
• It is a type of management information system and decision support
system that facilitates and supports senior executives to perform data
analysis and decision-making needs.
• It provides easy access to internal and external information relevant
to organizational goals.
• It is an integrated tool to perform querying, reporting, OLAP analysis, Data
mining functions.
• EIS Apps highlight exceptions to business activity or rules by using color-
coded graphics. To Build customized, graphical decision support Tasks. .
46. EIS Tool (Dash Board)
• Digital dashboards allow managers, Executives to monitor the
contribution of the various departments in their organization.
• showing a graphical presentation of the current status (snapshot)
and historical trends of an organization’s.
Benefits of using digital dashboards include:
Visual presentation of performance measures
Ability to identify and correct negative trends
Measure efficiencies/inefficiencies
Ability to generate detailed reports showing new trends
Ability to make more informed decisions based on
collected business intelligence
Align strategies and organizational goals
Saves time compared to running multiple reports
Quick identification of data outliers and correlations
47. * Reference: http://www.arborsoft.com/essbase/wht_ppr/coddTOC.html* Reference: http://www.arborsoft.com/essbase/wht_ppr/coddTOC.html
What Is OLAP?
• Online Analytical Processing - coined by EF
Codd in 1994 and contracted by Arbor
Software*
• Generally synonymous with earlier terms such as
Decisions Support, Business Intelligence,
Executive Information System
• OLAP = Multidimensional Database
48. 48
Use/Nature of OLAP Analysis
• Performs Aggregation -- (total sales, percent-to-
total)
• Performs Comparison -- Budget vs. Expenses
• Performs Ranking -- Top 10 customers, quartile
analysis
• Access to detailed and aggregate data
• Complex criteria specification
• Visualization
50. 50
From Tables and Spreadsheets to
Data Cubes
• A data warehouse is based on a multidimensional data model which views
data in the form of a data cube
• A data cube, such as sales, allows data to be modeled and viewed in multiple
dimensions
– Dimension tables, such as item (item_name, brand, type), or time(day,
week, month, quarter, year)
– Fact table contains measures (such as dollars_sold) and keys to each of
the related dimension tables
• In data warehousing literature, an n-D base cube is called a base cuboid. The
topmost 0-D cuboid, which holds the highest-level of summarization, is called
the apex cuboid. The lattice of cuboids forms a data cube.
51. 51
Conceptual Modeling
of Data Warehouses
• Modeling data warehouses: dimensions & measures
– Star schema: A fact table in the middle connected to a set
of dimension tables
– Snowflake schema: A refinement of star schema where
some dimensional hierarchy is normalized into a set of
smaller dimension tables, forming a shape similar to
snowflake
– Fact constellations: Multiple fact tables share dimension
tables, viewed as a collection of stars, therefore called
galaxy schema or fact constellation
52. 52
Example of Star Schema
time_key
day
day_of_the_week
month
quarter
year
time
location_key
street
city
province_or_street
country
location
Sales Fact Table
time_key
item_key
branch_key
location_key
units_sold
dollars_sold
avg_sales
Measures
item_key
item_name
brand
type
supplier_type
item
branch_key
branch_name
branch_type
branch
53. 53
Example of Snowflake Schema
time_key
day
day_of_the_week
month
quarter
year
time
location_key
street
city_key
location
Sales Fact Table
time_key
item_key
branch_key
location_key
units_sold
dollars_sold
avg_sales
Measures
item_key
item_name
brand
type
supplier_key
item
branch_key
branch_name
branch_type
branch
supplier_key
supplier_type
supplier
city_key
city
province_or_street
country
city
55. 55
A Concept Hierarchy: Dimension (location)
all
Europe North_America
MexicoCanadaSpainGermany
Vancouver
M. WindL. Chan
...
......
... ...
...
all
region
office
country
TorontoFrankfurtcity
56. 56
Specification of Hierarchies
• Schema hierarchy
day < {month < quarter; week} < year
• Set_grouping hierarchy
{1..10} < inexpensive
57. 57
Multidimensional Data
• Sales volume as a function of product,
month, and region
ProductRegion
Month
Dimensions: Product, Location, Time
Hierarchical summarization paths
Industry Region Year
Category Country Quarter
Product City Month Week
Office Day
59. Need of OLAP
• OLAP (online analytical processing) is computer
processing that enables a user to easily and selectively
extract and view data from different points of view.
• Ex: Execute Query, Analyze Data ,Comparative Analysis,
Generate Report.
• To facilitate these, OLAP data is stored in
a multidimensional database.
• OLAP software can locate the intersection of
dimensions (all products sold in the Eastern region
above a certain price during a certain time period) and
display them.
63. MOLAP SERVER
• Uses MDDBMS to organize and navigate data.
• Structure of a multidimensional database is generally
referred to as a cube.
• Data Structure: Array
• MOLAP cube structure allows for particularly fast,
flexible data-modeling and calculation
• It incorporate advanced array-processing techniques
and algorithms for managing data and calculations. As a
result, multidimensional databases can store data very
efficiently and process calculations in a fraction of the
time required of relational-based products.
64. Advantage-MOLAP
• Provides maximum query performance, because all the required data (a
copy of the detail data and calculated aggregate data) are stored in the
OLAP server itself and there is no need to refer to the underlying relational
database
Drawback-MOLAP
• However, MOLAP system implementations have very little in common,
because no multidimensional logical model standard has yet been set.
• The lack of a common standard is a problem being progressively solved. This
means that MOLAP tools are becoming more and more successful after their
limited implementation for many years.
Example
Organization tool :
• Microsoft (Analysis Services)
• Oracle (Hyperion)
67. ROLAP Server
• Data Structure: Table
• Provides multidimensional analysis of data,
stored in a Relational database(RDBMS) ,i.e.
directly access data stored in relational
databases.
• ROLAP access a RDBMS by using SQL (structured
query language), which is the standard language
that is used to define and manipulate data in an
RDBMS.
• Subsequent process are :accepts requests from
clients, translates them into SQL statements, and
passes them on to the RDBMS.
• ROLAP products provide GUIs to perform data
analysis(End-User/Executives).
68. Advantage of ROLAP
• Ability to view the data in near real-time(Can Access Transactional Data).
• Since ROLAP does not make another copy of data as in case of MOLAP, it has
less storage requirements. This is very advantageous for large datasets which
are queried infrequently such as historical data.
Drawback of ROLAP
• Compared to MOLAP the query response time and Processing time is also
typically slower because everything is stored on relational database and not
locally on the OLAP server.
Example-ROLAP Tools
Vendors Tools
• Information advantage (Axsys)
• Microstrategy (Dss agent/ Dss server)
• Platinum/Prodea software (Beacon)
• Sybase (High gate project)
71. Managed Query Environment/HOLAP
• HOLAP(Hybrid OLAP) a combination of both
ROLAP and MOLAP can provide
multidimensional analysis simultaneously of
data stored in a multidimensional database
and in a relational database(RDBMS).
72. Advantage of HOLAP
• HOLAP balances the disk space requirement, as it only stores
the aggregate data on the OLAP server and the detail data
remains in the relational database. So no duplicate copy of
the detail data is maintained on server.
Drawback of HOLAP
• Query performance (response time) degrades if it has to drill
through the detail data from relational data store, in this case
HOLAP performs very much like ROLAP.
73. Comparison of OLAP Server’s
MOLAP ROLAP HOLAP
ADVANTAGE
Provides maximum query
performance, because all
the required data (a copy
of the detail data and
calculated aggregate data)
are stored in the OLAP
server itself and there is no
need to refer to the
underlying relational
database
•Ability to view the data in
near real-time.
•Since ROLAP does not
make another copy of data
as in case of MOLAP, it has
less storage requirements.
This is very advantageous
for large datasets which
are queried infrequently
such as historical data.
•HOLAP balances the disk
space requirement, as it
only stores the aggregate
data on the OLAP server
and the detail data remains
in the relational database.
•So no duplicate copy of
the detail data is
maintained.
74. Comparison of OLAP Server’s
MOLAP ROLAP HOLAP
DISADVANTAGE
•However, MOLAP system
implementations have very
little in common, because no
multidimensional logical
model standard has yet been
set.
•MOLAP stores a copy of the
relational data at OLAP server
and so requires additional
investment for storage
Compared to MOLAP or
HOLAP the query response is
generally slower because
everything is stored on
relational database and not
locally on the OLAP server.
Query performance (response
time) degrades if it has to drill
through the detail data from
relational data store, in this
case HOLAP performs very
much like ROLAP.
76. • Dr. E.F. Codd, the “father” of the
relational model, has formulated a
list of guide lines and requirements
as the basis for selecting OLAP
systems/Server.
77. GUIDELINES
• Multidimensional conceptual view
A tool should provide users with a multidimensional model
that corresponds to the business problems and is
spontaneously analytical and easy to use.
• Accessibility
The OLAP system should be able to access data from all
heterogeneous enterprise data source required for the
analysis.
• Unrestricted cross-dimensional operations
The OLAP system must be able to recognize dimensional
hierarchies and automatically perform associated roll-up-
calculations within and across dimensions.
78. GUIDELINES(CONT..)
• Consistent reporting performance
As the number of dimensions and the size of the database
increase, users should not recognize any significant
degradation in performance.
• Intuitive data manipulation
Consolidation path reorientation (pivoting), drill-down and roll-
up, and other manipulations should be accomplished via direct
point-and click, drag and drop actions on the cells of the cube.
• Multiuser support
The OLAP system must be able to support a work group of
users working concurrently on a specific model.
79. GUIDELINES(CONT..)
• Transparency
The OLAP system’s technology, the underlying
database and computing architecture
(client/server, gateways, etc.) and the
heterogeneity of input data sources should be
transparent to users to maintain their
productivity and proficiency with familiar front-
end environments and tools (e.g., MS Windows ,
MS Excel).
80. GUIDELINES(CONT..)
• Client/server architecture
The OLAP system has to conform to client/server
architectural principles for maximum price and
performance, flexibility, adaptively and interoperability.
• Flexible reporting
The ability to arrange rows, columns and cells in a
fashion that facilitates analysis by spontaneous visual
presentation of analytical reports must exist.
81. GUIDELINES(CONT..)
• Comprehensive database management tools
These tools should functions as an integrated
centralized tool and allow for database
management for the distributed enterprise.
• The ability to drill down to detail (source record) level
This means that the tools should allow for a
smooth transition from the multidimensional
(pre aggregated) database to the detail record
level of the source relations data bases.
83. Cognos Impromptu
• Impromptu is an interactive database reporting
tool from IBM- Cognos Corporation.
• Provides Flexible data warehousing and
database reporting solution.
• Cognos Impromptu is an intuitive, user-friendly
system that enables non-technical personnel
(Power User) to quickly and easily design and
distribute business intelligence reports
• Easy-to-use graphical user interface.
85. Cognos Impromptu(Cont..)
• In terms of scalability, support single user
reporting on personal data, or thousand of
users reporting on data from large warehouse.
• When using the Impromptu tool, no data is
written or changed in the database. It is only
capable of reading the data and generating
report.
• Extensive reporting capabilities allow users to
create one-time and recurring reports that
support your exact information requirements
and dynamic business needs.
88. Cognos Impromptu-Catalog
• Catalog contains metadata which is used retrieved by warehouse
database.
• A catalog is a set of instructions containing information about the
data items to be retrieved and the database columns in a user
friendly way.
• A catalog acts as an interface between the End-user and the data
base thereby hiding the complexities of the database.
• A catalog contains Folders, Calculations, Conditions(Filters) and
prompts.
• Catalog does not contain any data,It just contains the table
structures and definitions(Like Meta data).
89. Cognos Impromptu-Catalog
A catalog contains:
Folders—meaningful groups of information representing
columns from one or more tables
Columns—individual data elements that can appear in one
or more folders
Calculations—expressions used to compute required
values from existing data.
Conditions—used to filter information so that only a
certain type of information is displayed
Prompts—pre-defined selection criteria prompts that
users can include in reports they create Other
components, such as metadata, a logical database name,
join information, and user classes
90. Cognos Impromptu-Catalog
• There are two different types of catalogs available with
Cognos :
Personal Catalog: Only the creator can make use of it.
Shared Catalog: A catalog is kept in a common server,
where users can access it to create reports using it.
91. The following table shows Sybase DDL statements that create a table named
ACCOUNTS using the login BIADMIN, together with the equivalent mapping in
Impromptu.
92.
93. Impromptu's main features
• Flexible report creation: frame-based report builder
with features such as prompts, pick lists, filters, and
grouping, sorting and formatting capabilities. Provides
powerful data summary and calculation features.
• Linked reports: a report author can easily create a
system of linked reports to explore the data and move
from summary to detail. Enables queries and reports
that are quickly and easily designed and distributed.
• Supports the creation of customized reports ranging
from simple lists to series of interactive, linked reports
with drill-down capabilities.
94. Impromptu's main features(Cont..)
• Powerful summaries and calculations.
• Supports the creation of one-time and
recurring reports.
• Advanced reporting options let users build a
wide variety of reports: grouped lists,
crosstabs, charts and more.
• Provides a variety of output formats including
PDF and formatted Excel spreadsheets.
95. Benefits of Cognos Impromptu
• Reduces the resources and time historically
required to generate comprehensive reports.
• Effectively and efficiently supports
information requirements for your dynamic
business needs.
• Enables non-technical personnel to generate
professional, graphically-enhanced reports.
• Improves efficiency with automated report
generation and electronic distribution.