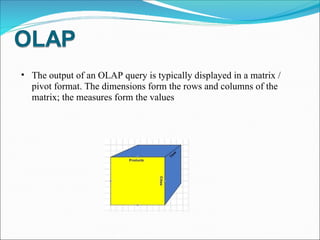
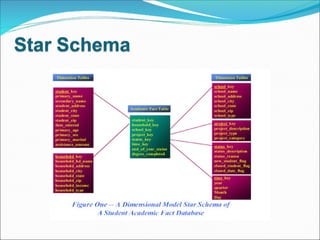
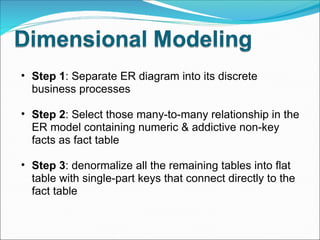
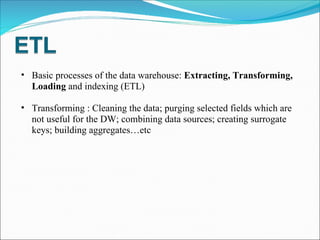
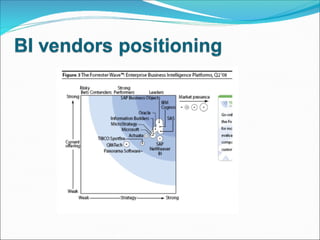
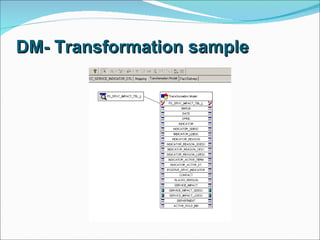
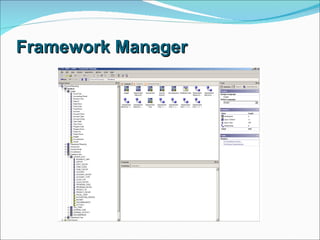
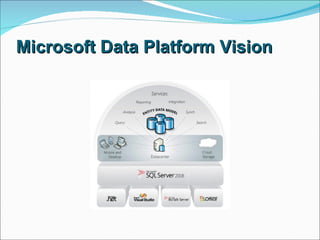
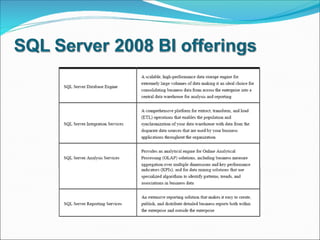
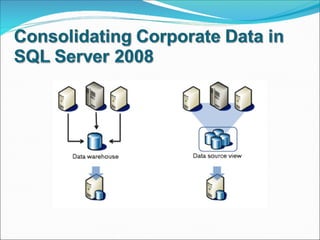
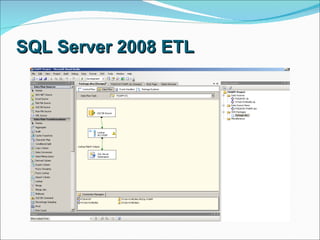
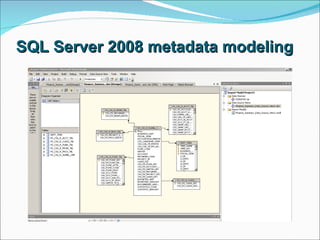
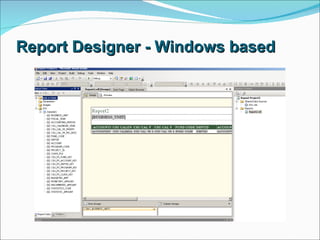
Knowledge share Note: Please go green, it is not recommended to print this presentation out on papers!!
Introduce some fundamental concepts of Business Intelligence (BI) and Data Warehouse (DW) technology to ITS associates who are interested in learning the basics of BI & DW
Basic DW Concepts & Terms Main DW processes IBM Cognos BI basic MS SQL Server 2008 BI basic
Basic Concepts & Terms
BI  refers to  technologies, applications and practices  for the collection, integration, analysis, and presentation of business information The purpose of BI is to support better business decision making BI  systems provide historical, current, and predictive views of business operations, most often using data that has been gathered into a  data warehouse  or a data mart and occasionally working from operational data
Performance Management  is   the new generation of BI, is a set of processes that help organizations optimize their business performance Getting answers and acting on them means integrating reporting and analysis, planning, and measuring and monitoring—across your organization Performance managers look at metrics, plans, and reports in their functional area to make the best possible decisions
For proactively identifying market trends and opportunities For prioritizing business activities and expenditure to ensure the most efficient use of the available resources and make effective business decisions For making intelligent, informed decisions and contribute to business success For acting on the results of analysis of a complete and consistent version of all enterprise data
Dashboard on portal E.g. Registration Trend provide info. for strategic & resources planning
Dashboard E.g. Visualization of expenses by departments can save data processing time for finance managers & VPs
Scorecard E.g. Scorecards highlight exceptions, which allow managers to take actions
DW is a repository of an organization's electronically stored data DWs are designed to facilitate reporting and analysis an expanded definition for DW  includes business intelligence (BI) tools which extract, transform, and load (ETL) data into the repository, and tools to manage and retrieve metadata
DW provides a common data model for all data of interest regardless of the data's source. This makes it easier to report and analyze information than it would be if multiple data models were used to retrieve information such as sales invoices, order receipts, general ledger charges, etc… Prior to loading data into the data warehouse, inconsistencies are identified and resolved. This greatly simplifies reporting and analysis Information in the data warehouse is under the control of data warehouse users so that, even if the source system data is purged over time, the information in the warehouse can be stored safely for extended periods of time.
Because they are separate from operational systems, data warehouses provide retrieval of data without slowing down operational systems Data warehouses facilitate decision support system applications such as trend reports (e.g., the items with the most sales in a particular area within the last two years), exception reports, and reports that show actual performance versus goals
DW metadata systems are sometimes separated into two sections: back room  metadata that are used for Extract, Transform, Load (ETL) functions to get OLTP (Online Transaction Processing) data into a data warehouse  front room  metadata that are used to label screens and create reports
OLAP is an approach to quickly answer multi-dimensional analytical queries   The term OLAP was created as a slight modification of the traditional database term OLTP( Online Transaction Processing ) Database configured for OLAP use a multidimensional data model, allowing for complex analytical and ad-hoc queries with a rapid execution time.
The output of an OLAP query is typically displayed in a matrix / pivot format. The dimensions form the rows and columns of the matrix; the measures form the values
MOLAP ( Multidimensional  OLAP) is the 'classic' form of OLAP and is sometimes referred to as just OLAP. MOLAP uses database structures that are generally optimal for attributes such as time period, location, product or account code. The way that each dimension will be aggregated is defined in advance by one or more hierarchies.
Fast query performance due to optimized storage, multidimensional indexing and caching Smaller on-disk size of data compared to data stored in relational database due to compression techniques Automated computation of higher level aggregates of the data.
ROLAP  (Relational OLAP) works directly with relational databases. The base data and the dimension tables are stored as relational tables and new tables are created to hold the aggregated information. Depends on a specialized schema design
more scalable in handling large data volumes load times are generally much shorter than with the automated MOLAP loads with fine tune ETL The data is stored in a standard RDBMS and can be accessed by any SQL reporting tool
Most commercial OLAP tools now use a "Hybrid OLAP" (HOLAP) approach, which allows the model designer to decide which portion of the data will be stored in MOLAP and which portion in ROLAP
Main DW processes
Dimensional Modeling is the only viable technique for delivering data to end users in DW A dimensional model has: Fact table which has multipart keys Dimension tables which have single part primary key corresponds to only one key of the fact table
 
Step 1 : Separate ER diagram into its discrete business processes Step 2 : Select those many-to-many relationship in the ER model containing numeric & addictive non-key facts as fact table Step 3 : denormalize all the remaining tables into flat table with single-part keys that connect directly to the fact table
Basic processes of the data warehouse:  Extracting, Transforming, Loading  and indexing (ETL) Transforming : Cleaning the data; purging selected fields which are not useful for the DW; combining data sources; creating surrogate keys; building aggregates…etc


IBM Cognos 8 BI Architecture
The zero footprint, Web-based interfaces include: Cognos Connection  – Cognos 8 portal Query Studio  – ad hoc report  Report Studio   – report authoring tool Analysis Studio  Event Studio  Metric Studio
Cognos Connection
Query Studio for Ad Hoc reports
Report Studio for any report
 
Windows-based User Interfaces Data Manager  – a  ETL tool Framework Manager  – a  metadata modeling tool Metric Designer Transformer Map Manager
Data Manager – jobstream sample
DM – simple Fact Build sample
DM- Transformation sample
Framework Manager
 
Microsoft Data Platform Vision
 
Use  Excel® 2007  as an interface for OLAP analysis, data mining, and report rendering Render SQL Server 2008 Reporting Services reports in  Word  format Render decision trees, regression trees, cluster diagrams, and dependency nets with  Visio 2007
Use  SharePoint® Server  as a central location for placing all enterprise-wide BI content and tools, so that everyone in the organization can view and interact with relevant and timely analytical views, reports, and KPIs Through tight interoperability with  Microsoft Visual Studio® , developers can easily build and maintain robust, secure, scalable BI applications
SQL Server 2008 BI
 
SQL Server 2008 ETL
SQL Server 2008 metadata modeling
Report Designer - Windows based
Report published on web
Report Builder – Web Based
MS Excel Data Mining Add-In
The Data Warehouse Lifecycle Toolkit, Ralph Kimball, 1998 Cognos 8 user guides from Cognos website SQL Server 2008 BI white papers from MicroSoft SQL Server website Wikipedia
 

Bi Dw Presentation

  • 1.
    Knowledge share Note:Please go green, it is not recommended to print this presentation out on papers!!
  • 2.
    Introduce some fundamentalconcepts of Business Intelligence (BI) and Data Warehouse (DW) technology to ITS associates who are interested in learning the basics of BI & DW
  • 3.
    Basic DW Concepts& Terms Main DW processes IBM Cognos BI basic MS SQL Server 2008 BI basic
  • 4.
  • 5.
    BI refersto technologies, applications and practices for the collection, integration, analysis, and presentation of business information The purpose of BI is to support better business decision making BI systems provide historical, current, and predictive views of business operations, most often using data that has been gathered into a data warehouse or a data mart and occasionally working from operational data
  • 6.
    Performance Management is the new generation of BI, is a set of processes that help organizations optimize their business performance Getting answers and acting on them means integrating reporting and analysis, planning, and measuring and monitoring—across your organization Performance managers look at metrics, plans, and reports in their functional area to make the best possible decisions
  • 7.
    For proactively identifyingmarket trends and opportunities For prioritizing business activities and expenditure to ensure the most efficient use of the available resources and make effective business decisions For making intelligent, informed decisions and contribute to business success For acting on the results of analysis of a complete and consistent version of all enterprise data
  • 8.
    Dashboard on portalE.g. Registration Trend provide info. for strategic & resources planning
  • 9.
    Dashboard E.g. Visualizationof expenses by departments can save data processing time for finance managers & VPs
  • 10.
    Scorecard E.g. Scorecardshighlight exceptions, which allow managers to take actions
  • 11.
    DW is arepository of an organization's electronically stored data DWs are designed to facilitate reporting and analysis an expanded definition for DW includes business intelligence (BI) tools which extract, transform, and load (ETL) data into the repository, and tools to manage and retrieve metadata
  • 12.
    DW provides acommon data model for all data of interest regardless of the data's source. This makes it easier to report and analyze information than it would be if multiple data models were used to retrieve information such as sales invoices, order receipts, general ledger charges, etc… Prior to loading data into the data warehouse, inconsistencies are identified and resolved. This greatly simplifies reporting and analysis Information in the data warehouse is under the control of data warehouse users so that, even if the source system data is purged over time, the information in the warehouse can be stored safely for extended periods of time.
  • 13.
    Because they areseparate from operational systems, data warehouses provide retrieval of data without slowing down operational systems Data warehouses facilitate decision support system applications such as trend reports (e.g., the items with the most sales in a particular area within the last two years), exception reports, and reports that show actual performance versus goals
  • 14.
    DW metadata systemsare sometimes separated into two sections: back room metadata that are used for Extract, Transform, Load (ETL) functions to get OLTP (Online Transaction Processing) data into a data warehouse front room metadata that are used to label screens and create reports
  • 15.
    OLAP is anapproach to quickly answer multi-dimensional analytical queries   The term OLAP was created as a slight modification of the traditional database term OLTP( Online Transaction Processing ) Database configured for OLAP use a multidimensional data model, allowing for complex analytical and ad-hoc queries with a rapid execution time.
  • 16.
    The output ofan OLAP query is typically displayed in a matrix / pivot format. The dimensions form the rows and columns of the matrix; the measures form the values
  • 17.
    MOLAP ( Multidimensional OLAP) is the 'classic' form of OLAP and is sometimes referred to as just OLAP. MOLAP uses database structures that are generally optimal for attributes such as time period, location, product or account code. The way that each dimension will be aggregated is defined in advance by one or more hierarchies.
  • 18.
    Fast query performancedue to optimized storage, multidimensional indexing and caching Smaller on-disk size of data compared to data stored in relational database due to compression techniques Automated computation of higher level aggregates of the data.
  • 19.
    ROLAP  (Relational OLAP)works directly with relational databases. The base data and the dimension tables are stored as relational tables and new tables are created to hold the aggregated information. Depends on a specialized schema design
  • 20.
    more scalable inhandling large data volumes load times are generally much shorter than with the automated MOLAP loads with fine tune ETL The data is stored in a standard RDBMS and can be accessed by any SQL reporting tool
  • 21.
    Most commercial OLAP tools nowuse a "Hybrid OLAP" (HOLAP) approach, which allows the model designer to decide which portion of the data will be stored in MOLAP and which portion in ROLAP
  • 22.
  • 23.
    Dimensional Modeling isthe only viable technique for delivering data to end users in DW A dimensional model has: Fact table which has multipart keys Dimension tables which have single part primary key corresponds to only one key of the fact table
  • 24.
  • 25.
    Step 1 :Separate ER diagram into its discrete business processes Step 2 : Select those many-to-many relationship in the ER model containing numeric & addictive non-key facts as fact table Step 3 : denormalize all the remaining tables into flat table with single-part keys that connect directly to the fact table
  • 26.
    Basic processes ofthe data warehouse: Extracting, Transforming, Loading and indexing (ETL) Transforming : Cleaning the data; purging selected fields which are not useful for the DW; combining data sources; creating surrogate keys; building aggregates…etc
  • 27.
  • 28.
  • 29.
  • 30.
    IBM Cognos 8BI Architecture
  • 31.
    The zero footprint,Web-based interfaces include: Cognos Connection – Cognos 8 portal Query Studio – ad hoc report Report Studio – report authoring tool Analysis Studio Event Studio Metric Studio
  • 32.
  • 33.
    Query Studio forAd Hoc reports
  • 34.
  • 35.
  • 36.
  • 37.
    Windows-based User InterfacesData Manager – a ETL tool Framework Manager – a metadata modeling tool Metric Designer Transformer Map Manager
  • 38.
    Data Manager –jobstream sample
  • 39.
    DM – simpleFact Build sample
  • 40.
  • 41.
  • 42.
  • 43.
  • 44.
  • 45.
    Use Excel®2007 as an interface for OLAP analysis, data mining, and report rendering Render SQL Server 2008 Reporting Services reports in Word format Render decision trees, regression trees, cluster diagrams, and dependency nets with Visio 2007
  • 46.
    Use SharePoint®Server as a central location for placing all enterprise-wide BI content and tools, so that everyone in the organization can view and interact with relevant and timely analytical views, reports, and KPIs Through tight interoperability with Microsoft Visual Studio® , developers can easily build and maintain robust, secure, scalable BI applications
  • 47.
  • 48.
  • 49.
  • 50.
    SQL Server 2008metadata modeling
  • 51.
    Report Designer -Windows based
  • 52.
  • 53.
  • 54.
    MS Excel DataMining Add-In
  • 55.
    The Data WarehouseLifecycle Toolkit, Ralph Kimball, 1998 Cognos 8 user guides from Cognos website SQL Server 2008 BI white papers from MicroSoft SQL Server website Wikipedia
  • 56.