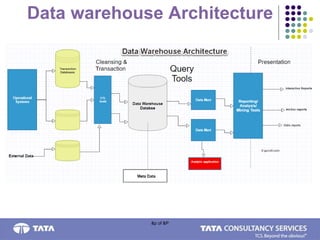
Data Warehouse
Data Warehouse
A data warehouse is a
 consolidated view of enterprise data
 specifically structured for dynamic queries and analytics
Characteristics
 Integrated
 Subject-oriented
 Time-variant
 Non-volatile
&p of &P
&p of &P
DWH - Definition
1.“A data warehouse is a copy of transaction data specifically
structured for querying and reporting”
2.“The data warehouse (DW) is a subject- oriented, integrated, time
variant (temporal) and non-volatile collection of data used to support
the strategic decision making process for the enterprise or business
intelligence”
&p of &P
DWH - Purpose
• Central point of data integration
• Common view of enterprise data
• Stable source of history
• Consistent, reliable and timely reporting
&p of &P
DWH - Features
• Store large volumes of data
• Maintained separately from the organization’s operational
systems/databases
• Relatively static in terms of update (Infrequent updates)
Data warehousing
 Enabling technology that facilitates improved/enhanced
decision making
 Process and not a product
 Technique – Data management
&p of &P
Data warehouse Architecture
&p of &P
Data Warehouse Architecture
DWH follows a 3-Tier architecture:
 Bottom Tier: The database of the Datawarehouse servers as the bottom tier. It is usually a
relational database system. Data is cleansed, transformed, and loaded into this layer using back-
end tools.
 Middle Tier: In the middle tier, we have the OLAP Server that can be implemented in either of the
following ways:-
1.) By Relational OLAP (ROLAP), which is an extended relational database management
system. The ROLAP maps the operations on multidimensional data to standard relational operations.
2.) By Multidimensional OLAP (MOLAP) model, which directly implements the
multidimensional data and operations.
 Top-Tier: The top tier is a front-end client layer. Top tier is the tools and API that you connect and
get data out from the data warehouse. It could be Query tools, reporting tools etc. Example: BO,
OBIEE etc.
&p of &P
&p of &P
Operational data Store (ODS) :
 ODS are the sources from where data is gathered for the further
processes in data warehouse.
 It can be from various sources such as legacy System, txt file,
xls file, oracle, Sybase data bases etc.
ETL process :
Extraction, Transformation, and Loading, ETL refers to the methods
involved
in accessing and manipulating source data and loading it into target
database.
 The first step in ETL process is mapping the data between source systems
and target database (data warehouse or data mart).
 The second step is cleansing of source data in staging area.
 The third step is transforming cleansed source data and then loading into
the target system.
&p of &P
Reporting tools :
• The principal purpose of data warehousing is to provide
information to business users for strategic decision-making.
• These users interact with the warehouse using end-user access
tools.
• The data warehouse must efficiently support adhoc and routine
analysis.
Following are the end user access tools :
 Data reporting and query tools
 Online analytical processing (OLAP) tools
 Data mining tools
&p of &P
Data Mart :
A data mart is a Data warehouse that is Subject Specific in scope.
It is subset of a Data Warehouse and supports the requirements
of a particular department or business function.
Reasons for creating a Data Mart :
 Give users access to the data that they need to analyze most often.
 To improve the end-user response time due to the reduction in
volume of data to be accessed.
 Potential users of a data mart are more clearly defined and can be
More easily targeted to obtain support for a data mart project rather
than a corporate data warehouse project.
 A data mart is a subset of data warehouse that is designed for a
particular line of business, such as sales, marketing, or finance.
 In a dependent data mart, data can be derived from an enterprise-
wide data warehouse. In an independent data mart, data can be
collected directly from sources.
&p of &P
Data Warehouse and Data marts:
&p of &P
Dimensional Modeling :
 Provides the ability to analyze metrics in different dimensions - such as
time, geography, product, etc.
 For example, sales for the company are up. What region is most
responsible for this increase? Which store in this region is most
responsible for the increase? What particular product category or
categories contributed the most to the increase?
 Answering these types of questions in order means that you are
performing an OLAP analysis.
&p of &P
Dimensional Modeling :
 Dimensional modeling is a technique for conceptualizing and
visualizing data models as a set of measures that are described
by common aspects of the business.
 It is especially useful for summarizing and rearranging the data and
presenting views of the data to support data analysis. Dimensional
modeling focuses on numeric data, such as values, counts, weights,
balances, and occurrences.
Basic concepts of Dimension
Modeling :
Facts - A fact is a collection of related data items, consisting of measures
and context data. Each fact typically represents a business item, a
business transaction,
or
An event that can be used in analyzing the business or business
processes. In a data warehouse, facts are implemented in the core tables
in which all of the numeric data is stored.
&p of &P
Dimensions–
A dimension is a collection of members or units of the same type of
views.
In a diagram, a dimension is usually represented by an axis.
In a dimensional model, every data point in the fact table is
associated with one and only one member from each of the
multiple dimensions.
 Dimensions are the parameters over which we want to perform
OLAP.
Measures (variables)-
A measure is a numeric attribute of a fact, representing the
performance or behavior of the business relative to the dimensions.
A measure is determined by combinations of the members of the
dimensions and is located on facts.
&p of &P
Dimension: A category of information. For example, the time
dimension.
Attribute: A unique level within a dimension. For example, Month
is an attribute in the Time Dimension.
Fact Table: A fact table is a table that contains the measures of
interest. For example, sales amount would be such a measure.
&p of &P
Star Schema :
Star Schema is a relational database schema for representing
multidimensional data.
 It is the simplest form of data warehouse schema that contains one or
more dimensions and fact tables.
 It is called a star schema because the entity-relationship diagram
between
 dimensions and fact tables resembles a star where one fact table is
connected to multiple dimensions.
 The center of the star schema consists of a large fact table and it points
towards the dimension tables. The advantages of star schema are
slicing down, performance increase and easy understanding of data.
&p of &P
Star Schema:
&p of &P
Snowflake Schema :
A snowflake schema is a term that describes a star schema structure
normalized through the use of outrigger tables. i.e. dimension table
hierarchies are broken into simpler tables.
In OLAP, Snowflake schema approach increases the number of joins
and poor performance in retrieval of data.
In few organizations, they try to normalize the dimension tables to save
space. Since dimension tables hold less space, Snowflake schema
approach may be avoided .
&p of &P
Snow Flake Schema:
&p of &P
Slowly Changing Dimension:
Dimensions that change over time are called Slowly Changing dimensions.
The changing dimension problem means that the proper description of the
old client must be used with the old data warehouse schema.
Usually the data warehouse must assign generalized key to these important
dimensions in order to distinguish multiple snapshots of clients over a
period of time.
&p of &P
Slowly Changing Dimension:
Slowly Changing Dimensions are often categorized into three
types
namely Type1, Type2 and Type3.
Type 1: Overwriting the old values.
In this Type 1, it Overwrite the old values.
Type 2: Creating an another additional record.
In this Type 2, the old values will not be replaced but a new row
containing
the new values will be added to the table.
Type 3: Creating new fields.
In this Type 3, the latest update to the changed values can be
seen.
&p of &P
Surrogate Keys :
Definition : A surrogate key is an artificial or synthetic key that is
used as a substitute for a natural key.
The surrogate keys basically serve to join the dimension tables
to the fact table.
Surrogate keys serve as an important means of identifying each
instance or entity inside a dimension table.
&p of &P
Reasons for using surrogate
keys are :
1. Data tables in various OLTP source systems may use different keys
for the same entity, It may also be possible that a single key is being
used by different instances of the same entity, This means that different
customers might be represented using the same key across different
OLTP systems.
2.This can be a major problem when trying to consolidate information
from various source systems, or for companies trying to create/modify
data warehouses after mergers and acquisitions.
3.Existing systems that provide historical data might have used a
different numbering system than a current OLTP system.
&p of &P
Junk Dimension
 In data warehouse design, frequently we run into a situation where there are yes/no
indicator fields in the source system.
 Keeping all those indicator fields in the fact table results the amount of information stored
in the fact table increases tremendously, leading to possible performance and
management issues.
 In a junk dimension, we combine these indicator fields into a single dimension
&p of &P
Junk Dimension
Example:-
&p of &P
Junk Dimension
&p of &P
Factless Fact
 Does not have any measures.
 It is essentially an intersection of dimensions
For example, think about a record of student attendance in classes. In this case, the fact
table would consist of 3 dimensions: the student dimension, the time dimension, and the class
dimension. This factless fact table would look like the following:
 How many students attended a particular class on a particular day?
 How many classes on average does a student attend on a given day?
29
Extract, Transform, and Load
RDBMS Mainframe Other
Operational Systems
Data
Warehouse
Decision Support
• Transaction level data
• Current
• Normalized or De-
Normalized data
• Aggregated data
• Historical
ETL
Extract Load
Transform
Cleanse Data
Apply Business Rules
Aggregate Data
Consolidate Data
De-normalize
&p of &P
The ETL Process Consists of :
Capture
Data Cleansing and Transform
Load
Capture :
Obtaining a snapshot of a chosen subset of the source data for loading into
the data warehouse, Extracting the data from various sources and gathering
at one place, from where it is used to carry out the next processes of ETL.
&p of &P
Data Cleansing :
It is mainly related to upgrade the quality of data.
As the data is gathered from multiple resources, issues related
with the data are:-
1) Data is in multiple formats
2) Incomplete and missing data elements etc.
It deals with fixing errors such as misspellings, erroneous dates,
incorrect field usage, mismatched addresses, missing data,
duplicate data and inconsistencies
&p of &P
Transform :
To convert data from format of operational system to format of data
warehouse, It can be achieved with two methods:
1) Record Level
2) Field Level
Loading : Place transformed data into the warehouse after extracting,
cleaning and transforming, data must be loaded into the warehouse.
It can be done with two methods:
1) Refresh mode: Bulk rewriting of target data at periodic intervals
Particular time interval is decided for loading of data into warehouse.
e.g. Weekly or daily.
2) Update mode: Only changes in source data are written to data
warehouse
It means, as soon as any change has occurred that is loaded in DW, It
is also called as incremental mode.
OLAP (On-Line Analytical
Processing) :
Process of converting raw data into business information through
multidimensional analysis.
or
It’s a set of graphical tool that provides user with multidimensional views of
their data and allows them to analyze the data using simple windowing
techniques.
&p of &P
USE :
 OLAP deliver warehouse applications such as performance
reporting, sales forecasting, product line and customer profitability,
sales analysis, marketing analysis.
Applications that require historical, projected and derived data
With OLAP servers’ robust calculation engines, historical data is
made vastly more useful by transforming it into derived and
projected data.
Users gain broader insights by combining standard access tools
with a Powerful analytic engine.
&p of &P
OLAP:
Example:
 Sales for the company are up. What region is most responsible for this
increase? Which store in this region is most responsible for the increase?
What particular product category or categories contributed the most to the
increase?
 Answering these types of questions in order means that you are
performing an OLAP analysis.
• Cities New jersey and Lost Angles
and rolled up into country USA.
• The sales figure of New Jersey
and Los Angeles are 440 and
1560 respectively. They become
2000 after roll-up
&p of &P
OLAP operations :
1) Roll-up:
 Roll-up is also known as "consolidation" or "aggregation
• Q1 is drilled down to months
January, February, and March.
Corresponding sales are also
registers.
• In this example, dimension months
are added.
&p of &P
OLAP operations :
2) Drill-down: In drill-down data is fragmented into smaller parts.
Drill Down is going down the hierarchy to get detailed data.
• Dimension Time is Sliced with Q1
as the filter.
• A new cube is created altogether.
&p of &P
OLAP operations :
3) Slice: Here, one dimension is selected, and a new sub-cube is created
• Dimensions Location and Time are
selected to create a new sub-
cube.
• A new cube is created altogether.
&p of &P
OLAP operations :
4) Dice: This operation is similar to a slice. The difference in dice is you select 2 or
more dimensions that result in the creation of a sub-cube
&p of &P
List of OLAP Tools :
Microsoft - MS SQL Server 2005 with Analysis Services
Cognos
Business Objects
Microstrategy - DSS/Server
&p of &P
OLTP (On-Line Transaction
Processing)
OLTP is reliable and efficient processing of a large number of transactions
and ensuring data consistency OLTP systems are built with update
operations in mind, resulting in normalization and greatly reduced browse
performance
Functions of OLTP Systems :
Maintain a database that is an accurate model of some real-world
Enterprise OLTP systems hold current data and detailed data
It supports day to day decisions and is application oriented
&p of &P
Conclusion :
A Relational Database is designed for query and analysis rather than
transaction processing. Where as data warehouse usually contains
historical data that is derived from transaction data, but it can include
data from other sources. It separates analysis workload from transaction
workload and enables a business to consolidate data from several
sources.
In addition to a relational database, a data warehouse environment
often consists of an ETL solution, an OLAP engine, client analysis tools,
and other applications that manage the process of gathering data and
delivering it to business users
&p of &P

Data warehouse

  • 1.
  • 2.
    Data Warehouse A datawarehouse is a  consolidated view of enterprise data  specifically structured for dynamic queries and analytics Characteristics  Integrated  Subject-oriented  Time-variant  Non-volatile &p of &P
  • 3.
    &p of &P DWH- Definition 1.“A data warehouse is a copy of transaction data specifically structured for querying and reporting” 2.“The data warehouse (DW) is a subject- oriented, integrated, time variant (temporal) and non-volatile collection of data used to support the strategic decision making process for the enterprise or business intelligence”
  • 4.
    &p of &P DWH- Purpose • Central point of data integration • Common view of enterprise data • Stable source of history • Consistent, reliable and timely reporting
  • 5.
    &p of &P DWH- Features • Store large volumes of data • Maintained separately from the organization’s operational systems/databases • Relatively static in terms of update (Infrequent updates) Data warehousing  Enabling technology that facilitates improved/enhanced decision making  Process and not a product  Technique – Data management
  • 6.
    &p of &P Datawarehouse Architecture
  • 7.
    &p of &P DataWarehouse Architecture DWH follows a 3-Tier architecture:  Bottom Tier: The database of the Datawarehouse servers as the bottom tier. It is usually a relational database system. Data is cleansed, transformed, and loaded into this layer using back- end tools.  Middle Tier: In the middle tier, we have the OLAP Server that can be implemented in either of the following ways:- 1.) By Relational OLAP (ROLAP), which is an extended relational database management system. The ROLAP maps the operations on multidimensional data to standard relational operations. 2.) By Multidimensional OLAP (MOLAP) model, which directly implements the multidimensional data and operations.  Top-Tier: The top tier is a front-end client layer. Top tier is the tools and API that you connect and get data out from the data warehouse. It could be Query tools, reporting tools etc. Example: BO, OBIEE etc.
  • 8.
  • 9.
    &p of &P Operationaldata Store (ODS) :  ODS are the sources from where data is gathered for the further processes in data warehouse.  It can be from various sources such as legacy System, txt file, xls file, oracle, Sybase data bases etc. ETL process : Extraction, Transformation, and Loading, ETL refers to the methods involved in accessing and manipulating source data and loading it into target database.  The first step in ETL process is mapping the data between source systems and target database (data warehouse or data mart).  The second step is cleansing of source data in staging area.  The third step is transforming cleansed source data and then loading into the target system.
  • 10.
    &p of &P Reportingtools : • The principal purpose of data warehousing is to provide information to business users for strategic decision-making. • These users interact with the warehouse using end-user access tools. • The data warehouse must efficiently support adhoc and routine analysis. Following are the end user access tools :  Data reporting and query tools  Online analytical processing (OLAP) tools  Data mining tools
  • 11.
    &p of &P DataMart : A data mart is a Data warehouse that is Subject Specific in scope. It is subset of a Data Warehouse and supports the requirements of a particular department or business function. Reasons for creating a Data Mart :  Give users access to the data that they need to analyze most often.  To improve the end-user response time due to the reduction in volume of data to be accessed.  Potential users of a data mart are more clearly defined and can be More easily targeted to obtain support for a data mart project rather than a corporate data warehouse project.  A data mart is a subset of data warehouse that is designed for a particular line of business, such as sales, marketing, or finance.  In a dependent data mart, data can be derived from an enterprise- wide data warehouse. In an independent data mart, data can be collected directly from sources.
  • 12.
    &p of &P DataWarehouse and Data marts:
  • 13.
    &p of &P DimensionalModeling :  Provides the ability to analyze metrics in different dimensions - such as time, geography, product, etc.  For example, sales for the company are up. What region is most responsible for this increase? Which store in this region is most responsible for the increase? What particular product category or categories contributed the most to the increase?  Answering these types of questions in order means that you are performing an OLAP analysis.
  • 14.
    &p of &P DimensionalModeling :  Dimensional modeling is a technique for conceptualizing and visualizing data models as a set of measures that are described by common aspects of the business.  It is especially useful for summarizing and rearranging the data and presenting views of the data to support data analysis. Dimensional modeling focuses on numeric data, such as values, counts, weights, balances, and occurrences. Basic concepts of Dimension Modeling : Facts - A fact is a collection of related data items, consisting of measures and context data. Each fact typically represents a business item, a business transaction, or An event that can be used in analyzing the business or business processes. In a data warehouse, facts are implemented in the core tables in which all of the numeric data is stored.
  • 15.
    &p of &P Dimensions– Adimension is a collection of members or units of the same type of views. In a diagram, a dimension is usually represented by an axis. In a dimensional model, every data point in the fact table is associated with one and only one member from each of the multiple dimensions.  Dimensions are the parameters over which we want to perform OLAP. Measures (variables)- A measure is a numeric attribute of a fact, representing the performance or behavior of the business relative to the dimensions. A measure is determined by combinations of the members of the dimensions and is located on facts.
  • 16.
    &p of &P Dimension:A category of information. For example, the time dimension. Attribute: A unique level within a dimension. For example, Month is an attribute in the Time Dimension. Fact Table: A fact table is a table that contains the measures of interest. For example, sales amount would be such a measure.
  • 17.
    &p of &P StarSchema : Star Schema is a relational database schema for representing multidimensional data.  It is the simplest form of data warehouse schema that contains one or more dimensions and fact tables.  It is called a star schema because the entity-relationship diagram between  dimensions and fact tables resembles a star where one fact table is connected to multiple dimensions.  The center of the star schema consists of a large fact table and it points towards the dimension tables. The advantages of star schema are slicing down, performance increase and easy understanding of data.
  • 18.
  • 19.
    &p of &P SnowflakeSchema : A snowflake schema is a term that describes a star schema structure normalized through the use of outrigger tables. i.e. dimension table hierarchies are broken into simpler tables. In OLAP, Snowflake schema approach increases the number of joins and poor performance in retrieval of data. In few organizations, they try to normalize the dimension tables to save space. Since dimension tables hold less space, Snowflake schema approach may be avoided .
  • 20.
    &p of &P SnowFlake Schema:
  • 21.
    &p of &P SlowlyChanging Dimension: Dimensions that change over time are called Slowly Changing dimensions. The changing dimension problem means that the proper description of the old client must be used with the old data warehouse schema. Usually the data warehouse must assign generalized key to these important dimensions in order to distinguish multiple snapshots of clients over a period of time.
  • 22.
    &p of &P SlowlyChanging Dimension: Slowly Changing Dimensions are often categorized into three types namely Type1, Type2 and Type3. Type 1: Overwriting the old values. In this Type 1, it Overwrite the old values. Type 2: Creating an another additional record. In this Type 2, the old values will not be replaced but a new row containing the new values will be added to the table. Type 3: Creating new fields. In this Type 3, the latest update to the changed values can be seen.
  • 23.
    &p of &P SurrogateKeys : Definition : A surrogate key is an artificial or synthetic key that is used as a substitute for a natural key. The surrogate keys basically serve to join the dimension tables to the fact table. Surrogate keys serve as an important means of identifying each instance or entity inside a dimension table.
  • 24.
    &p of &P Reasonsfor using surrogate keys are : 1. Data tables in various OLTP source systems may use different keys for the same entity, It may also be possible that a single key is being used by different instances of the same entity, This means that different customers might be represented using the same key across different OLTP systems. 2.This can be a major problem when trying to consolidate information from various source systems, or for companies trying to create/modify data warehouses after mergers and acquisitions. 3.Existing systems that provide historical data might have used a different numbering system than a current OLTP system.
  • 25.
    &p of &P JunkDimension  In data warehouse design, frequently we run into a situation where there are yes/no indicator fields in the source system.  Keeping all those indicator fields in the fact table results the amount of information stored in the fact table increases tremendously, leading to possible performance and management issues.  In a junk dimension, we combine these indicator fields into a single dimension
  • 26.
    &p of &P JunkDimension Example:-
  • 27.
    &p of &P JunkDimension
  • 28.
    &p of &P FactlessFact  Does not have any measures.  It is essentially an intersection of dimensions For example, think about a record of student attendance in classes. In this case, the fact table would consist of 3 dimensions: the student dimension, the time dimension, and the class dimension. This factless fact table would look like the following:  How many students attended a particular class on a particular day?  How many classes on average does a student attend on a given day?
  • 29.
    29 Extract, Transform, andLoad RDBMS Mainframe Other Operational Systems Data Warehouse Decision Support • Transaction level data • Current • Normalized or De- Normalized data • Aggregated data • Historical ETL Extract Load Transform Cleanse Data Apply Business Rules Aggregate Data Consolidate Data De-normalize
  • 30.
    &p of &P TheETL Process Consists of : Capture Data Cleansing and Transform Load Capture : Obtaining a snapshot of a chosen subset of the source data for loading into the data warehouse, Extracting the data from various sources and gathering at one place, from where it is used to carry out the next processes of ETL.
  • 31.
    &p of &P DataCleansing : It is mainly related to upgrade the quality of data. As the data is gathered from multiple resources, issues related with the data are:- 1) Data is in multiple formats 2) Incomplete and missing data elements etc. It deals with fixing errors such as misspellings, erroneous dates, incorrect field usage, mismatched addresses, missing data, duplicate data and inconsistencies
  • 32.
    &p of &P Transform: To convert data from format of operational system to format of data warehouse, It can be achieved with two methods: 1) Record Level 2) Field Level Loading : Place transformed data into the warehouse after extracting, cleaning and transforming, data must be loaded into the warehouse. It can be done with two methods: 1) Refresh mode: Bulk rewriting of target data at periodic intervals Particular time interval is decided for loading of data into warehouse. e.g. Weekly or daily. 2) Update mode: Only changes in source data are written to data warehouse It means, as soon as any change has occurred that is loaded in DW, It is also called as incremental mode.
  • 33.
    OLAP (On-Line Analytical Processing): Process of converting raw data into business information through multidimensional analysis. or It’s a set of graphical tool that provides user with multidimensional views of their data and allows them to analyze the data using simple windowing techniques.
  • 34.
    &p of &P USE:  OLAP deliver warehouse applications such as performance reporting, sales forecasting, product line and customer profitability, sales analysis, marketing analysis. Applications that require historical, projected and derived data With OLAP servers’ robust calculation engines, historical data is made vastly more useful by transforming it into derived and projected data. Users gain broader insights by combining standard access tools with a Powerful analytic engine.
  • 35.
    &p of &P OLAP: Example: Sales for the company are up. What region is most responsible for this increase? Which store in this region is most responsible for the increase? What particular product category or categories contributed the most to the increase?  Answering these types of questions in order means that you are performing an OLAP analysis.
  • 36.
    • Cities Newjersey and Lost Angles and rolled up into country USA. • The sales figure of New Jersey and Los Angeles are 440 and 1560 respectively. They become 2000 after roll-up &p of &P OLAP operations : 1) Roll-up:  Roll-up is also known as "consolidation" or "aggregation
  • 37.
    • Q1 isdrilled down to months January, February, and March. Corresponding sales are also registers. • In this example, dimension months are added. &p of &P OLAP operations : 2) Drill-down: In drill-down data is fragmented into smaller parts. Drill Down is going down the hierarchy to get detailed data.
  • 38.
    • Dimension Timeis Sliced with Q1 as the filter. • A new cube is created altogether. &p of &P OLAP operations : 3) Slice: Here, one dimension is selected, and a new sub-cube is created
  • 39.
    • Dimensions Locationand Time are selected to create a new sub- cube. • A new cube is created altogether. &p of &P OLAP operations : 4) Dice: This operation is similar to a slice. The difference in dice is you select 2 or more dimensions that result in the creation of a sub-cube
  • 40.
    &p of &P Listof OLAP Tools : Microsoft - MS SQL Server 2005 with Analysis Services Cognos Business Objects Microstrategy - DSS/Server
  • 41.
    &p of &P OLTP(On-Line Transaction Processing) OLTP is reliable and efficient processing of a large number of transactions and ensuring data consistency OLTP systems are built with update operations in mind, resulting in normalization and greatly reduced browse performance Functions of OLTP Systems : Maintain a database that is an accurate model of some real-world Enterprise OLTP systems hold current data and detailed data It supports day to day decisions and is application oriented
  • 42.
    &p of &P Conclusion: A Relational Database is designed for query and analysis rather than transaction processing. Where as data warehouse usually contains historical data that is derived from transaction data, but it can include data from other sources. It separates analysis workload from transaction workload and enables a business to consolidate data from several sources. In addition to a relational database, a data warehouse environment often consists of an ETL solution, an OLAP engine, client analysis tools, and other applications that manage the process of gathering data and delivering it to business users
  • 43.