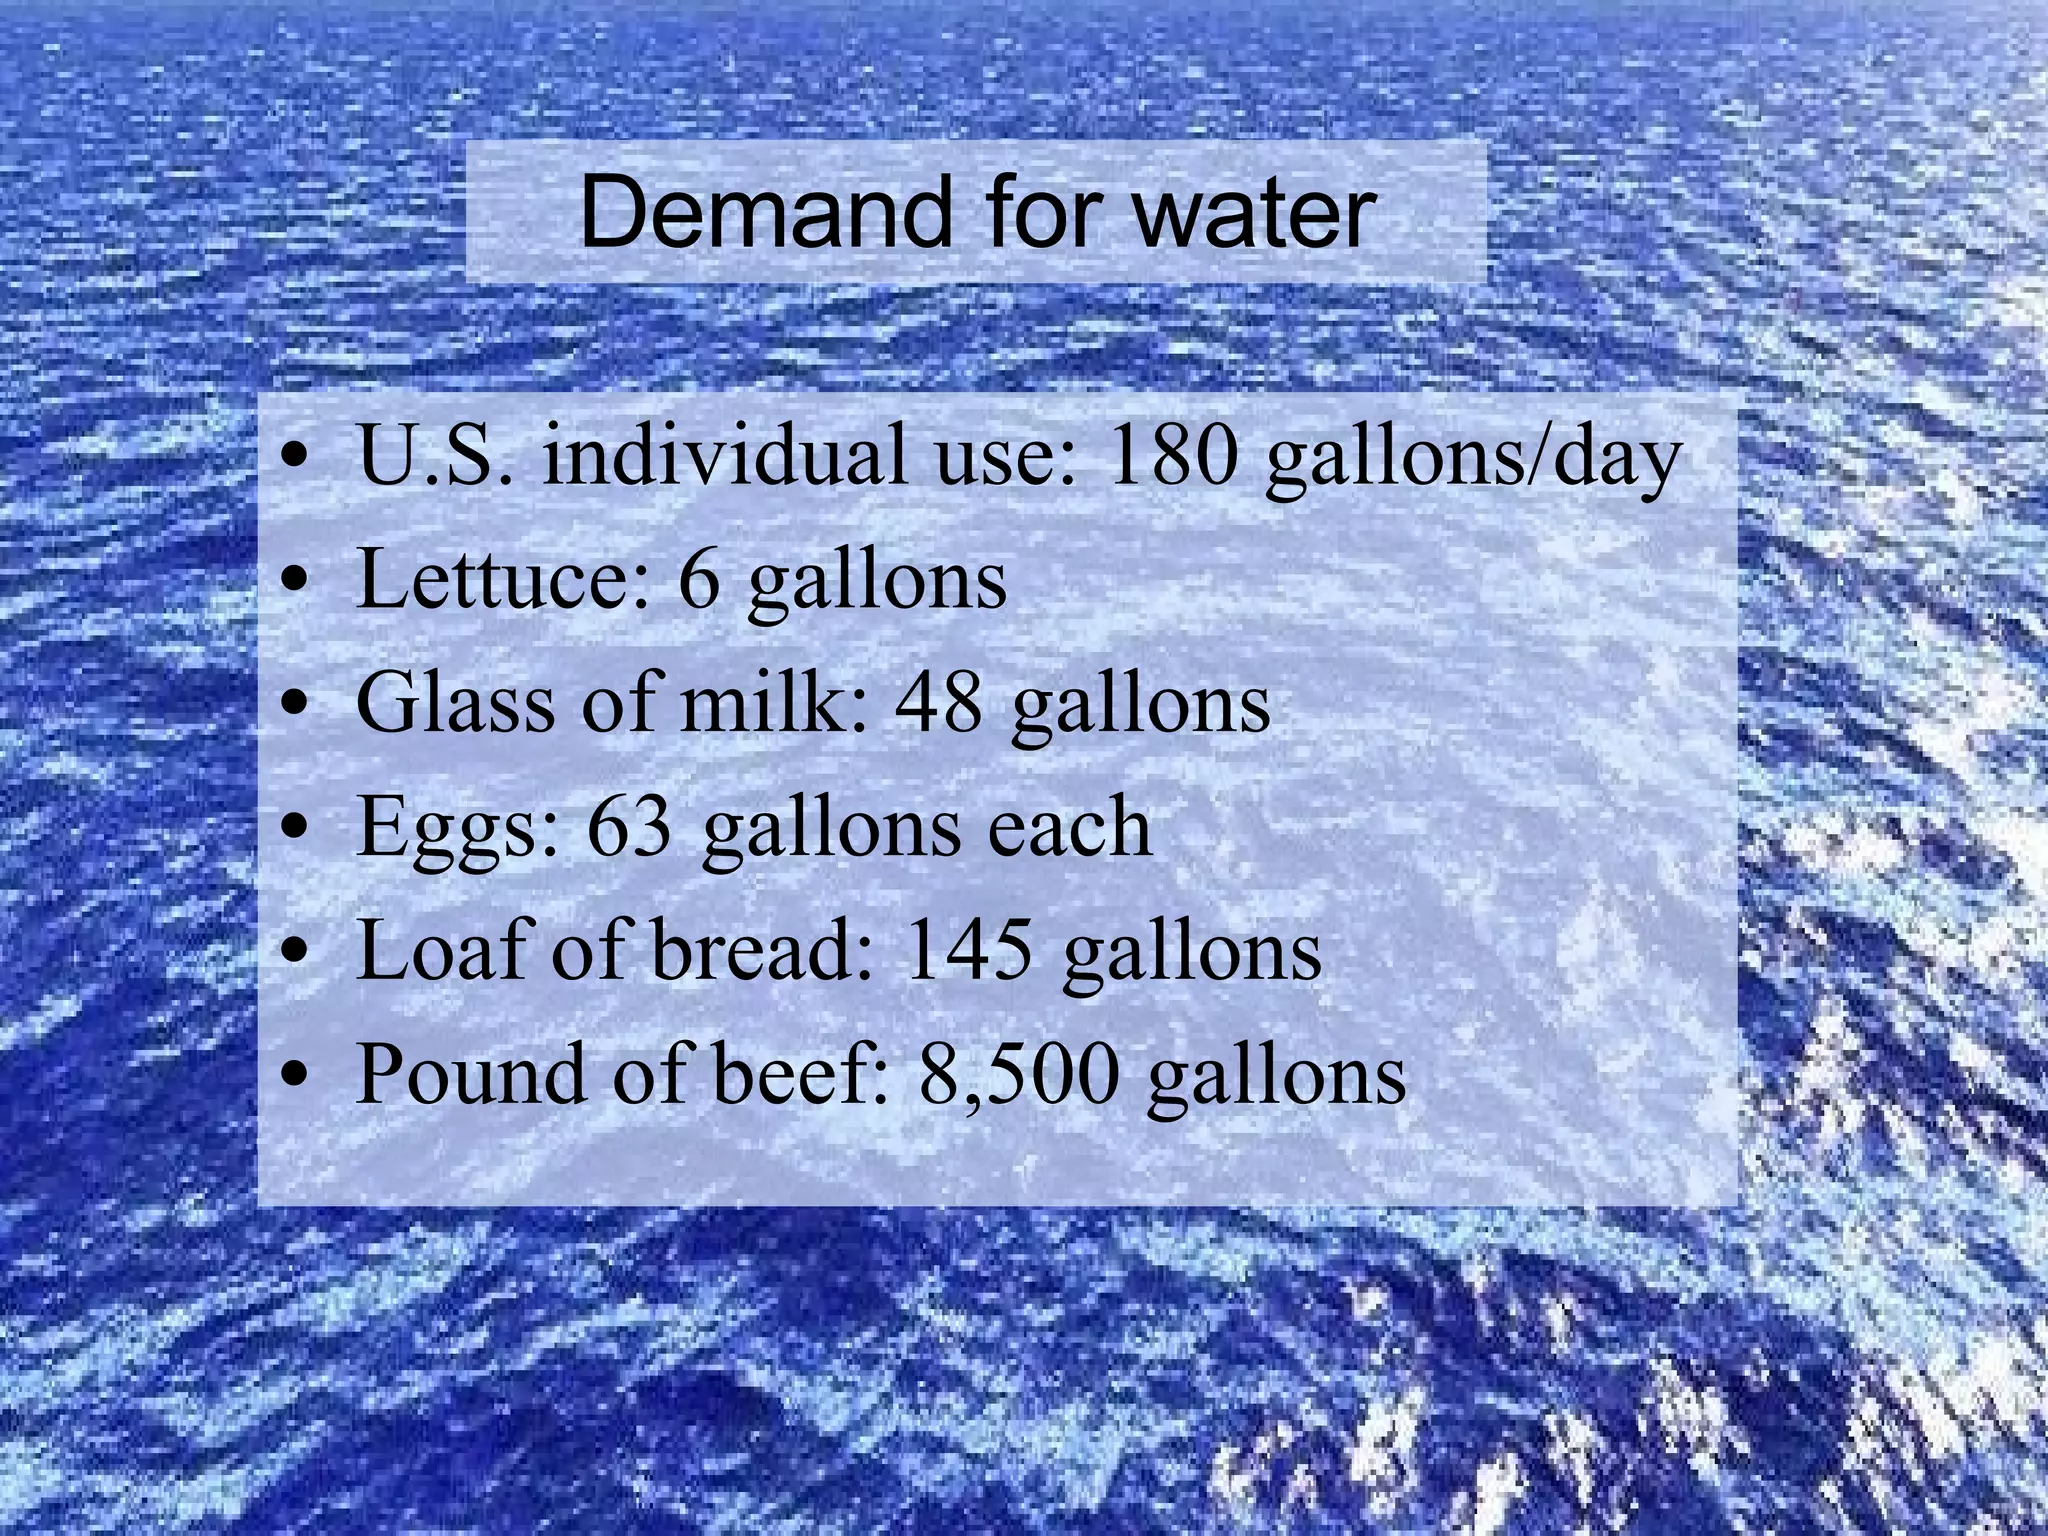
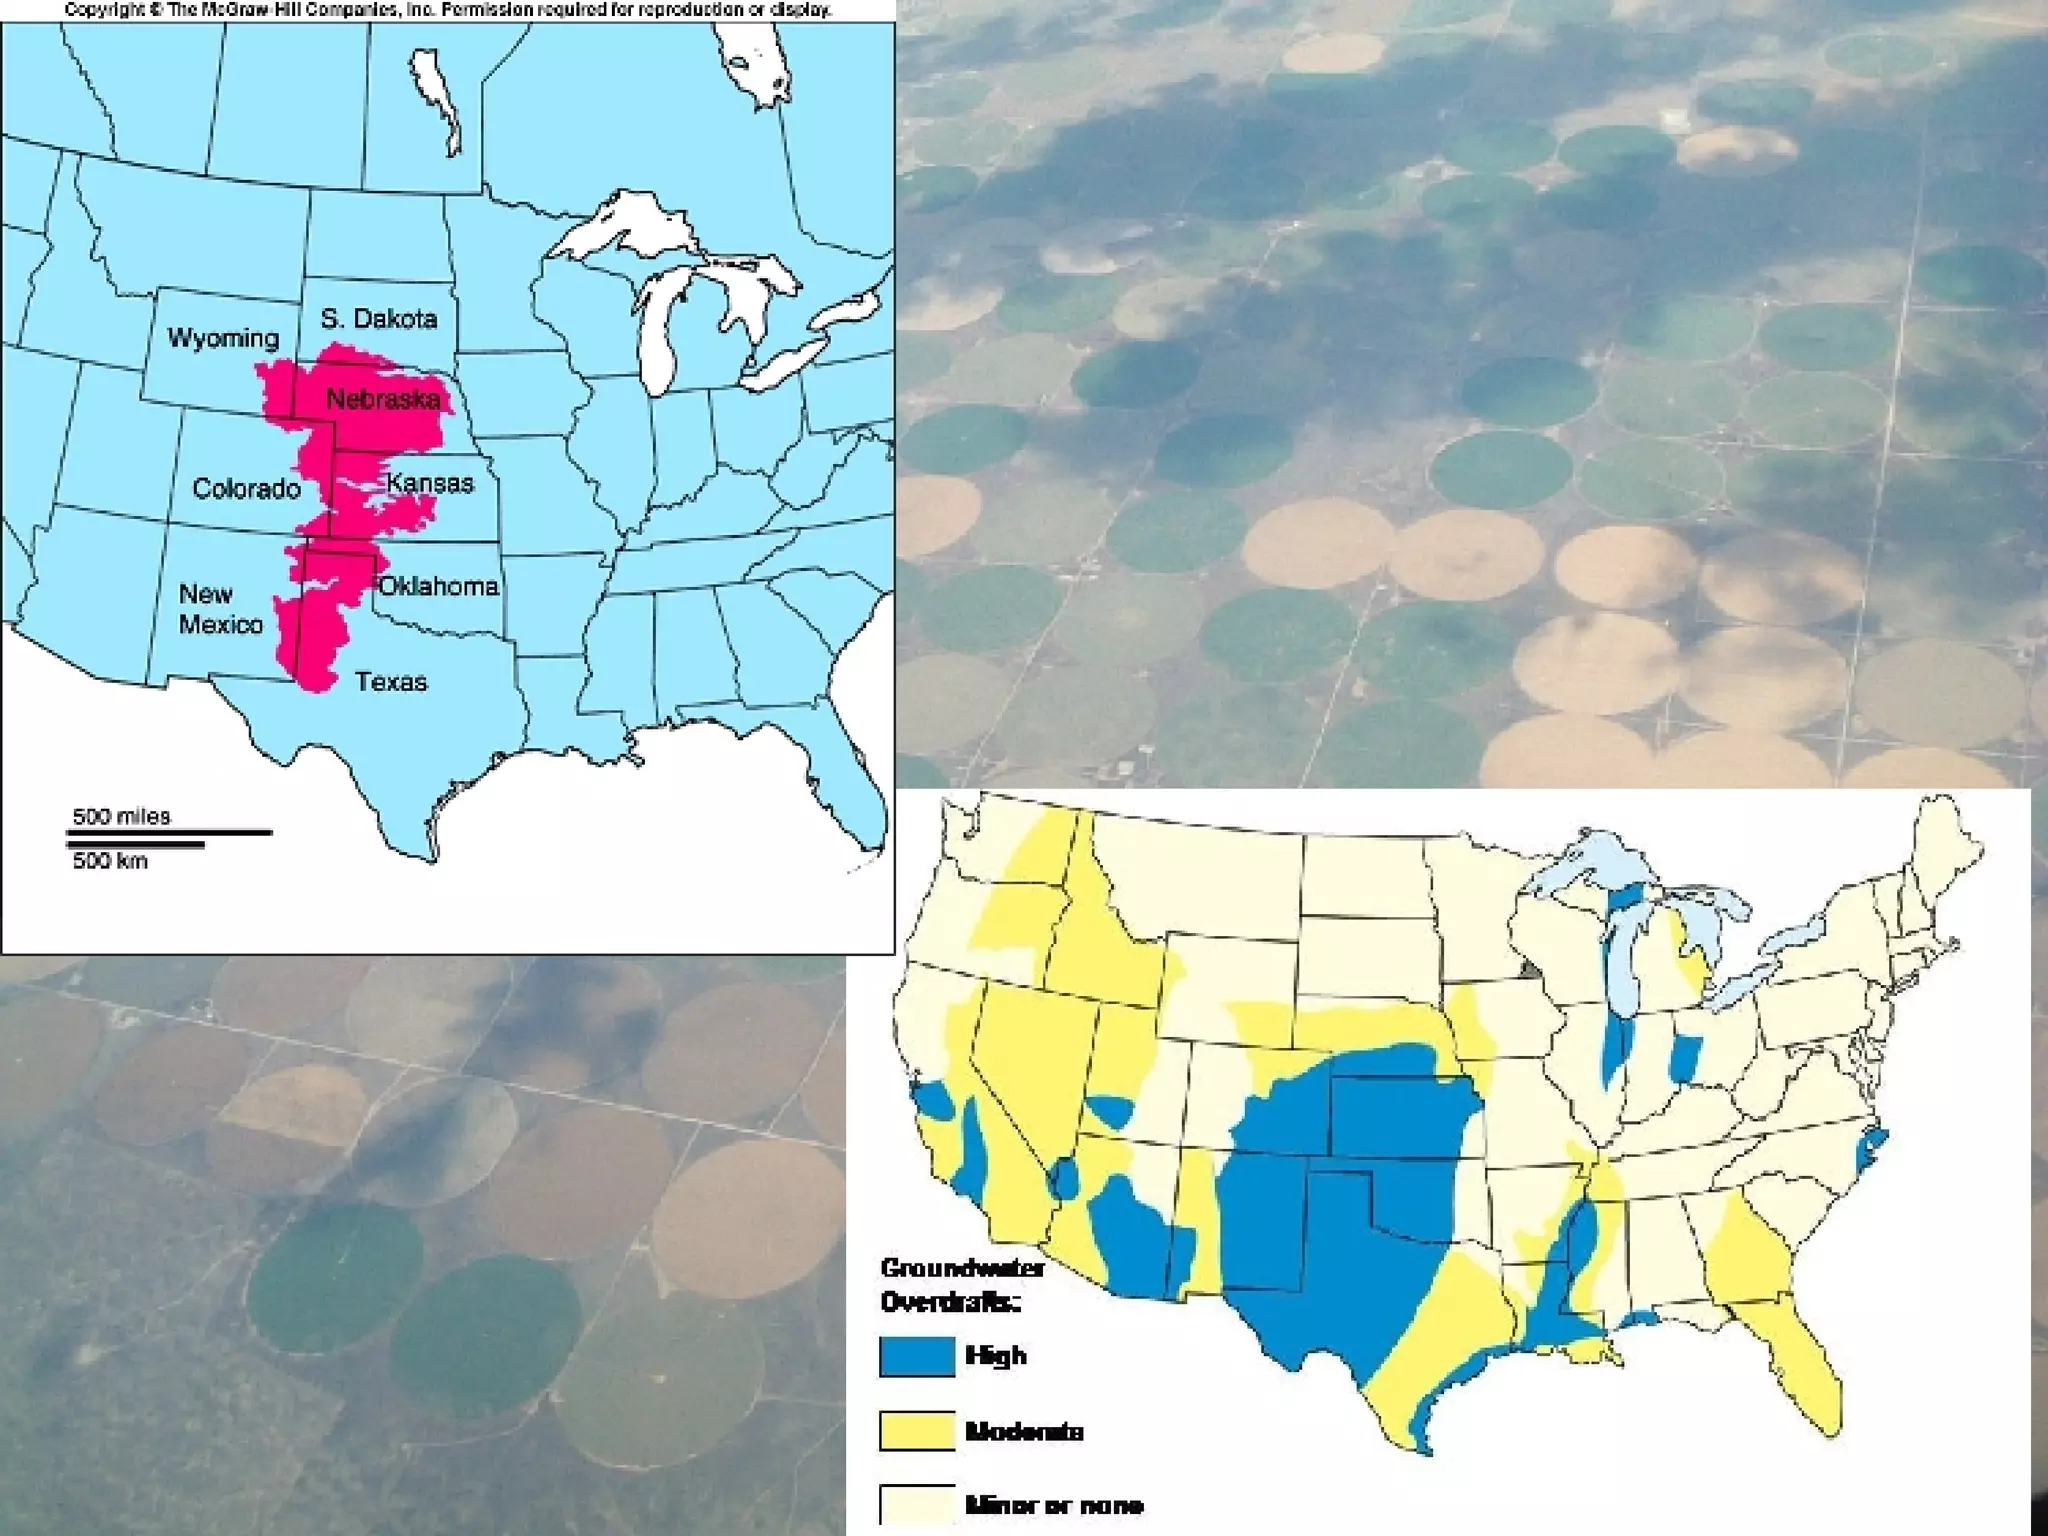
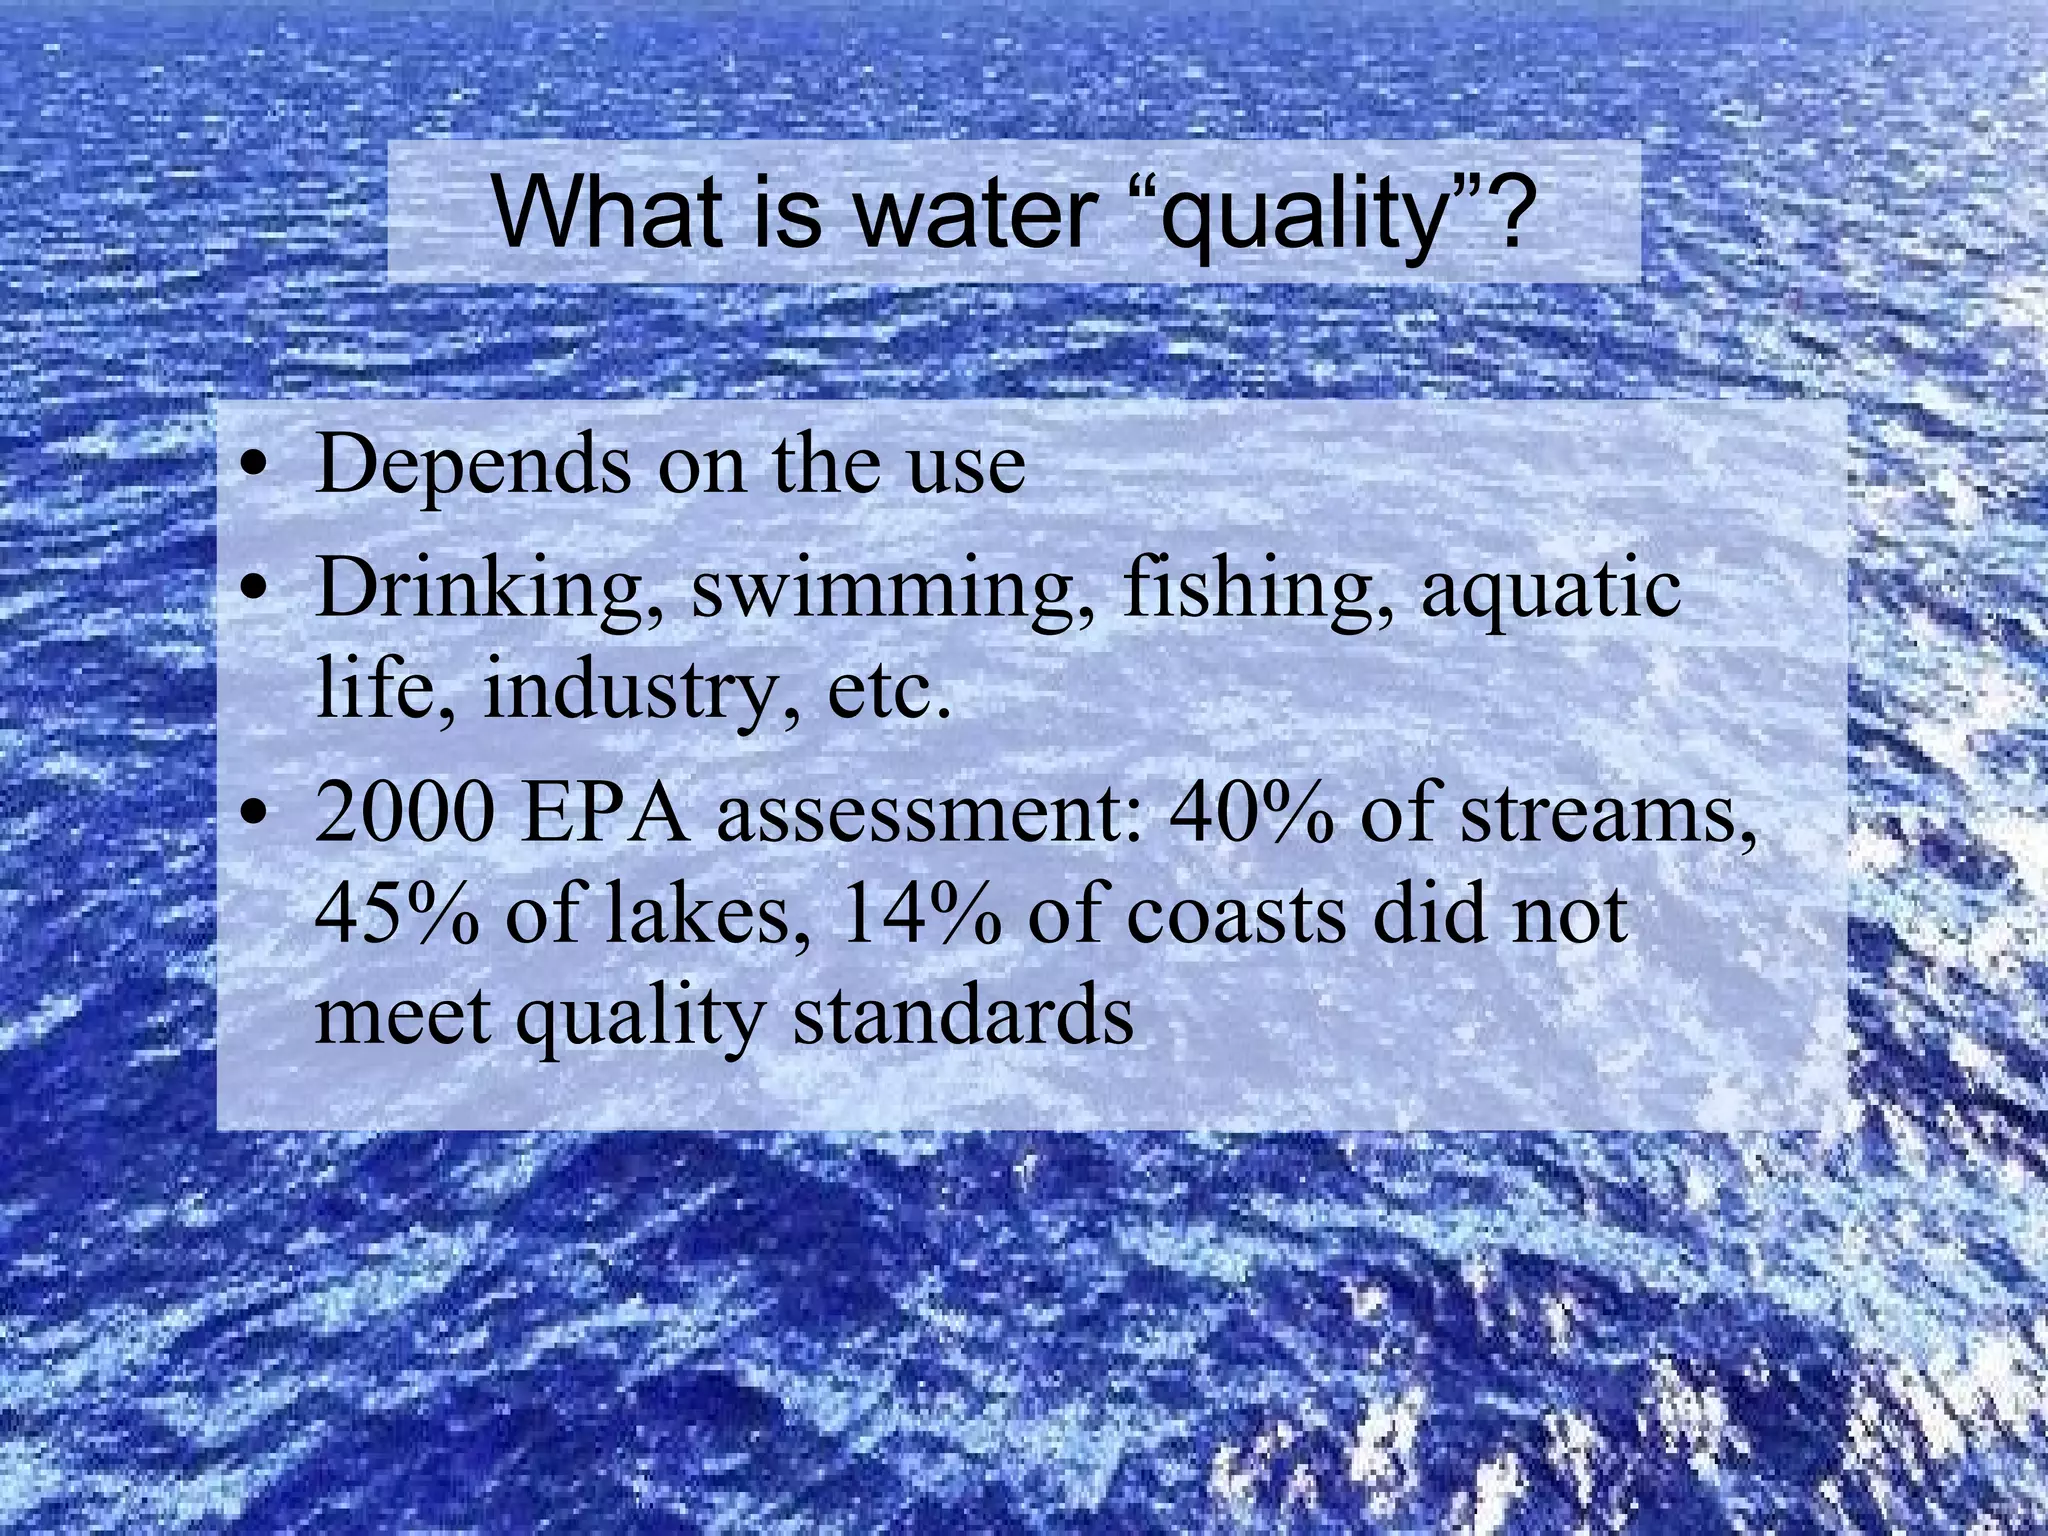
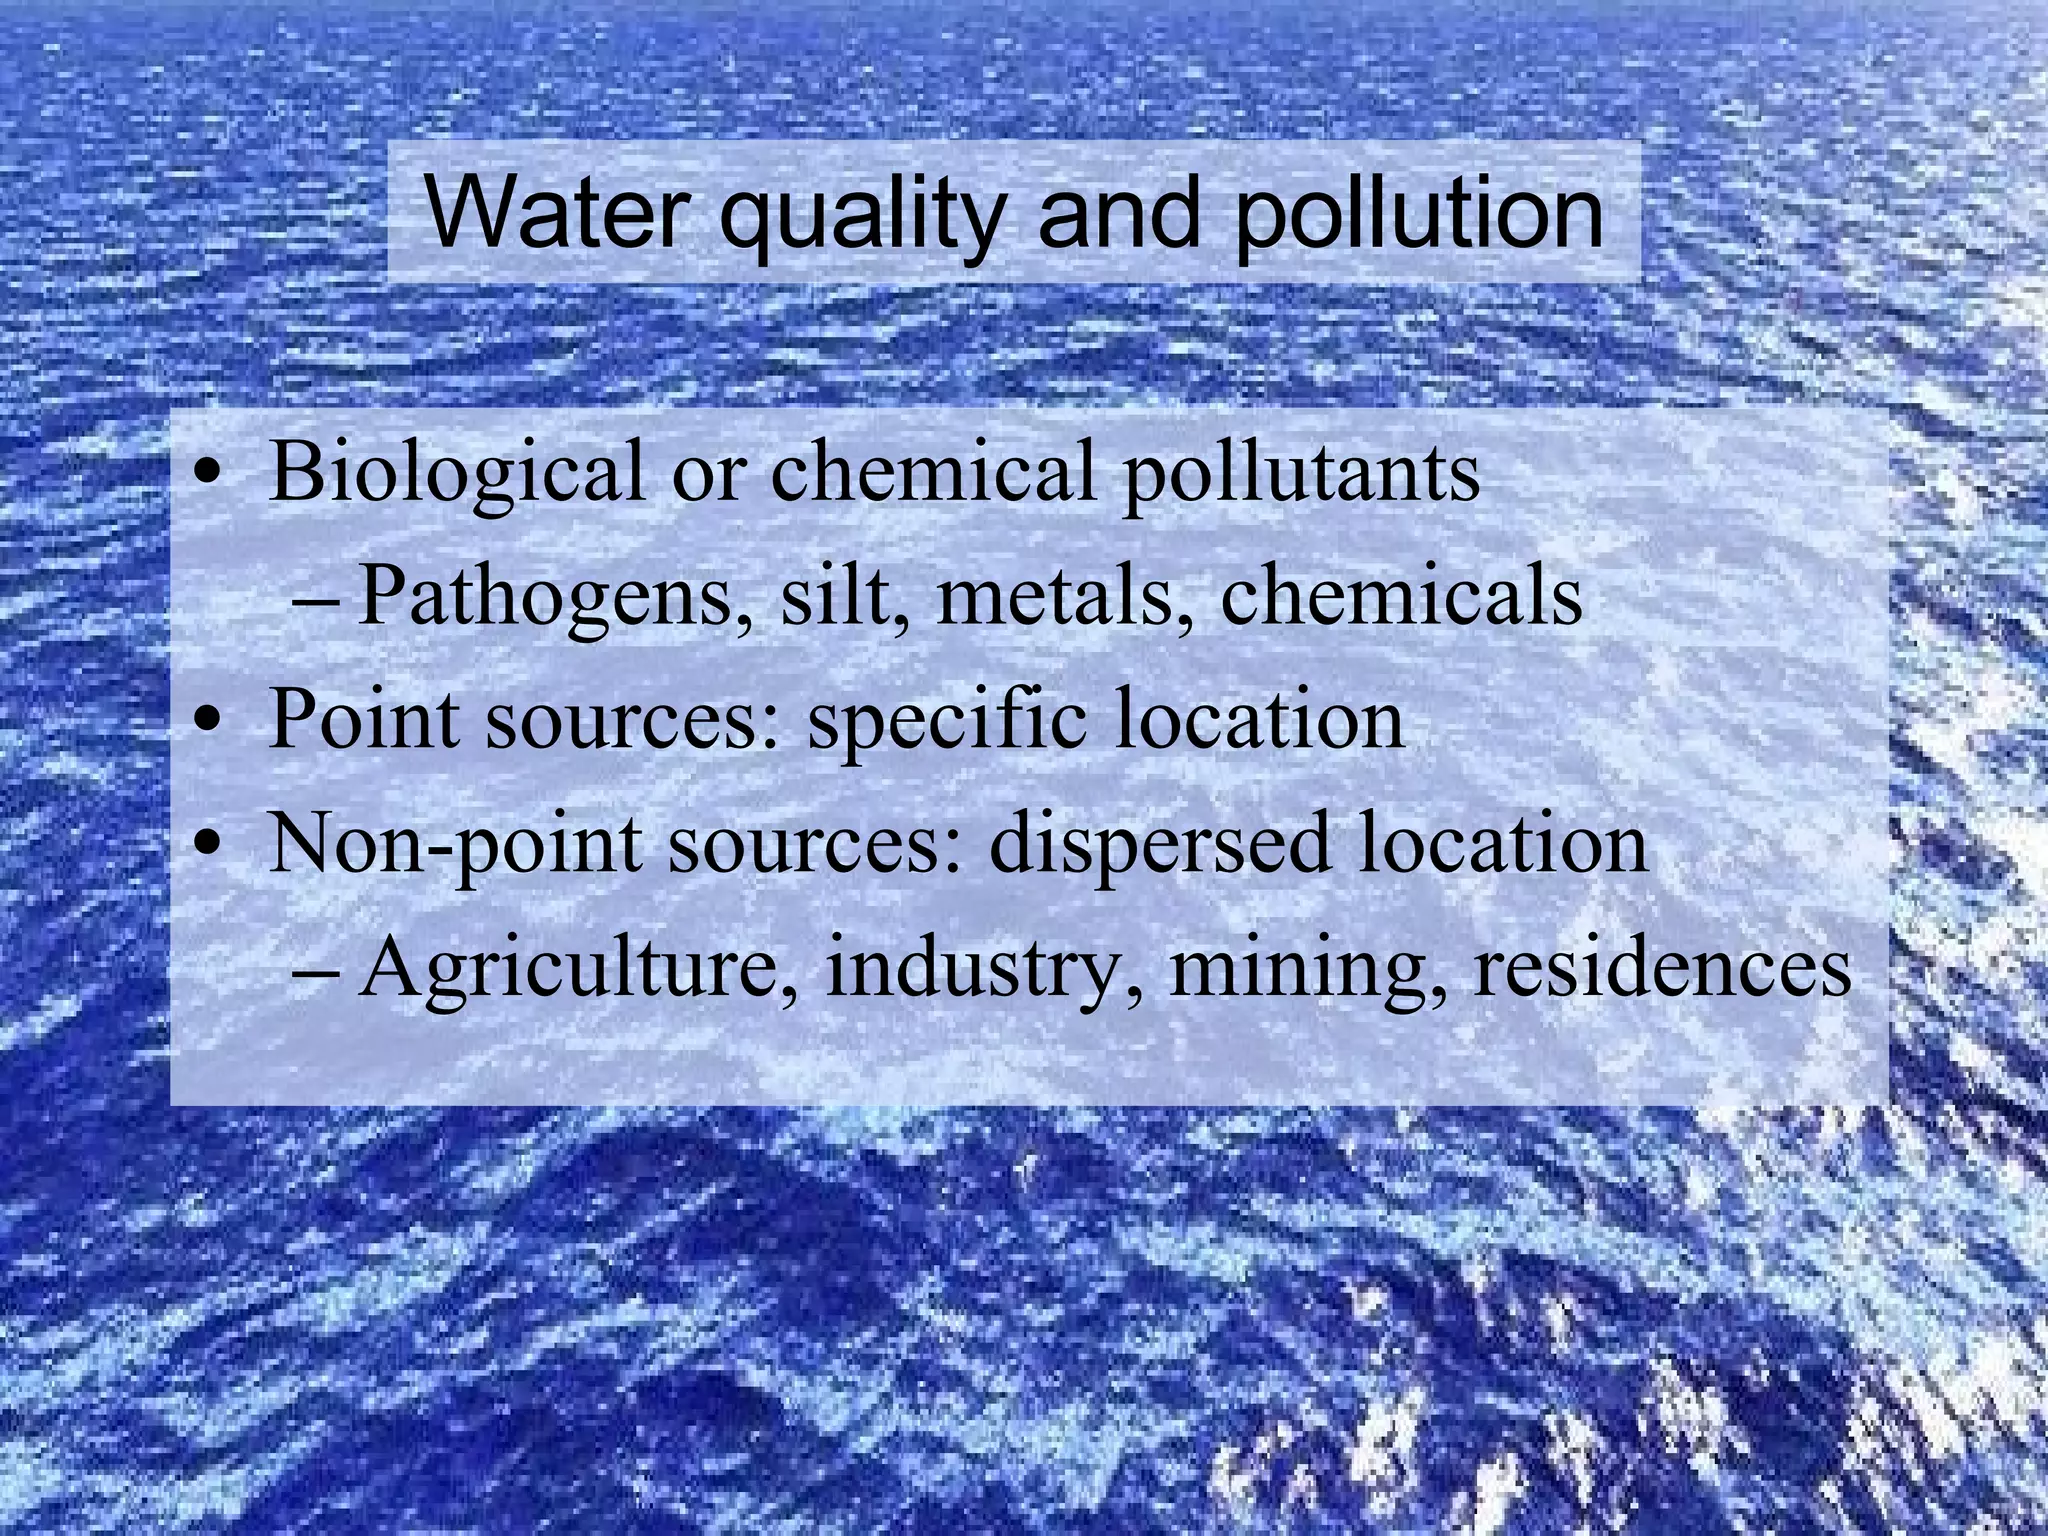
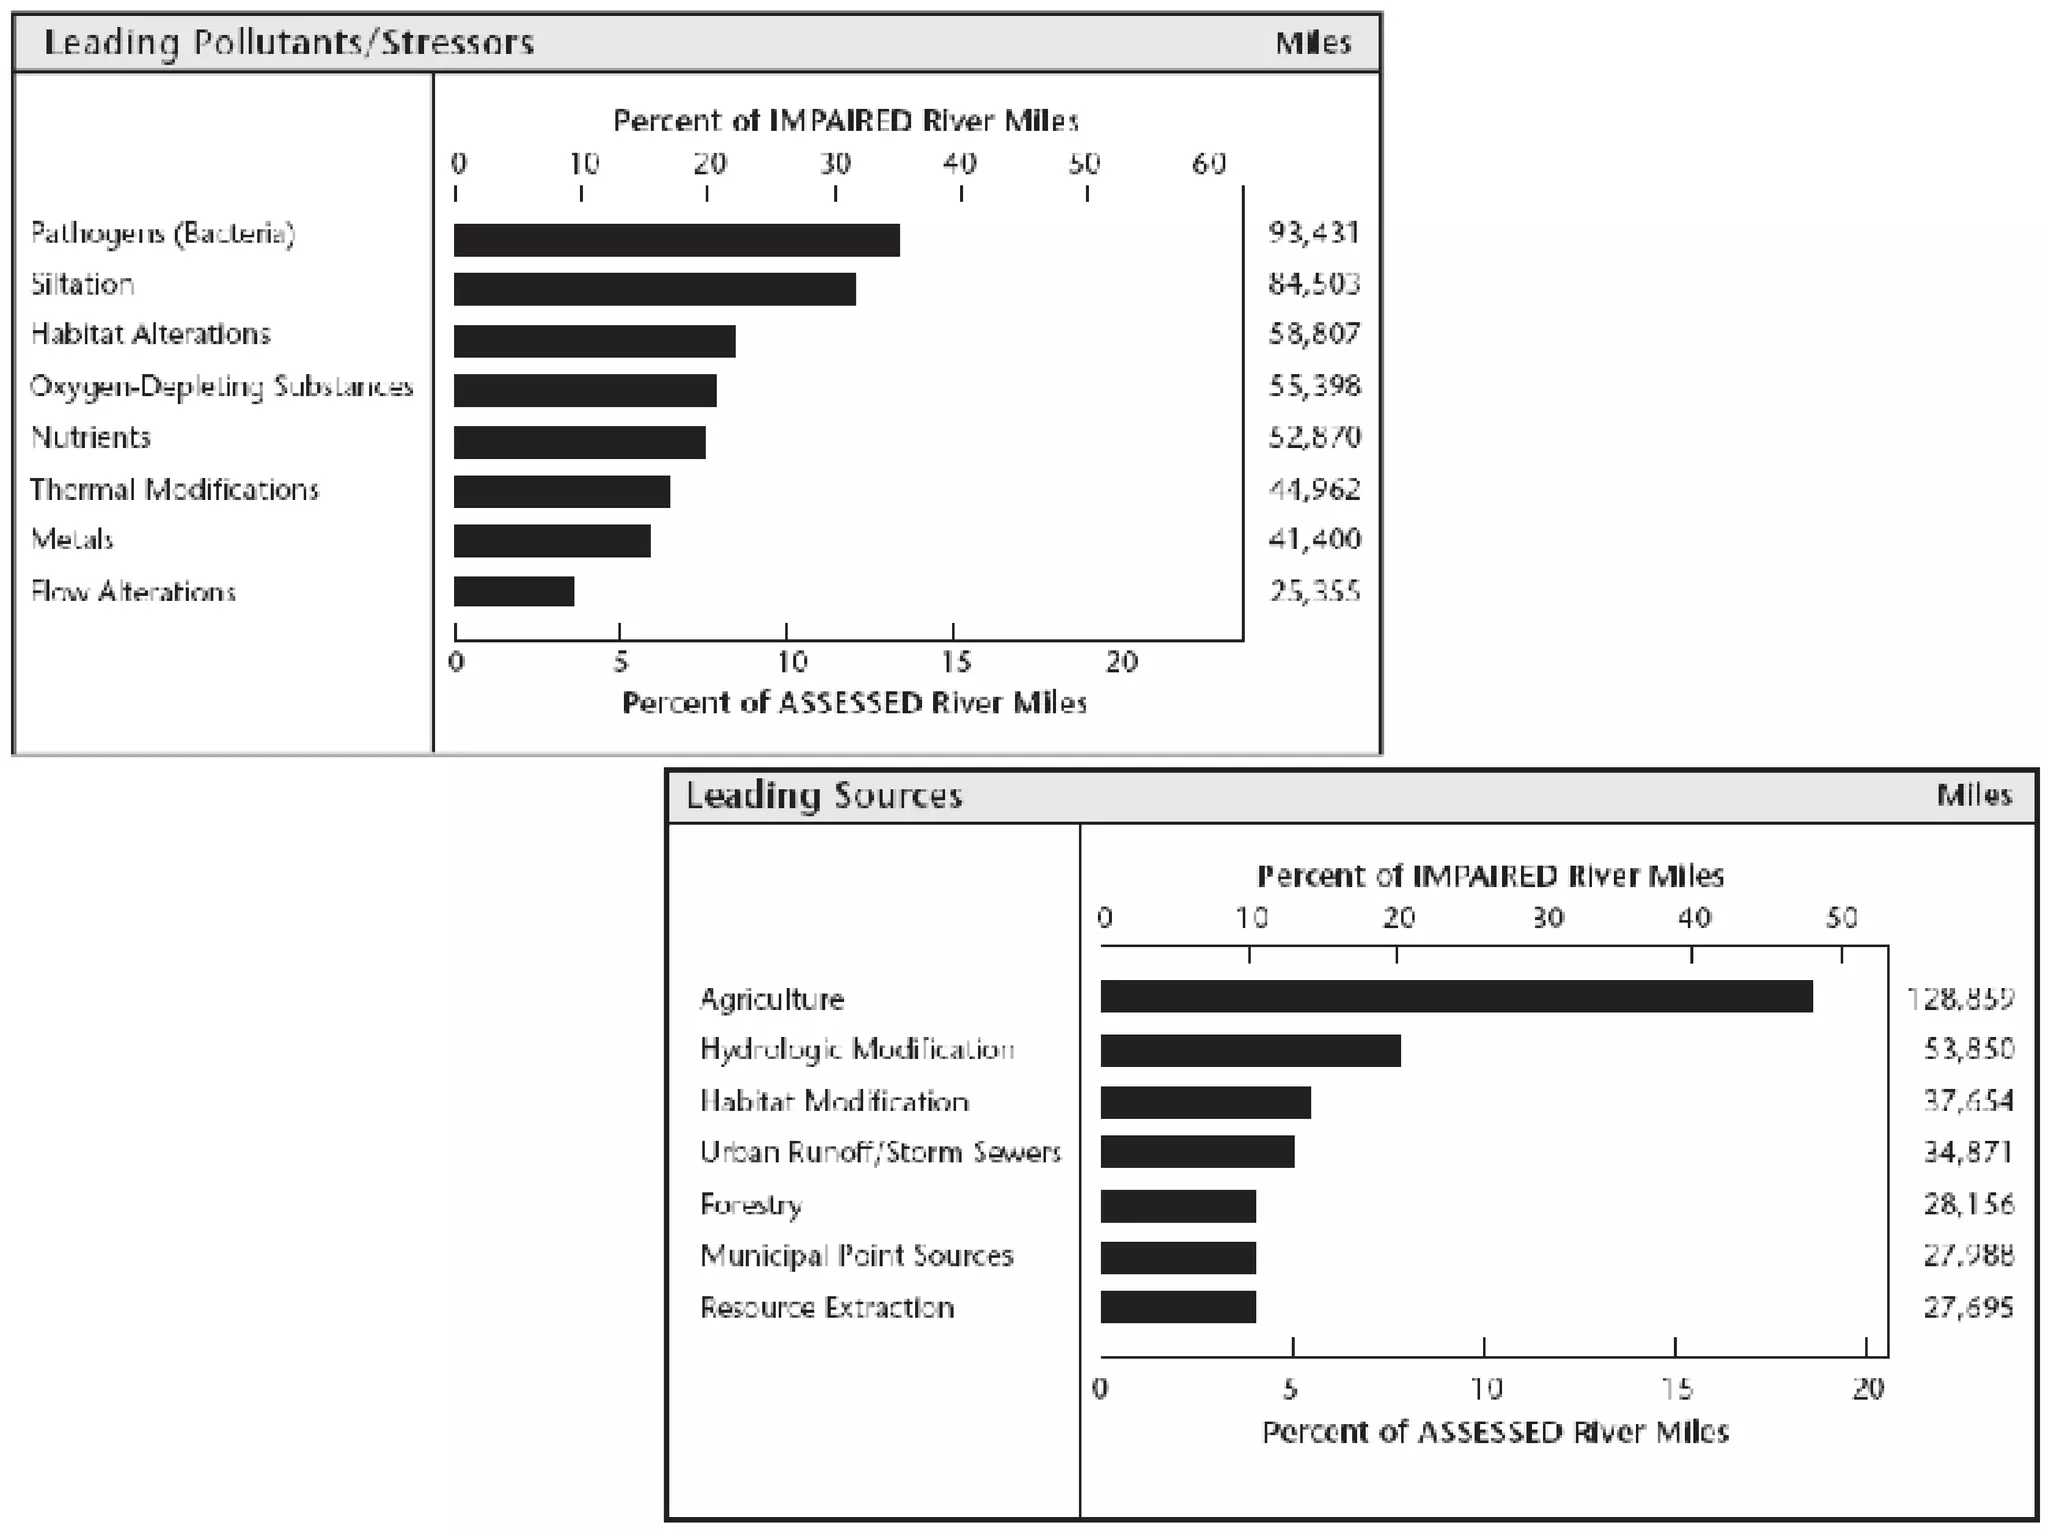
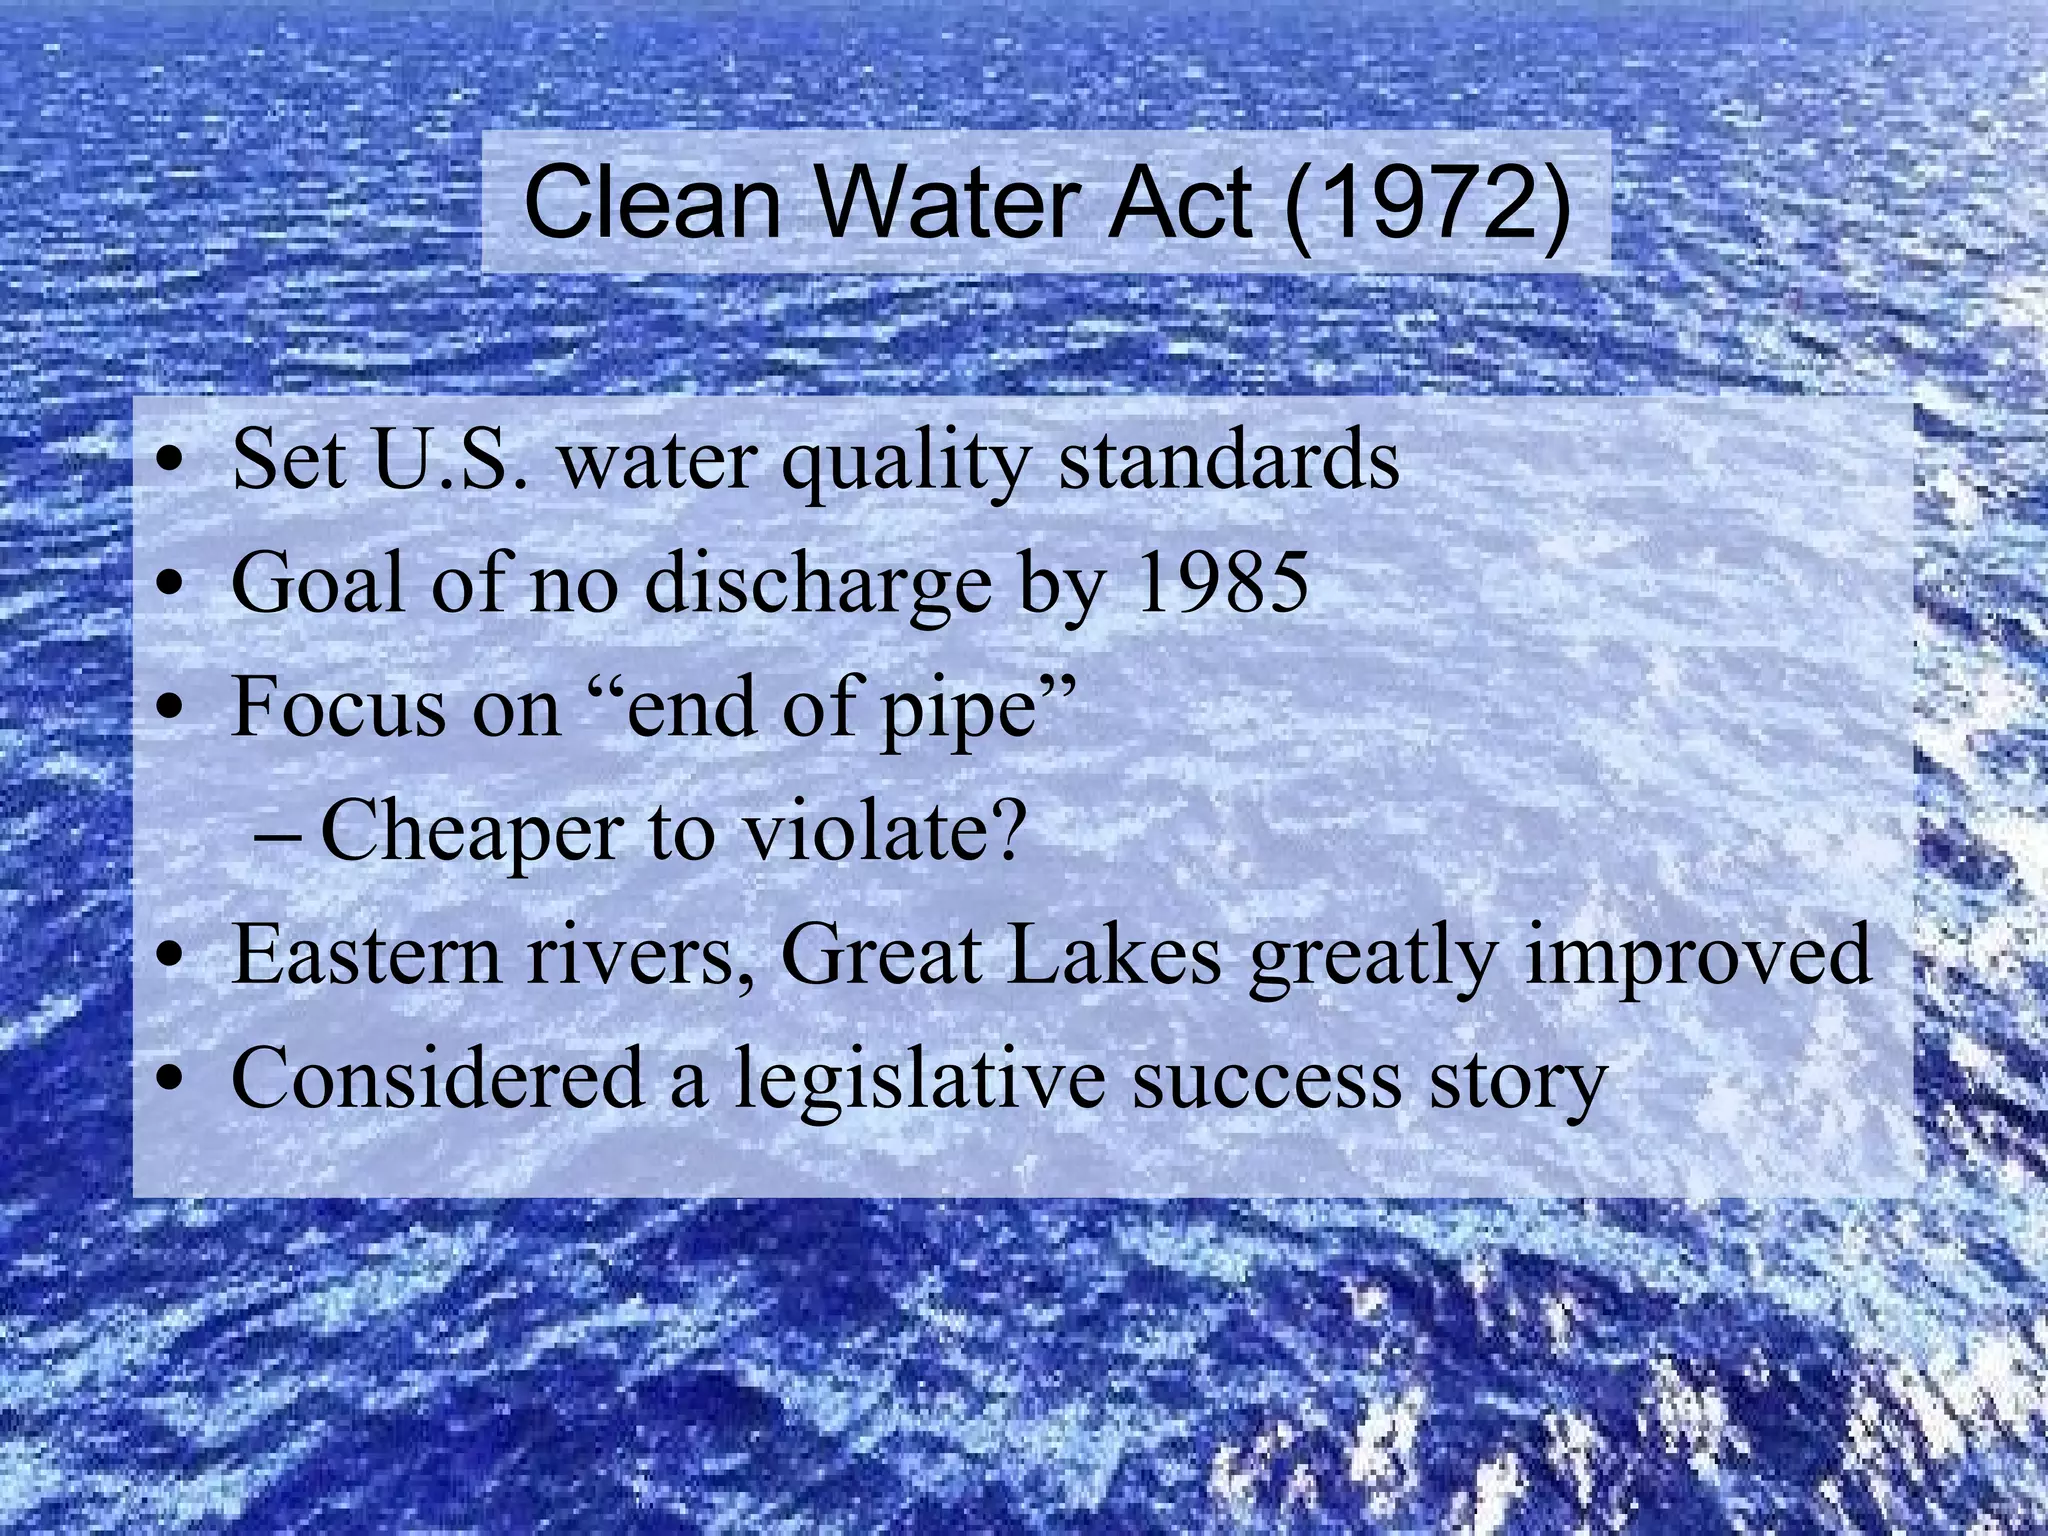
Class 15a: Water resources Water supply and demand Modification of waterways Water quality and pollution
Availability of water Only 3% of Earth’s water is fresh Only 0.003% is available Surface water: streams, lakes, etc. Groundwater: found in aquifers
Demand for water Since 1950, per capita water use has tripled: why? 1 billion people lack safe water Depends on climate, population, level of development
 
Demand for water U.S. individual use: 180 gallons/day Lettuce: 6 gallons Glass of milk: 48 gallons Eggs: 63 gallons each Loaf of bread: 145 gallons Pound of beef: 8,500 gallons
Demand for water 85% SW U.S. 10% 49% 41% U.S. 8% 25% 70% World Household Industry/energy Agriculture
Politics of water Military tool since 2500 B.C. Jordan R., Tigris and Euphrates, Nile, etc.  “ Environmental security” Cooperation among riparian nations needed Water wars?
Aral Sea Was the world’s fourth largest lake; now 80% gone Central Asian desert climate Irrigation on Amu Darya, Syr Darya Cotton, rice Commercial, not subsistence, farming
 
Aral Sea Increased salinization Fishing industry gone Salts and dust from dry lakebed Rivers slow, contaminated Climate even more continental “ Ten times worse than Chernobyl”
Ogallala Aquifer Equivalent to a Great Lake; 25-100 years left Cattle, wheat, corn, cotton (1/5 of U.S. cropland) Drinking water for 2 million “ Groundwater mining” Potentially renewable resource Used up to 22 times faster than replaced
 
Solutions? More groundwater (not long-term) Diverting rivers (Columbia?  Ob?) Towing icebergs (expensive) Desalination (expensive, energy-intensive)
Solutions? Conservation! Est. 65-70% of water is lost (50% in U.S.) True pricing Less federally subsidized water in West More metering (Sacramento) More efficient irrigation Reclaiming and recycling
 
Modification of streams Your responsibility! Channelization What and where Downstream, upstream consequences Effects of cities, deforestation
What is water “quality”? Depends on the use Drinking, swimming, fishing, aquatic life, industry, etc. 2000 EPA assessment: 40% of streams, 45% of lakes, 14% of coasts did not meet quality standards
 
Water quality and pollution Biological or chemical pollutants Pathogens, silt, metals, chemicals Point sources: specific location Non-point sources: dispersed location Agriculture, industry, mining, residences
 
Agricultural runoff 1/2 to 2/3 of stream pollution in U.S. Excess fertilizer Eutrophication Algae blooms, “dead zone” Herbicides, pesticides Animal wastes (factory farms)


Industrial/mining runoff Metals, arsenic from gold mining PCBs from industry Mercury from industry, mining Concentration in Arctic Cultural, health implications
Clean Water Act (1972) Set U.S. water quality standards Goal of no discharge by 1985 Focus on “end of pipe” Cheaper to violate? Eastern rivers, Great Lakes greatly improved Considered a legislative success story

Class15a

  • 1.
    Class 15a: Waterresources Water supply and demand Modification of waterways Water quality and pollution
  • 2.
    Availability of waterOnly 3% of Earth’s water is fresh Only 0.003% is available Surface water: streams, lakes, etc. Groundwater: found in aquifers
  • 3.
    Demand for waterSince 1950, per capita water use has tripled: why? 1 billion people lack safe water Depends on climate, population, level of development
  • 4.
  • 5.
    Demand for waterU.S. individual use: 180 gallons/day Lettuce: 6 gallons Glass of milk: 48 gallons Eggs: 63 gallons each Loaf of bread: 145 gallons Pound of beef: 8,500 gallons
  • 6.
    Demand for water85% SW U.S. 10% 49% 41% U.S. 8% 25% 70% World Household Industry/energy Agriculture
  • 7.
    Politics of waterMilitary tool since 2500 B.C. Jordan R., Tigris and Euphrates, Nile, etc. “ Environmental security” Cooperation among riparian nations needed Water wars?
  • 8.
    Aral Sea Wasthe world’s fourth largest lake; now 80% gone Central Asian desert climate Irrigation on Amu Darya, Syr Darya Cotton, rice Commercial, not subsistence, farming
  • 9.
  • 10.
    Aral Sea Increasedsalinization Fishing industry gone Salts and dust from dry lakebed Rivers slow, contaminated Climate even more continental “ Ten times worse than Chernobyl”
  • 11.
    Ogallala Aquifer Equivalentto a Great Lake; 25-100 years left Cattle, wheat, corn, cotton (1/5 of U.S. cropland) Drinking water for 2 million “ Groundwater mining” Potentially renewable resource Used up to 22 times faster than replaced
  • 12.
  • 13.
    Solutions? More groundwater(not long-term) Diverting rivers (Columbia? Ob?) Towing icebergs (expensive) Desalination (expensive, energy-intensive)
  • 14.
    Solutions? Conservation! Est.65-70% of water is lost (50% in U.S.) True pricing Less federally subsidized water in West More metering (Sacramento) More efficient irrigation Reclaiming and recycling
  • 15.
  • 16.
    Modification of streamsYour responsibility! Channelization What and where Downstream, upstream consequences Effects of cities, deforestation
  • 17.
    What is water“quality”? Depends on the use Drinking, swimming, fishing, aquatic life, industry, etc. 2000 EPA assessment: 40% of streams, 45% of lakes, 14% of coasts did not meet quality standards
  • 18.
  • 19.
    Water quality andpollution Biological or chemical pollutants Pathogens, silt, metals, chemicals Point sources: specific location Non-point sources: dispersed location Agriculture, industry, mining, residences
  • 20.
  • 21.
    Agricultural runoff 1/2to 2/3 of stream pollution in U.S. Excess fertilizer Eutrophication Algae blooms, “dead zone” Herbicides, pesticides Animal wastes (factory farms)
  • 22.
  • 23.
  • 24.
  • 25.
  • 26.
    Industrial/mining runoff Metals,arsenic from gold mining PCBs from industry Mercury from industry, mining Concentration in Arctic Cultural, health implications
  • 27.
    Clean Water Act(1972) Set U.S. water quality standards Goal of no discharge by 1985 Focus on “end of pipe” Cheaper to violate? Eastern rivers, Great Lakes greatly improved Considered a legislative success story