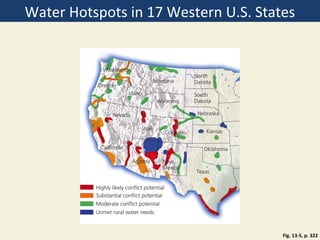
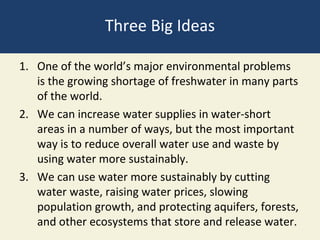
1) Freshwater scarcity is a major environmental problem as population grows and climate changes.
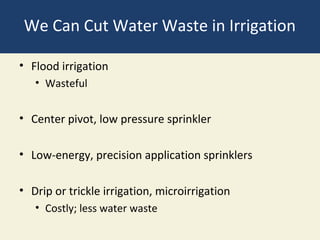
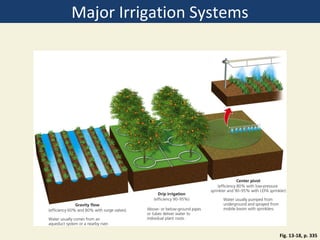
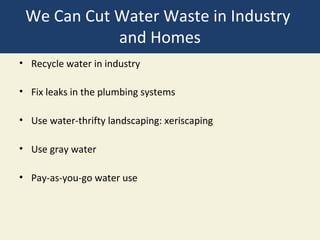
2) Water supplies can be increased by reducing overall use and waste through more sustainable practices like cutting irrigation inefficiencies, recycling water, and using pricing to reduce demand.
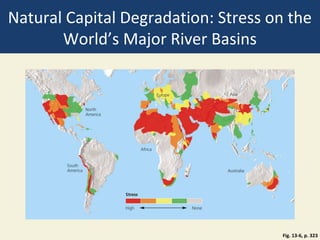
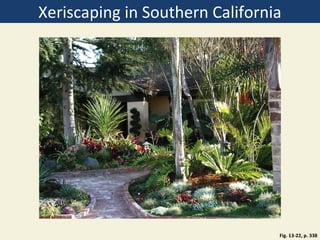
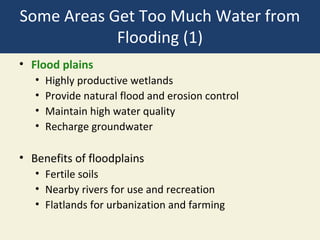
3) Specifically, conserving forests, wetlands, and aquifers that store and release water can help use limited supplies more sustainably along with other measures to cut residential and industrial water waste.


![Chapter 6 6_1_running_water_and_groundwater[1][1]](https://cdn.slidesharecdn.com/ss_thumbnails/chapter661runningwaterandgroundwater11-110706160352-phpapp01-thumbnail.jpg?width=640&height=640&fit=bounds)