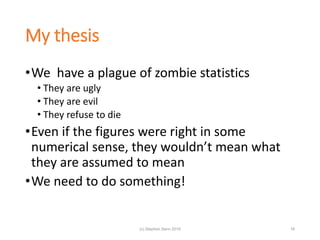
Stephen Senn
Edinburgh
stephen@senns.demon.co.uk
(c) Stephen Senn 2019 1
A statistical sceptic’s view of
personalised medicine
Acknowledgements
My thanks to Richard Grieve for the invitation
This work was partly supported by the European Union’s 7th
Framework Programme for research, technological
development and demonstration under grant agreement no.
602552. “IDeAL”
2(c) Stephen Senn 2019
A former captain of industry speaks
It will soon be possible for patients in clinical trials to undergo genetic tests
to identify those individuals who will respond favourably to the drug
candidate, based on their genotype…. This will translate into smaller, more
effective clinical trials with corresponding cost savings and ultimately better
treatment in general practice. … individual patients will be targeted with
specific treatment and personalised dosing regimens to maximise efficacy
and minimise pharmacokinetic problems and other side-effects.
Sir Richard Sykes, FRS, 1997
My emphasis
3(c) Stephen Senn 2019
A leading researcher speaks
Not only will genetic tests predict responsiveness to drugs on the
market today, but also genetic approaches to disease prevention and
treatment will include an expanding array of gene products for use in
developing tomorrow's drug therapies.
Francis S Collins, NEJM, 1999
(c) Stephen Senn 2019 4
5
Anybody familiar with the notion of “number needed to
treat” (NNT) knows that it's usually necessary to treat
many patients in order for one to benefit. NNTs under
5 are unusual, whereas NNTs over 20 are common.
Richard Smith, BMJ, 13 December 2003
(Richard Smith was the editor of the BMJ for many
years and remains a very interesting commentator of
medicine and health.)
The editor of a leading journal speaks
(c) Stephen Senn 2019
Significance gets in on the act
June 2006
(c) Stephen Senn 2019 6
A previous Prime Minister of the UK
speaks
This agreement will see the UK lead the world in
genetic research within years. I am determined
to do all I can to support the health and scientific
sector to unlock the power of DNA, turning an
important scientific breakthrough into something
that will help deliver better tests, better drugs
and above all better care for patients....
David Cameron, August 2014 (my emphasis)
7(c) Stephen Senn 2019
8
The world’s leading regulatory agency
speaks
(c) Stephen Senn 2019
9
59% had no or at worst mild
headache after 2 hours when
treated with paracetamol
49% had no or at worst mild
headache after 2 hours when
treated with placebo
59%-49% = 10%
Therefore 10% benefitted
The number needed to treat
(NNT) for one extra patient to
have a benefit is 10
Based on a review of 23 studies
and 6000 patients
The leading evidence based medicine
organisation speaks
(c) Stephen Senn 2019
The financial press gets in on the act
Olivia Rossanese, Institute of
Cancer Research, December 2018
(c) Stephen Senn 2019 10
(c) Stephen Senn 2019 11
(c) Stephen Senn 2019 12
Warning
We tend to believe the truth is in
there.
Sometimes it isn’t and the danger is that
we will find it anyway
(c) Stephen Senn 2019 13
Statistics on non-responders
What the FDA says Where the FDA got it
Paving the way for personalized
medicine, FDA Oct 2013
Spear, Heath-Chiozzi & Huff, Trends in
Molecular Medicine, May 2001
14(c) Stephen Senn 2019
Back to the source of the source
Where the FDA got it Where those who got it got it
Spear, Heath-Chiozzi & Huff, Trends in
Molecular Medicine, May 2001
15(c) Stephen Senn 2019
My thesis
•We have a plague of zombie statistics
• They are ugly
• They are evil
• They refuse to die
•Even if the figures were right in some
numerical sense, they wouldn’t mean what
they are assumed to mean
•We need to do something!
16(c) Stephen Senn 2019
Back to the headache
A Recipe to Mimic the Cochrane Results
•Generate one random number, Ui, for each of 6000
headaches, i = 1,2…6000
•Calculate pairs of headache
•Yi1 =-log(Ui)2.97 (placebo headache duration)
•Yi2 =-log(Ui)2.24 (paracetamol headache duration)
•Now randomly erase one member of each pair
•Because each headache can only receive one
treatment
•The other is counterfactual
•Draw the empirical cumulative distribution
17(c) Stephen Senn 2019
18(c) Stephen Senn 2019
Why this recipe?
• The exponential distribution with
mean 2.97 is chosen so that the
probability of response in under two
hours is 0.49
• This is the placebo distribution
• The exponential distribution with
mean 2.24 is chosen so that the
probability of response in under two
hours of 0.59
• This is the paracetamol
distribution
• This is what you would see if every
headache were reduced to the same
degree (about ¼)
• It is also mimics exactly the Cochrane
result
19(c) Stephen Senn 2019
Lessons
Particular
• The NNT of 10 is perfectly
compatible with paracetamol
having exactly the same
proportionate effect on every
headache
• Nothing in the data we are
given says anything whatsoever
about differential response
In general
• An NNT cannot tell you what
proportion of patients
responded
• To think so is a straightforward
conceptual mistake
• Claims regarding the proportion
who respond based on NNTs are
misleading
20(c) Stephen Senn 2019
Personalised medicine
(c) Stephen Senn 2019 21
A field that has proved highly
productive in producing
publications and grant funding.
(c) Stephen Senn 2019 22
Ulcer treatment in the last quarter of the 20th
century
• A great success story
• Four to five major innovations/discovery
• H2 antagonists
• Proton pump inhibitors
• The role of H Pylori
• C13 Urea breath test
• Antibiotics developed to treat H Pylori
• Together these transformed the treatment of ulcer treatment
• General surgery largely wiped out
• For the many not just the few
• Admittedly the combination of the C13 test and antibiotic treatment involves
a degree of personalisation
• But now look at how the personalised medicine bandwagon
misrepresents it
(c) Stephen Senn 2019 23
Wasteful medicine?
“Every day, millions of
people are taking
medications that will not
help them. The top ten
highest-grossing drugs in
the United States help
between 1 in 25 and 1 in 4
of the people who take
them. “
Schork, N, Nature 2015
24(c) Stephen Senn 2019
•This is for Nexium (Esomeprazole) compared to other
proton pump inhibitors
•This is a highly successful class of treatment
•‘Response’ is 92% in one case and 88% in the other at
8 weeks (Labenz et al, 2005)
•Response rises over time and would probably increase
beyond 8 weeks
•The claim that only 1 in 25 benefit is nonsense
25
Nexium
revisited
(c) Stephen Senn 2019
Two extreme cases
Illustrated with the EXPO study
26
Esomeprazole
Not healed Healed Total
Pantoprazole Not healed 7.9 4.8 12.7
Healed 0.0 87.3 87.3
Total 7.9 92.1 100.0
Esomeprazole
Not healed Healed Total
Pantoprazole Not healed 0.0 12.7 12.7
Healed 7.9 79.4 87.3
Total 7.9 92.1 100.0
Case where no patient would respond on Pantoprazole who
did not on Esomeprazole (Nexium)
Case where all patients who did not respond on Esomeprazole
(Nexium) would respond on Pantoprazole
(c) Stephen Senn 2019
We have moved from finding
highly effective treatments for
most patients to trying to find
expensive ones for almost
nobody at all
(c) Stephen Senn 2019 27
How responder analysis misleads us:
Six depressingly common sins
• Poor choice of counterfactual
• Baseline does not necessarily predict what would happen in the absence of
treatment
• Bad measures
• Percent change from baseline is known to be a highly variable and badly behaved
measure
• Arbitrary dichotomy
• There is nothing magic about the standards we use and dichotomising loses
information
• Linguistic confusion
• Responder does not mean ‘was caused to improve’ it means ‘was observed to
improve’
• Causal naivety
• Subsequence is not consequence
• Failure to replicate
• If you want to exclude within-patient variability as an explanation you have to
know how big it is. That involves measuring patients more than once
28(c) Stephen Senn 2019
29
Slide with the Obligatory Purloined Cartoon
Senn, Nature, 29 November 2018
(c) Stephen Senn 2019
15% increase in forced expiratory volume in
one second (FEV1)
Some regulatory magic
30
Some key efficacy PD responses were similar between xxx and yyy
following 180 μg single dose inhalation. The percentage of responders
(15% increase in FEV1 from baseline) was 63% and 52% for xxx and yyy,
respectively
From a cross-over trial submitted to the FDA as part of a review
This is cited just to show that the standard of 15% bronchodilation is
used
I shall now use an example of my own
(c) Stephen Senn 2019
So can we identify individual response with
cross-overs?
• Cross-over trial in asthma
• 71 patients
• Forced expiratory volume in one
second (FEV1) at 12 hours
• FDA definition of response is 
15% increase compered to
baseline
• There seem to be a number of
patients who respond to B and
not to A and vice versa
• Clearly if we can find predictive
characteristics of them we can
improve treatment
• Can’t we?
31(c) Stephen Senn 2019
Differential response?
Not so fast
• A is ISF 12g, formoterol
• B is ISF 24g formoterol
• It is biologically extremely
implausible that patients could
respond to 12g and not to
24g
• Yet apparently 8 out of 71
patients did
• What can the explanation be?
• Large within patient variability
• Conclusion: naïve simple views
of causality and response aren’t
good enough and more complex
design and analysis is needed
32(c) Stephen Senn 2019
The real lessons
• Other things being equal a high NNT is indicative of a poorer
treatment but it is not a valid shortcut to studying variation
• We need to understand and master the variation in the system
• We need to not naively over-interpret differentiation in observed
response
• Some of it may be genuine treatment-by-patient interaction
• Much of it may be within-patient variation
• In many (but not all) cases the task facing us will be to deliver better
average medicine
• In this connection there is one big problem we continually overlook
• The main source of variation in the system is not patients
• It’s doctors
33(c) Stephen Senn 2019
The central problem in management and leadership is failure to
understand the information in variation. Lloyd S Nelson
(quoted by WE Deming)
• As Deming, the guru of quality control taught us, it is the duty of
every manager to understand the variation in the system
• This is what is inspiring what Brent James is doing at Inter-
Mountain health
• At the moment we are making a bad job of this
• NNTs and responder analysis are no substitute for serious study of
components of variation
• There is no point publishing and developing yet more complicated
fancy stuff involving mixed models if we fall at the first hurdle
• Once you have sold the post by permitting naïve causal definitions
the battle is already lost
• We must do better in fighting the omic hype
• and I would include me but I am retired
34(c) Stephen Senn 2019
(c) Stephen Senn 3535(c) Stephen Senn 2019
The supply of truth always greatly
exceeds its demand
John F Moffitt
36(c) Stephen Senn 2019
Suggested further reading
37
Araujo, A., S. Julious and S. Senn (2016). "Understanding Variation in Sets of N-
of-1 Trials." PLOS ONE 11(12): e0167167.
Holland, P. W. (1986). "Statistics and Causal Inference." Journal of the American
Statistical Association 81(396): 945-960.
Robins, J. and S. Greenland (1989). "The probability of causation under a
stochastic model for individual risk." Biometrics 45(4): 1125-1138.
Rubin, D. B. (1974). "Estimating causal effects of treatments in randomized and
nonrandomized studies." Journal of educational Psychology 66(5): 688.
Senn, S. J. (2001). "Individual Therapy: New Dawn or False Dawn." Drug
Information Journal 35(4): 1479-1494.
Senn, S. J. (2004). "Individual response to treatment: is it a valid assumption?"
BMJ 329(7472): 966-968.
Senn, S. J. (2016). "Mastering variation: variance components and personalised
medicine." Statistics in Medicine 35(7): 966-977.
Senn SJ. (2018) Statistical pitfalls of personalized medicine. Nature.
2018;563(7733):619-621.
Snapinn, S. and Q. Jiang (2011). "On the clinical meaningfulness of a
treatment's effect on a time-to-event variable." Stat Med 30(19): 2341-2348.
(c) Stephen Senn 2019

Personalised medicine a sceptical view

  • 1.
    Stephen Senn Edinburgh stephen@senns.demon.co.uk (c) StephenSenn 2019 1 A statistical sceptic’s view of personalised medicine
  • 2.
    Acknowledgements My thanks toRichard Grieve for the invitation This work was partly supported by the European Union’s 7th Framework Programme for research, technological development and demonstration under grant agreement no. 602552. “IDeAL” 2(c) Stephen Senn 2019
  • 3.
    A former captainof industry speaks It will soon be possible for patients in clinical trials to undergo genetic tests to identify those individuals who will respond favourably to the drug candidate, based on their genotype…. This will translate into smaller, more effective clinical trials with corresponding cost savings and ultimately better treatment in general practice. … individual patients will be targeted with specific treatment and personalised dosing regimens to maximise efficacy and minimise pharmacokinetic problems and other side-effects. Sir Richard Sykes, FRS, 1997 My emphasis 3(c) Stephen Senn 2019
  • 4.
    A leading researcherspeaks Not only will genetic tests predict responsiveness to drugs on the market today, but also genetic approaches to disease prevention and treatment will include an expanding array of gene products for use in developing tomorrow's drug therapies. Francis S Collins, NEJM, 1999 (c) Stephen Senn 2019 4
  • 5.
    5 Anybody familiar withthe notion of “number needed to treat” (NNT) knows that it's usually necessary to treat many patients in order for one to benefit. NNTs under 5 are unusual, whereas NNTs over 20 are common. Richard Smith, BMJ, 13 December 2003 (Richard Smith was the editor of the BMJ for many years and remains a very interesting commentator of medicine and health.) The editor of a leading journal speaks (c) Stephen Senn 2019
  • 6.
    Significance gets inon the act June 2006 (c) Stephen Senn 2019 6
  • 7.
    A previous PrimeMinister of the UK speaks This agreement will see the UK lead the world in genetic research within years. I am determined to do all I can to support the health and scientific sector to unlock the power of DNA, turning an important scientific breakthrough into something that will help deliver better tests, better drugs and above all better care for patients.... David Cameron, August 2014 (my emphasis) 7(c) Stephen Senn 2019
  • 8.
    8 The world’s leadingregulatory agency speaks (c) Stephen Senn 2019
  • 9.
    9 59% had noor at worst mild headache after 2 hours when treated with paracetamol 49% had no or at worst mild headache after 2 hours when treated with placebo 59%-49% = 10% Therefore 10% benefitted The number needed to treat (NNT) for one extra patient to have a benefit is 10 Based on a review of 23 studies and 6000 patients The leading evidence based medicine organisation speaks (c) Stephen Senn 2019
  • 10.
    The financial pressgets in on the act Olivia Rossanese, Institute of Cancer Research, December 2018 (c) Stephen Senn 2019 10
  • 11.
  • 12.
  • 13.
    Warning We tend tobelieve the truth is in there. Sometimes it isn’t and the danger is that we will find it anyway (c) Stephen Senn 2019 13
  • 14.
    Statistics on non-responders Whatthe FDA says Where the FDA got it Paving the way for personalized medicine, FDA Oct 2013 Spear, Heath-Chiozzi & Huff, Trends in Molecular Medicine, May 2001 14(c) Stephen Senn 2019
  • 15.
    Back to thesource of the source Where the FDA got it Where those who got it got it Spear, Heath-Chiozzi & Huff, Trends in Molecular Medicine, May 2001 15(c) Stephen Senn 2019
  • 16.
    My thesis •We havea plague of zombie statistics • They are ugly • They are evil • They refuse to die •Even if the figures were right in some numerical sense, they wouldn’t mean what they are assumed to mean •We need to do something! 16(c) Stephen Senn 2019
  • 17.
    Back to theheadache A Recipe to Mimic the Cochrane Results •Generate one random number, Ui, for each of 6000 headaches, i = 1,2…6000 •Calculate pairs of headache •Yi1 =-log(Ui)2.97 (placebo headache duration) •Yi2 =-log(Ui)2.24 (paracetamol headache duration) •Now randomly erase one member of each pair •Because each headache can only receive one treatment •The other is counterfactual •Draw the empirical cumulative distribution 17(c) Stephen Senn 2019
  • 18.
  • 19.
    Why this recipe? •The exponential distribution with mean 2.97 is chosen so that the probability of response in under two hours is 0.49 • This is the placebo distribution • The exponential distribution with mean 2.24 is chosen so that the probability of response in under two hours of 0.59 • This is the paracetamol distribution • This is what you would see if every headache were reduced to the same degree (about ¼) • It is also mimics exactly the Cochrane result 19(c) Stephen Senn 2019
  • 20.
    Lessons Particular • The NNTof 10 is perfectly compatible with paracetamol having exactly the same proportionate effect on every headache • Nothing in the data we are given says anything whatsoever about differential response In general • An NNT cannot tell you what proportion of patients responded • To think so is a straightforward conceptual mistake • Claims regarding the proportion who respond based on NNTs are misleading 20(c) Stephen Senn 2019
  • 21.
    Personalised medicine (c) StephenSenn 2019 21 A field that has proved highly productive in producing publications and grant funding.
  • 22.
  • 23.
    Ulcer treatment inthe last quarter of the 20th century • A great success story • Four to five major innovations/discovery • H2 antagonists • Proton pump inhibitors • The role of H Pylori • C13 Urea breath test • Antibiotics developed to treat H Pylori • Together these transformed the treatment of ulcer treatment • General surgery largely wiped out • For the many not just the few • Admittedly the combination of the C13 test and antibiotic treatment involves a degree of personalisation • But now look at how the personalised medicine bandwagon misrepresents it (c) Stephen Senn 2019 23
  • 24.
    Wasteful medicine? “Every day,millions of people are taking medications that will not help them. The top ten highest-grossing drugs in the United States help between 1 in 25 and 1 in 4 of the people who take them. “ Schork, N, Nature 2015 24(c) Stephen Senn 2019
  • 25.
    •This is forNexium (Esomeprazole) compared to other proton pump inhibitors •This is a highly successful class of treatment •‘Response’ is 92% in one case and 88% in the other at 8 weeks (Labenz et al, 2005) •Response rises over time and would probably increase beyond 8 weeks •The claim that only 1 in 25 benefit is nonsense 25 Nexium revisited (c) Stephen Senn 2019
  • 26.
    Two extreme cases Illustratedwith the EXPO study 26 Esomeprazole Not healed Healed Total Pantoprazole Not healed 7.9 4.8 12.7 Healed 0.0 87.3 87.3 Total 7.9 92.1 100.0 Esomeprazole Not healed Healed Total Pantoprazole Not healed 0.0 12.7 12.7 Healed 7.9 79.4 87.3 Total 7.9 92.1 100.0 Case where no patient would respond on Pantoprazole who did not on Esomeprazole (Nexium) Case where all patients who did not respond on Esomeprazole (Nexium) would respond on Pantoprazole (c) Stephen Senn 2019
  • 27.
    We have movedfrom finding highly effective treatments for most patients to trying to find expensive ones for almost nobody at all (c) Stephen Senn 2019 27
  • 28.
    How responder analysismisleads us: Six depressingly common sins • Poor choice of counterfactual • Baseline does not necessarily predict what would happen in the absence of treatment • Bad measures • Percent change from baseline is known to be a highly variable and badly behaved measure • Arbitrary dichotomy • There is nothing magic about the standards we use and dichotomising loses information • Linguistic confusion • Responder does not mean ‘was caused to improve’ it means ‘was observed to improve’ • Causal naivety • Subsequence is not consequence • Failure to replicate • If you want to exclude within-patient variability as an explanation you have to know how big it is. That involves measuring patients more than once 28(c) Stephen Senn 2019
  • 29.
    29 Slide with theObligatory Purloined Cartoon Senn, Nature, 29 November 2018 (c) Stephen Senn 2019
  • 30.
    15% increase inforced expiratory volume in one second (FEV1) Some regulatory magic 30 Some key efficacy PD responses were similar between xxx and yyy following 180 μg single dose inhalation. The percentage of responders (15% increase in FEV1 from baseline) was 63% and 52% for xxx and yyy, respectively From a cross-over trial submitted to the FDA as part of a review This is cited just to show that the standard of 15% bronchodilation is used I shall now use an example of my own (c) Stephen Senn 2019
  • 31.
    So can weidentify individual response with cross-overs? • Cross-over trial in asthma • 71 patients • Forced expiratory volume in one second (FEV1) at 12 hours • FDA definition of response is  15% increase compered to baseline • There seem to be a number of patients who respond to B and not to A and vice versa • Clearly if we can find predictive characteristics of them we can improve treatment • Can’t we? 31(c) Stephen Senn 2019
  • 32.
    Differential response? Not sofast • A is ISF 12g, formoterol • B is ISF 24g formoterol • It is biologically extremely implausible that patients could respond to 12g and not to 24g • Yet apparently 8 out of 71 patients did • What can the explanation be? • Large within patient variability • Conclusion: naïve simple views of causality and response aren’t good enough and more complex design and analysis is needed 32(c) Stephen Senn 2019
  • 33.
    The real lessons •Other things being equal a high NNT is indicative of a poorer treatment but it is not a valid shortcut to studying variation • We need to understand and master the variation in the system • We need to not naively over-interpret differentiation in observed response • Some of it may be genuine treatment-by-patient interaction • Much of it may be within-patient variation • In many (but not all) cases the task facing us will be to deliver better average medicine • In this connection there is one big problem we continually overlook • The main source of variation in the system is not patients • It’s doctors 33(c) Stephen Senn 2019
  • 34.
    The central problemin management and leadership is failure to understand the information in variation. Lloyd S Nelson (quoted by WE Deming) • As Deming, the guru of quality control taught us, it is the duty of every manager to understand the variation in the system • This is what is inspiring what Brent James is doing at Inter- Mountain health • At the moment we are making a bad job of this • NNTs and responder analysis are no substitute for serious study of components of variation • There is no point publishing and developing yet more complicated fancy stuff involving mixed models if we fall at the first hurdle • Once you have sold the post by permitting naïve causal definitions the battle is already lost • We must do better in fighting the omic hype • and I would include me but I am retired 34(c) Stephen Senn 2019
  • 35.
    (c) Stephen Senn3535(c) Stephen Senn 2019
  • 36.
    The supply oftruth always greatly exceeds its demand John F Moffitt 36(c) Stephen Senn 2019
  • 37.
    Suggested further reading 37 Araujo,A., S. Julious and S. Senn (2016). "Understanding Variation in Sets of N- of-1 Trials." PLOS ONE 11(12): e0167167. Holland, P. W. (1986). "Statistics and Causal Inference." Journal of the American Statistical Association 81(396): 945-960. Robins, J. and S. Greenland (1989). "The probability of causation under a stochastic model for individual risk." Biometrics 45(4): 1125-1138. Rubin, D. B. (1974). "Estimating causal effects of treatments in randomized and nonrandomized studies." Journal of educational Psychology 66(5): 688. Senn, S. J. (2001). "Individual Therapy: New Dawn or False Dawn." Drug Information Journal 35(4): 1479-1494. Senn, S. J. (2004). "Individual response to treatment: is it a valid assumption?" BMJ 329(7472): 966-968. Senn, S. J. (2016). "Mastering variation: variance components and personalised medicine." Statistics in Medicine 35(7): 966-977. Senn SJ. (2018) Statistical pitfalls of personalized medicine. Nature. 2018;563(7733):619-621. Snapinn, S. and Q. Jiang (2011). "On the clinical meaningfulness of a treatment's effect on a time-to-event variable." Stat Med 30(19): 2341-2348. (c) Stephen Senn 2019