Downloaded 12 times


![Full (skeleton) analysis of variance with Genstat ®
Additional Code Output
(c) Stephen Senn 2019 17
TREATMENTSTRUCTURE Design[]
ANOVA
(Here Design[] is a pointer with values corresponding
to each of the three designs.)](https://image.slidesharecdn.com/toinfinityandbeyondv6norwich-191003161508/85/To-infinity-and-beyond-17-320.jpg)

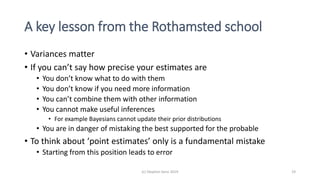


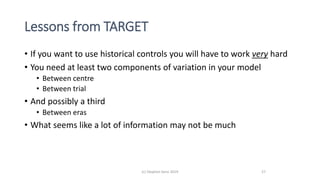


The document discusses lessons from small experiments and the Rothamsted School approach to experimental design and analysis. It provides three key lessons: 1) Variances matter - if you cannot estimate variances precisely, you do not know how to interpret your results or make inferences. The Rothamsted approach matches the analysis to the experimental design to properly account for variances. 2) Experimental designs should eliminate sources of variation that can be controlled, like blocking by centers. This allows the analysis to focus on remaining uncontrolled variations. 3) Lord's paradox arises because some analyses, like comparing change scores, do not adjust for important baseline covariates, while other analyses do adjust and find significant effects. Proper analysis depends on


