Download to read offline
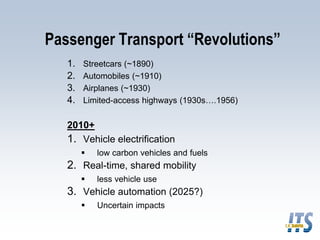
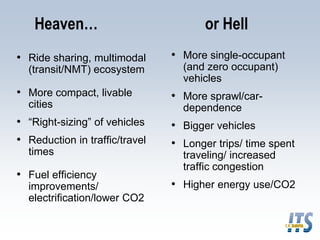
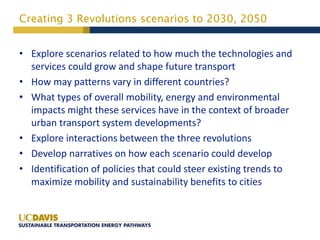
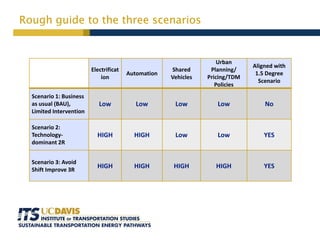
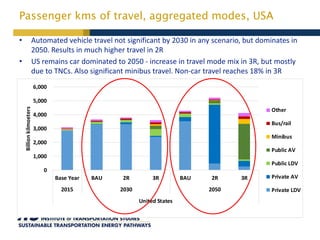
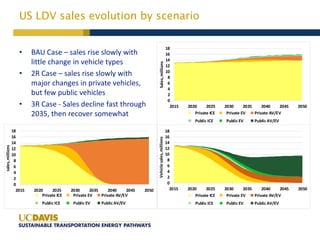
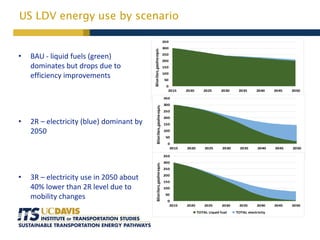

This document summarizes a presentation about three potential revolutions in global transportation by 2030/2050: electrification of vehicles, real-time shared mobility, and vehicle automation. It outlines three scenarios for how these revolutions may play out: Business As Usual with limited changes; a Technology-Dominant scenario where automation and electrification grow substantially but shared mobility does not; and an Avoid-Shift-Improve scenario where all three revolutions are adopted at large scale alongside supportive urban planning and pricing policies. The presentation analyzes the impacts of these scenarios on passenger travel, vehicle sales, and energy use in the United States. The next steps are to refine the results and develop full narratives and policy implications.


![Implementing TOD [To Scale] [For All]](https://cdn.slidesharecdn.com/ss_thumbnails/lucnadaltt2017todscreen-170120143550-thumbnail.jpg?width=640&height=640&fit=bounds)


