Download as PDF, PPTX
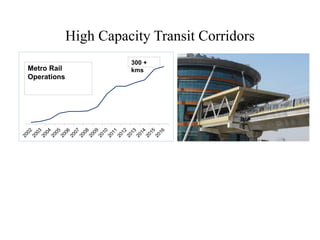
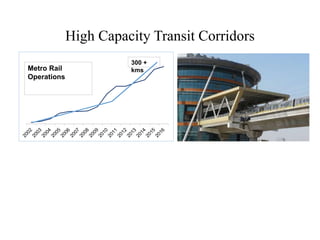
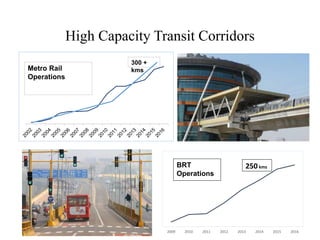
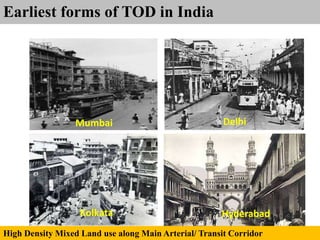
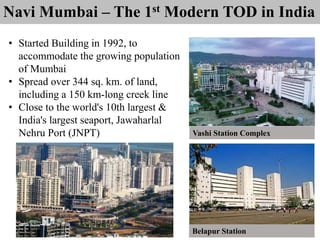

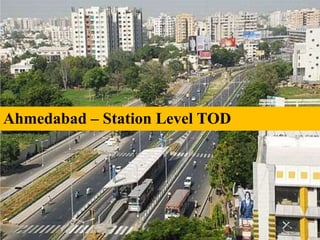
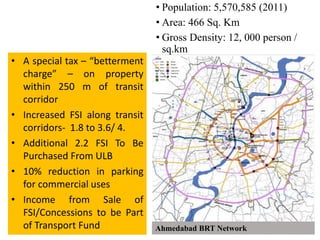
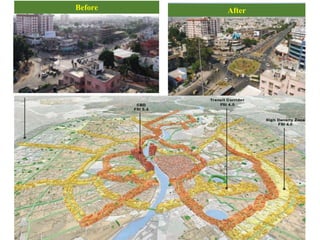
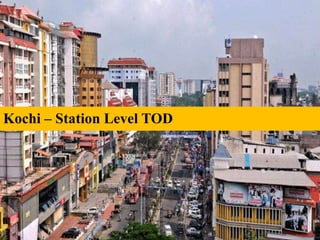
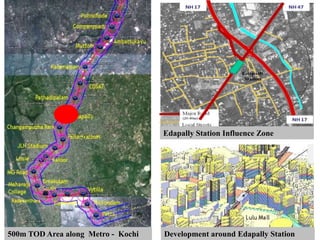
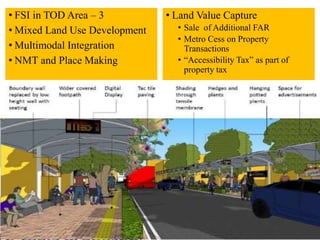

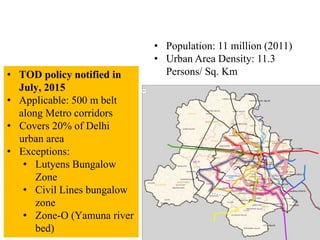
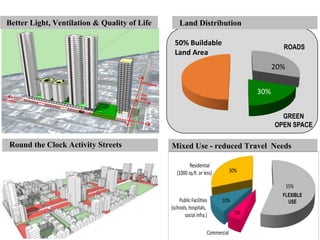
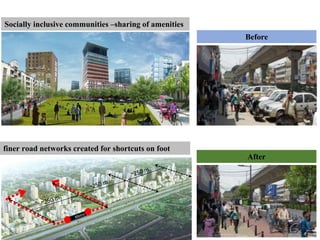
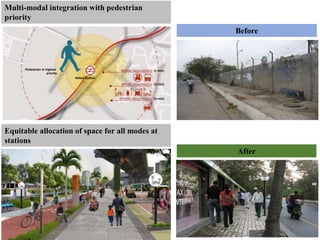
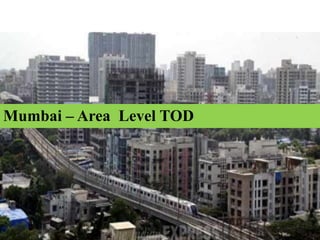
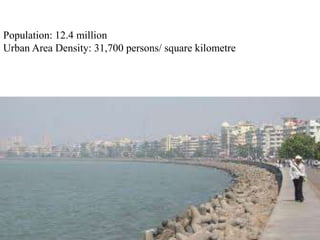
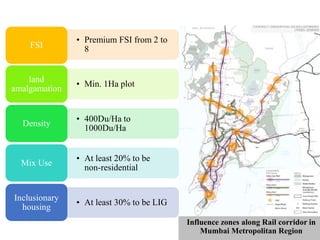


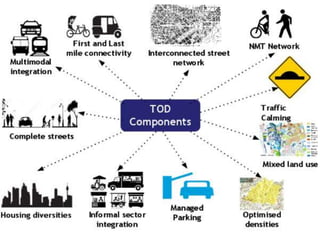
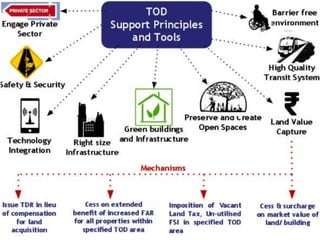

The document discusses transit-oriented development (TOD) in India, highlighting its implementation across various cities like Mumbai, Delhi, Ahmedabad, and Kochi. It emphasizes the integration of high-capacity transit corridors, mixed land use, and policies to enhance urban density and connectivity. Key features include population statistics, spatial planning strategies, and specific local initiatives aimed at improving urban mobility and livability.