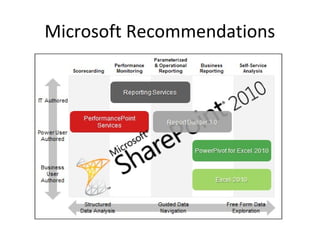
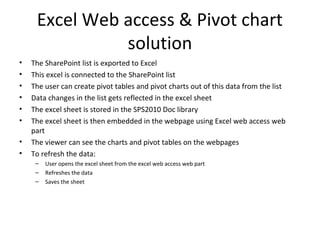
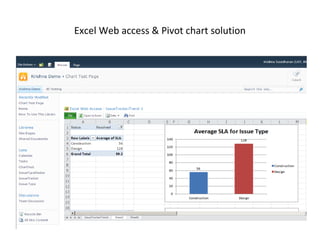
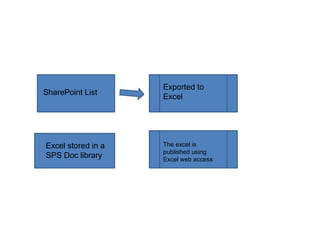
This document evaluates four options for creating charts and reports from SharePoint list data: 1) SharePoint chart web part, 2) Power Pivot using Excel 2010, 3) MS PerformancePoint, and 4) Excel pivot published using Excel web services. It recommends the Excel web access & pivot chart solution which involves exporting SharePoint list data to Excel, connecting the Excel to automatically refresh from the list, creating pivot tables and charts in Excel, publishing the Excel file using Excel web access, and manually refreshing the data. This allows for interactive charts and reports directly on SharePoint pages without coding or extensive IT support.