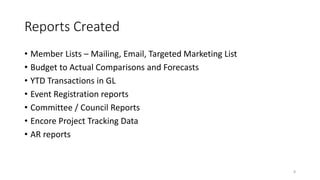
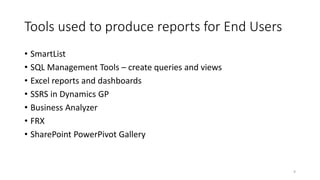
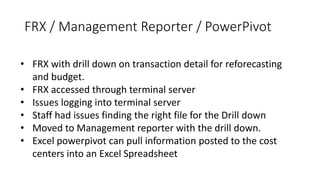
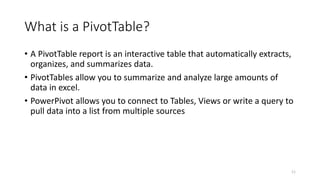
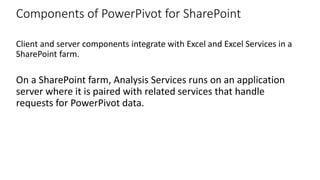
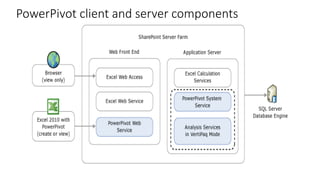
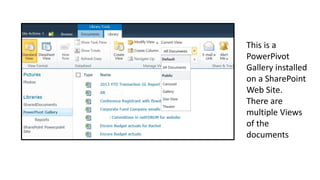
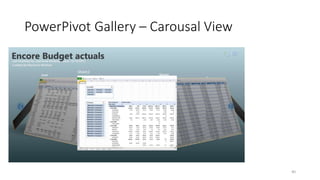
This document discusses deploying PowerPivot 2010 in SharePoint 2010 to provide business intelligence and analytics to end users. It provides an overview of PowerPivot functionality, how to connect Excel workbooks to various data sources using PowerPivot, and how to publish PowerPivot workbooks to a SharePoint gallery where pivot tables and reports can be accessed and refreshed by users through a web browser. Examples of specific reports created for metrics like budgets, transactions, and project tracking are also mentioned.
This slideshow is for IT professionals, data analysts, managers, and anyone looking to drive more productivity from Excel. You will learn how you can effectively leverage the add-ins with your own data and analysis requirements.
One of the pillars of the SQL Server 2008 R2 release is Managed Self-Service BI.
Peter Myers of SolidQ will introduce:
* SQL Server PowerPivot for Excel
* SQL Server PowerPivot for SharePoint
The SQL Server PowerPivot for Excel add-in is a key offering in this pillar, and delivers an entirely new analytic experience to Excel 2010. This add-in allows analysts to load and prepare large volumes of data from various sources to create a multidimensional model. The model can be enriched with sophisticated calculations. Then the model can then be used as the source for PivotTable and PivotChart reports.
With the SQL Server PowerPivot for SharePoint add-in, the Excel workbooks that host the PowerPivot model can be cataloged in SharePoint and exposed as a data source for other Excel and Reporting Services reports. These SharePoint hosted models can then be managed by IT with scheduled data refreshes from the originating data stores.
SAP Business Objects XIR3.0/3.1, BI 4.0 & 4.1 Course Content
SAP Business Objects Web Intelligence and BI Launch Pad 4.0
Introducing Web Intelligence
BI launch pad: What's new in 4.0
Customizing BI launch pad
Creating Web Intelligence Documents with Queries
Restricting Data Returned by a Query
Report Design in the Java Report Panel
Enhancing the Presentation of Reports
Formatting Reports
Creating Formulas and Variables
Synchronizing Data
Analyzing Data
Drilling
Filtering data
Alerts
Input Control
Scheduling (email)
Data Refresh introduction
Sharing Web Intelligence Documents
SAP Business Objects BI Information Design Tool 4.0
Create a project
Create a connection to a relational database
Create a data foundation based on a single source relational database
Create a business layer based on a single relational data source
Publish a new universe file based on a single data source
Retrieve a universe from a repository location
Publish a universe to a local folder
Retrieve a universe from a local folder
Open a local project
Delete a local project
Convert a repository universe from a UNV to a UNX
Convert a local universe from a UNV to a UNX
Connecting to Data Sources
Create a connection shortcut
View and filter data source values in the connection editor
Create a connection to an OLAP data source
Create a BICS connection to SAP BW for client tools
Create a relational connection to SQL Server using OLEDB providers
Building the Structure of a Universe
Arrange tables in a data foundation
View table values in a data foundation
View values from multiple tables in a data foundation
Filter table values in a data foundation
Filter values from multiple tables in a data foundation
Apply a wildcard to filter table values in a data foundation
Apply a wildcard to filter values from multiple tables in a data foundation
Sort and re-order table columns in a data foundation
Edit table values in a data foundation
Create an equi-join, theta join, outer join, shortcut join
Create a self-restricting join using a column filter
Modify and remove a column filter
Detect join cardinalities in a data foundation
Manually set join cardinalities in a data foundation
Refresh the structure of a universe
Creating the Business Layer of a Universe
Create business layer folders and subfolders
Create a business layer folder and objects automatically from a table
Create a business layer subfolder and objects automatically from a table
Create dimension objects automatically from a table
Create a dimension, attribute , measure
Hide folders and objects in a business layer
Organize folders and subfolders in a business layer
View table and object dependencies
Create a custom navigation path
Create a dimensional business layer from an OLAP data source
Copy and paste folders and objects in a business layer
Filtering Data in Objects
Create a pre-defined
This document provides an overview of the mass additions process in Oracle Assets, which involves five main steps: 1) Create Mass Additions imports asset data into the FA_MASS_ADDITIONS table from external sources like legacy systems or Oracle modules, 2) Prepare Mass Additions adds additional data fields to the mass additions, 3) Post Mass Additions creates actual assets by posting the data, 4) Delete Mass Additions removes mass additions no longer needed, and 5) Purge Mass Additions completely removes deleted mass additions from the system. The document describes each step and available reports to help manage the mass additions process.
This document is Nancy Soule's business intelligence portfolio, which showcases various Microsoft BI projects including SQL Server, SSIS, SSAS, SSRS, Performance Point, and SharePoint. The portfolio includes descriptions and screenshots of projects to design a BI solution for a construction company, extract and transform data from various sources using SSIS, build an Analysis Services cube and KPIs, create reports in SSRS, build dashboards in Performance Point, and integrate the solutions using SharePoint.
This document describes a business intelligence solution designed for a fictional construction company called AllWorks. The solution uses various Microsoft BI tools including SQL Server Integration Services for ETL, SQL Server Analysis Services for cube development, SQL Server Reporting Services for reports, Performance Point Server for dashboards, and SharePoint for deployment. It provides details on how each tool was used to extract, transform, load, analyze and report on AllWorks' employee, customer, timesheet, labor rates, job order, materials, and invoice data to help the company better understand its business performance and trends.
The document summarizes tests of using the DB Connect feature in SAP BW 3.0B to extract data from non-SAP databases and transfer it to a SAP BW database. Three configurations were tested: 1) Extracting data from an Oracle database and transferring it to a DB2 database in a BW system, 2) Extracting data from a DB2 database running locally to the BW system, and 3) Extracting data from a remote DB2 database via an application server. The tests showed that in all three configurations, data was successfully extracted from the non-SAP databases and loaded into the SAP BW PSA for analysis.
This document provides an agenda and overview of financial reporting tools from Oracle/Hyperion, including Hyperion Financial Reports, SmartView, and other options. It discusses the advantages and disadvantages of each tool, how they can be used, new features in version 11.1.1, and includes examples of reports and layouts. The presentation aims to help audiences understand Oracle/Hyperion financial reporting options and how to select the best tool based on their specific reporting needs.
1. PowerPivot for Excel 2010 allows users to perform complex data analysis without technical assistance. It includes a powerful in-memory database that can organize and relate large amounts of data from different sources.
2. PowerPivot features include the ability to analyze related tables of data, use the DAX programming language to define calculations, and perform queries across large datasets very quickly thanks to its in-memory processing.
3. Key differences from standard Excel pivot tables include PowerPivot's relational data model, much larger data handling capabilities, and additional analytic functionality through DAX and integrated slicers.
This document outlines a business intelligence solution for a construction company that includes building databases, data warehouses, reports, and dashboards. It involves using SQL Server Integration Services to import data from Excel into databases. Analysis Services is used to create cubes, dimensions and KPIs to analyze profitability and costs. Reporting Services creates reports with charts and filters. Performance Point Server and SharePoint are used to publish reports and dashboards.
This document is part of Oracle BI Publisher Certification Program from Adiva Consulting Inc. contact
info@adivaconsulting.com for you corporate training needs and reduce your training cost by 75%
P6R8.3 Using BI Publisher 11g - Create Multi-Project Status and Pivot Table R...p6academy
This presentation will be step-by-step instructions (using slides) for creating 2 separate reports with BIP 11g. The first report will be tabular Multi-Project Status report with subtotaling on certain values (such as project manager). Each row will include standard project values such as Project ID, Name, Planned Start and Finish Dates, etc.. In addition, configurable project values such as project-level UDF’s and Project Codes will also be shown for each row. The second report will be a Pivot Table report which will pivot the variable number of weekly values for actual and remaining labor units for a list of projects. The presentation will include the development of the data models for both reports. In addition, the presentation part for both reports will be done with 2 different tools: 1. the Report Layout Editor (new in 11g) and 2. the BI Publisher Desktop component which is a Microsoft WORD add-on (formerly known as the WORD template builder). This presentation will include an explanation of the new P6 extended tables, the SQL for the data model to extract the data from P6, a review of the Report Layout Editor, and a review of BI Publisher Desktop component.
Referenced: www.p6academy.com
Source: http://coll15.mapyourshow.com
SAP Cloud Platform Integration allows users to integrate business processes and data across on-premise and cloud applications in a flexible way. It provides capabilities for both process integration and data integration through its data services offering. For data integration, it allows users to efficiently move data between on-premise systems and the cloud using extract, transform, load tasks. This is done through its agent architecture which provides connectivity to on-premise sources and manages secure data transfer to cloud targets. Users can design and test data flows using its web-based user interface to meet their integration needs.
The document compares and contrasts SAP's supply chain planning options including SAP APO, SAP SCM, and SAP Integrated Business Planning (IBP). It outlines the different modules and functions available in each solution, such as demand planning, supply network planning, deployment planning, and order promising. It also discusses key differences like deployment options, supported platforms, and integrated vs. standalone systems.
Excel Services allows users to interact with Excel workbooks in a web browser. It has three main components: Excel Calculation Services calculates workbooks, Excel Web Access displays workbooks in a browser, and Excel Web Services provides an API. Excel Services enables viewing and filtering data, refreshing external connections, and creating dashboards and reports to share data in a secure way. It can integrate with other business intelligence features like the Report Center and KPI web parts.
This document provides steps to configure a database connection from SAP BI/BW to a SQL Server or Oracle database. It describes how to open the database in SQL Server, create a table, enter sample data, and configure the database connection in SAP BI using transaction code DBCO. Key steps include specifying the logical system name, database type, user credentials, and extracting a table for analysis in SAP BI.
This portfolio contains examples of the author's work with Microsoft Business Intelligence tools. It includes projects and queries demonstrating skills in SQL Server, SSIS, SSAS, SSRS, Excel, PerformancePoint Services and SharePoint. It also describes the author's education through SetFocus, a hands-on BI training program focused on the Microsoft stack.
This document demonstrates how to implement a delta mechanism when connecting a SAP BI system to a relational database like SQL or Oracle. It involves creating base and delta tables in the database, along with triggers to populate the delta table with new/updated records. An info package in SAP BI is configured to extract data from the delta table using a data transfer process, in order to synchronize new records from the database into the BI system while avoiding duplicate entries.
The document discusses Hyperion's product suite which includes tools for business intelligence, planning, performance management, and data management. It provides an overview of Essbase, a multidimensional database that allows users to analyze business data from multiple perspectives and levels. Key concepts covered include multidimensional data modeling, OLAP operations for analyzing data (e.g. drill-down, drill-up, slice and dice), and comparing multi-dimensional and relational database approaches.
A top U.S.-based manufacturer had item descriptions that were inconsistent, vague, duplicate, and incomplete. They were preparing to launch a new web store using iStore and needed to have parts categorized properly. This session describes the journey to categorize items, generate standard descriptions and integrate the data to iStore by syncing items from ICCs in PIM to iStore sections, and building out a taxonomy that would make sense to both business users, as well as customers. Using the methodical creation of a taxonomy and schema structure of PIM UDAs to generate item descriptions by leveraging the attribute values and functions in PIM resulted in higher customer satisfaction rates and reduced duplication.
Oracle XML Publisher allows integration with PeopleSoft for template-based reporting. It separates data extraction from report layouts, allowing reuse of extracted data across multiple report templates. Key steps include setting up XML Publisher, creating and registering data sources, developing report templates, defining report definitions, running and viewing reports. Benefits include meeting business needs, reducing complexity and maintenance costs.
Sap hana modelling Online Training is Offering at Glory IT Technologies. We have Certified Working Professionals on this Modules. They trained so many Global Students. We also Provides Corporate Training, Job/Project Support Services to sap hana modelling. We are Only Institute Delivering Best Online Training Services to this Module.
This document provides instructions for using the XLS Processor Engine utility to design templates in Microsoft Excel and publish reports from those templates in Oracle BI Publisher. The summary describes:
1) The utility allows templates to be designed natively in Excel by adding markup, then converts them to an XSL format readable by BI Publisher.
2) Instructions are provided on setting up the template with placeholders, groups, filters and other elements and uploading the converted template.
3) The document outlines how to publish reports from the Excel template in BI Publisher and view the output.
Administrative Reporting of SAS Visual Analytics 7.1 and Integration with E...Francesco Marelli
SAS Visual Analytics 7.1 release introduces a new feature for audit and monitoring in near real-time dedicated to administrators using predefined reports; the new 2.4 release of SAS Environment Manager contains many new features including the ability to create a datamart that can be integrated with Visual Analytics to provide detailed information about the environment. Keinavo will explain how the deployment, integrated in its Cloud offering, of a "BI on BI" system with these features helps maintain efficient systems with an uptime of 99.9%.
Operational dashboarding and reporting with Microsoft Business IntelligenceJohn White
A great looking, relevant, informative dashboard for the executive is the ultimate end goal for most Business Intelligence projects. Microsoft has all of the tools that are necessary to get data from your transactional systems into an effective dashboard. What is less clear is to how to go about achieving it. Which tools should you use? As with most things, we have different tools for different requirements, and it isn't always clear as to how they match up.
This session will focus on what the various reporting and dashboarding tools from Microsoft can do for you, where you should use them, and how to get them working for you. Both on premises and cloud based scenarios will be discussed. At the conclusion of this session, you should have a fundamental understanding of the Microsoft products in this space fit together, including Excel, Reporting Services, SharePoint, Power View, and PerformancePoint.
The document summarizes Arthur Chan's business intelligence portfolio from his master's program. It includes samples and descriptions of projects involving extracting, transforming, and loading data with SQL Server Integration Services, modeling data with SQL Server Analysis Services, creating reports with SQL Server Reporting Services, and developing dashboards and scorecards with PerformancePoint and SharePoint. The portfolio aims to demonstrate Arthur's skills in core business intelligence technologies like SSIS, SSAS, SSRS, and Microsoft Office products for performance management and business analytics.
This document discusses loading and managing financial data in Oracle applications. It describes the format of data load files, how data is stored and retrieved in Financial Management applications, and guidelines for optimizing performance. It also provides instructions for loading data from files, extracting data, exporting data to Extended Analytics, copying data within a database, and removing data.
Summary of all tools and microsoft power biOmar Khan
This document introduces Microsoft Power BI and its tools for data visualization and reporting. It discusses how Power BI can support large data volumes, automated web reporting, and increased efficiency. Power BI tools like Power Pivot, Power View and Excel enable ad-hoc analysis, dashboards, and standard report automation from data marts and beyond Excel limits. Power BI solutions can be deployed on SharePoint for collaboration and on mobile devices.
Sharepoint Content and Usage Reports - guide by SPDocKitSysKit Ltd
SPDocKit is a tool that provides administrators with reports to help manage their SharePoint environment. It offers reports on content and usage which provide insight into storage usage, site collections, content types, and unmodified documents. The storage metrics report shows the storage space used by each SharePoint object. Usage reports provide useful information on unique visitors and site visitors. Content usage reports indicate where content types are used and identify documents whose authors no longer have access. SPDocKit aims to simplify common administrative tasks in SharePoint.
The document discusses PowerPivot for SharePoint. It provides details on how PowerPivot works, including how the PowerPivot workbook is rendered. It describes components like PowerPivot Services and Analysis Services. It also covers installing and configuring PowerPivot for SharePoint farms.
Presented to The Ottawa IT Community Meetup Group (Ottawa SQL - PASS Chapter) on Thursday September 19
Powerful Self-Service BI in Excel 2013 - Data search and discovery with Power Query (formerly "Data Explorer"), analyzing and modeling with Power Pivot, visualizing and exploring with Power View and Power Map (formerly codename "GeoFlow")
This document provides an overview and introduction to Power BI tools including Power Query, Power Pivot, Power View, and Power Map. It begins with an introduction by Stéphane Fréchette and outlines the session which will cover the Microsoft Business Intelligence stack, self-service BI in Excel using Power BI tools, demonstrations of the tools, and resources for further information. The document then provides brief descriptions of each Power BI tool and its capabilities for accessing, cleaning, visualizing and sharing data.
Branson - Self-Service Business Intelligence for On-Prem OrganizationsTheresa Lubelski
This document provides an agenda and overview of Excel tools including Power Query, Power View, PowerPivot, and Power View Reports. It summarizes the capabilities and requirements for each tool. It also discusses the differences between Excel 2013 and Power BI Desktop, and highlights some improvements in Excel 2016 related to business analytics and data visualization.
This document outlines an SQL Server 2008 business intelligence course. The course will cover SQL Server Reporting Services for building reports, processing reports locally or on the server, and report administration. It will also discuss analyzing data with tools like Microsoft Data Analyzer, ProClarity, Excel, and PerformancePoint. The course will demonstrate how to publish reports, create OLAP cubes, and do data mining and predictive analytics. Finally, it discusses alternative reporting and analysis options in SQL Server 2008 R2 and SharePoint 2010 like PowerPivot and Visio Services.
This document discusses PowerPivot for SharePoint. It covers configuring PowerPivot for SharePoint, working with PowerPivot workbooks, and managing PowerPivot for SharePoint. PowerPivot allows users to easily create self-service BI applications using Excel. It stores large datasets in memory for fast analysis. PowerPivot workbooks can be uploaded, accessed, and managed through the PowerPivot Gallery in SharePoint.
A dashboard is an invaluable tool to gain insight into an organization's operation and performance. Businesses use a dashboard to view and analyze data such as expense & profit, identify patterns, predict trends and more. We will take a look at using Microsoft Excel to convert the raw data and quickly turn it into easy-to-use yet powerful dashboard to get instant results, and be able to slice and dice data dynamically. You will be able to use these techniques cross-industry with any data.
Accelerate Report Migrations from Cognos Power BI & TableauSenturus
Learn how the Senturus Report Insights app decodes Cognos reports and models accelerating report migrations to Power BI and Tableau. Save time. Save money. View this on-demand webinar with demos: https://senturus.com/resources/accelerate-report-migrations-from-cognos-to-power-bi-tableau/.
Senturus offers a full spectrum of services in business intelligence and training on Tableau, Power BI and Cognos. Our resource library has hundreds of free live and recorded webinars, blog posts, demos and unbiased product reviews available on our website at: http://www.senturus.com/senturus-resources/.
Power BI for Office 365: Using SharePoint to Deliver Self-ServicePerficient, Inc.
The document discusses Microsoft's Power BI tools for self-service business intelligence (BI) and analytics. It describes the key components of Power BI, including Excel-based tools for self-service BI (Power Query, Power Pivot, Power View, Power Map) and Power BI capabilities available with Office 365, such as Power BI sites for collaboration and data management features. The document provides an overview of the Power BI tools and capabilities as well as examples of how they can be used to connect to data, build reports and dashboards, and share and consume BI content.
To watch the recorded on-demand web seminar go to http://alturl.com/2mjzg
A new simplified and rich interface for self-service reporting and analysis brings your business intelligence to a whole new level. Now, with all the capabilities of IBM Cognos V10.1.1, you can extend your business intelligence and have even more agility. Realize the advantages of upgrading to Business Insight Advanced from Report Studio Express and learn how to gain greater user satisfaction while maintaining proper IT governance.
Learn more: www.CognosEducation.com
Microsoft PowerPivot & Power View in Excel 2013Mark Ginnebaugh
PowerPivot is an add-in for Excel that empowers business users to create their own tabular data models. Power View is also available in the Excel 2013 client. It was first released as a server-based report authoring tool with SQL Server 2012 and is available in SharePoint Server 2010 Enterprise.
You'll learn:
* How to work with the add-in in the Excel 2013 client
* How compelling interactive reports can be created quickly and easily
* The new PowerPivot features - including pie charts, maps, KPIs, hierarchies, drill down/drill up, and report styles
Peter Myers specializes in Microsoft Business Intelligence, and provides mentoring, technical training and course content authoring for SQL Server and Office. Peter has current SQL Server and MCT certifications, and has been a Microsoft MVP (Most Valued Professional) since 2007.
Power pivot planning_and_deployment_whitepaperKlaudiia Jacome
Microsoft SQL Server PowerPivot redefines business intelligence (BI) by enabling self-service BI and collaboration. It integrates with Excel 2010 to provide powerful data analysis capabilities and with SharePoint 2010 to establish a managed environment for sharing and refreshing workbook applications. Deploying PowerPivot requires installing the Excel add-in on client machines and the SharePoint component on servers, with planning needed to optimize the environment.
SharePoint Saturday New Hampshire 2013 PowerView Deep DiveGreystone Solutions
Jill is a Microsoft Certified Software Developer (MCSD) and Microsoft Certified IT Professional (MCITP) in Business Intelligence and Database Development. She has been a valued member of the Greystone team since 2000. Jill has worked on a variety of successful projects involving database design, development, integration, and administration. In addition to her database skills, Jill is a talented .NET developer with several years of web application design and development experience. In this deck, Jill walks her audience through the features & benefits of leveraging SharePoint 2013 & related technologies to deliver robust self-service Business Intelligence solutions to the masses.
Self-Service Business Intelligence in ExcelInnoTech
This document provides an overview of Theresa Eller's background and an agenda for a presentation on Excel tools. Theresa is a Business Systems Analyst at MD Anderson Cancer Center, holds Microsoft Office Specialist certification in SharePoint 2013, and is President of the Houston SharePoint User Group. The agenda covers Excel tools like Power Query, Power View, PowerPivot, and changes and enhancements in Excel 2016, including the removal of the Power View tab.
Power BI Report Builder & Paginated Reports Senturus
Learn how to use Power BI Report Builder to build paginated reports. Paginated reports allow you to control formatting exactly for delivery as a PDF or on paper, constraining tables to fit on a page and adding headers and footers. Watch the demos and download this deck at: https://senturus.com/resources/power-bi-report-builder-paginated-pixel-perfect-reports.
Senturus offers a full spectrum of services across the BI stack plus training on Power BI, Cognos and Tableau. Our resource library has hundreds of free live and recorded webinars, blog posts, demos and unbiased product reviews available on our website at: http://www.senturus.com/senturus-resources/.
- SSRS with SQL Server 2008 R2 introduced several new features including improved data visualization, enhanced report design tools, support for additional data sources, and better collaboration and sharing capabilities.
- The user interface in Report Manager and Report Builder was simplified and enhanced with features like an AJAX report viewer and support for rotating text and additional chart types.
- Developers have additional tools for building reports including new lookup functions, calculating aggregates of aggregates, and publishing report parts to a gallery. Data can now be retrieved from SQL Azure, Parallel Data Warehouse, and SharePoint lists.
- Shared datasets and cache refresh plans improve performance and maintainability. Reports can also be rendered as Atom feeds for consumption in tools like Excel 2010
We are pleased to share with you the latest VCOSA statistical report on the cotton and yarn industry for the month of March 2024.
Starting from January 2024, the full weekly and monthly reports will only be available for free to VCOSA members. To access the complete weekly report with figures, charts, and detailed analysis of the cotton fiber market in the past week, interested parties are kindly requested to contact VCOSA to subscribe to the newsletter.
Do People Really Know Their Fertility Intentions? Correspondence between Sel...Xiao Xu
Fertility intention data from surveys often serve as a crucial component in modeling fertility behaviors. Yet, the persistent gap between stated intentions and actual fertility decisions, coupled with the prevalence of uncertain responses, has cast doubt on the overall utility of intentions and sparked controversies about their nature. In this study, we use survey data from a representative sample of Dutch women. With the help of open-ended questions (OEQs) on fertility and Natural Language Processing (NLP) methods, we are able to conduct an in-depth analysis of fertility narratives. Specifically, we annotate the (expert) perceived fertility intentions of respondents and compare them to their self-reported intentions from the survey. Through this analysis, we aim to reveal the disparities between self-reported intentions and the narratives. Furthermore, by applying neural topic modeling methods, we could uncover which topics and characteristics are more prevalent among respondents who exhibit a significant discrepancy between their stated intentions and their probable future behavior, as reflected in their narratives.
Did you know that drowning is a leading cause of unintentional death among young children? According to recent data, children aged 1-4 years are at the highest risk. Let's raise awareness and take steps to prevent these tragic incidents. Supervision, barriers around pools, and learning CPR can make a difference. Stay safe this summer!
Interview Methods - Marital and Family Therapy and Counselling - Psychology S...PsychoTech Services
A proprietary approach developed by bringing together the best of learning theories from Psychology, design principles from the world of visualization, and pedagogical methods from over a decade of training experience, that enables you to: Learn better, faster!
1. PowerPivot 2010 in SharePoint 2010
• Deploying Business Intelligence to the end user with SharePoint
Enterprise, Excel Services and PowerPivot
1
2. About me
• I love collecting code and re-using it as much as possible to save time
and money and leverage SharePoint.
• I gather views by searching the internet sites like “GPUG’s Share My
Code” site, SharePoint Users groups and CodePlex.
• I belong to several users groups including GPUG, Yammer SPYam, and
FEDSPUG where I get valuable information on SharePoint tips and
tricks.
2
3. Experience
• Power user with Microsoft SharePoint®, Microsoft Office®, Dynamics
GP, Forecaster 7.0, Management Reporter and Encore Project
software
• Retrieve data using Microsoft SQL queries, views, SSRS (Reporting
Services), Smart List Builder & Microsoft Excel® PowerPivot
• Deployed PowerPivot software in SharePoint 2010 to give staff access
to budgets and actuals from Encore project tracking and to pull
information and lists from our AMS.
3
4. • Currently using Microsoft Dynamics GP 2013 R2
• PowerPivot Gallery in SharePoint 2010 Enterprise - access to budgets
and actuals, Encore project tracking, and information and lists from
membership database.
4
5. Deploying Business Intelligence to the end user
with SharePoint Enterprise, Excel Services and
PowerPivot
• Excel workbooks with the PowerPivot add in use SQL queries and
views to pull real time data from multiple sources.
• Excel Services and PowerPivot service in SharePoint can display and
refresh the data on a web page.
• The data sources that I use include Microsoft Dynamics GP,
Forecaster, Encore, Unanet, and our AMS (association Management
System) database.
5
6. Why SharePoint
• The file Share and Intranet were already in SharePoint
• Sharing large files was difficult - email was not secure
• Files need to be protected - only the proper user can have access to
reports.
• SharePoint Library has permissions tied to Active Directory and could
support the large workbooks
• One Place for Reports
6
7. Agenda
• Types of reporting and tools
• FRX vs Power Pivot for Detail Drill Down Reports
• PivotTables
• PowerPivot in Excel
• PowerPivot Gallery and Library Views in SharePoint Enterprise
• Excel Services and PowerPivot in SharePoint
7
8. Reports Created
• Member Lists – Mailing, Email, Targeted Marketing List
• Budget to Actual Comparisons and Forecasts
• YTD Transactions in GL
• Event Registration reports
• Committee / Council Reports
• Encore Project Tracking Data
• AR reports
8
9. Tools used to produce reports for End Users
• SmartList
• SQL Management Tools – create queries and views
• Excel reports and dashboards
• SSRS in Dynamics GP
• Business Analyzer
• FRX
• SharePoint PowerPivot Gallery
9
10. FRX / Management Reporter / PowerPivot
• FRX with drill down on transaction detail for reforecasting
and budget.
• FRX accessed through terminal server
• Issues logging into terminal server
• Staff had issues finding the right file for the Drill down
• Moved to Management reporter with the drill down.
• Excel powerpivot can pull information posted to the cost
centers into an Excel Spreadsheet
11. What is a PivotTable?
• A PivotTable report is an interactive table that automatically extracts,
organizes, and summarizes data.
• PivotTables allow you to summarize and analyze large amounts of
data in excel.
• PowerPivot allows you to connect to Tables, Views or write a query to
pull data into a list from multiple sources
11
12. What is required to use PowerPivot?
• Microsoft Office 2010 and the add on PowerPivot for Excel will allow
you to create workbooks with Pivot tables using Slicers to create a
three dimensional view of your data.
• To Publish Excel PowerPivot Workbooks to SharePoint you need
SharePoint 2010 SP1 Enterprise Edition, Windows® 2008 R2,
Microsoft SQL Server 2008, Office 2010, PowerPivot add in for Excel
• Excel 2013 PowerPivot is not backwardly compatible – you cannot
open an Excel PowerPivot 2010 file from the PowerPivot Gallery in
Excel 2013 and save it back to the PowerPivot gallery – it will no
longer open in the gallery
12
13. Excel 2010 with PowerPivot Add in
• Install the Power Pivot add-in
• Connect to data from data sources
• Create new queries or connect to tables or views
• Data Model directly in Excel
• You can add calculated fields to use in the pivot tables
• Power Pivot in SharePoint so pages can be displayed in browser
13
14. Get PowerPivot for Excel 2010
• Download Powerpivot from the Microsoft site
• http://www.microsoft.com/en-us/download/details.aspx?id=102
• It is an Add in that self installs when you open Excel.
• Open Excel
• Create a new Blank Workbook
• (Excel 2013 have PowerPivot, Query, View included)
14
15. Click on the PowerPivot Tab after downloading and installing the Add-in.
Then click on the Green PowerPivot Window button
Click on the From Database Icon to connect to the Datasource that you want
to use (SQL, Access, Excel)
16. For this example we are pulling
the data from a SQL Server
database
You type in the server name and
choose the way that you will be
logging into the server
We set up a special user with
read only. There are many ways
to set up permissions and
restrict you can see what data
or what they can see in reports.
16
17. Once you set up your connection you
have a choice to select from the list
of tables or views or you can write
your own query. Cannot write data
back just pulls data.
17
18. This is an example of
writing a simple query
from our membership
database – pulling
information from
multiple tables. Write
queries for our
membership database –
use more views for GP
19. 19
The other option is to select
Tables and views – there are
some great recorded webinars in
GPUG community on joining
tables.
These are some of the views that
I have created in a database.
Views can be found at GPUG or
on various websites
I have views for AP, AR, GL, Fixed
Assets, Budgets
20. 20
View for Budget Data from Encore for my pivot table
SELECT TOP (100) PERCENT 1 AS SOURCE, CAST(DB_NAME() AS char(5)) AS CompanyDB, a.BUDGETID,
d.YEAR1 AS Year, a.PERIODID, a.BUDGETAMT, a.ACTINDX,
RTRIM(b.ACTNUMST) AS ACTNUM, c.ACTDESCR
FROM dbo.GL00201 AS a INNER JOIN
dbo.GL00105 AS b ON a.ACTINDX = b.ACTINDX INNER JOIN
dbo.GL00100 AS c ON b.ACTINDX = c.ACTINDX INNER JOIN
dbo.GL00200 AS d ON a.BUDGETID = d.BUDGETID
ORDER BY a.BUDGETID
21. 21
View for Budget Data from Encore for my pivot table
22. View for Budget Cross Tab in GP
VW_BudgetCrossTab
• SELECT TOP (100) PERCENT CompanyDB, BUDGETID, RTRIM(BUDGETID) + ' ' + ACTNUM + ' ' + ACTDESCR AS ASSUMPTION, Year, ACTINDX, ACTNUM,
• SUM(CASE PERIODID WHEN 0 THEN BUDGETAMT ELSE 0 END) AS P00, SUM(CASE PERIODID WHEN 1 THEN BUDGETAMT ELSE 0 END) AS P01,
• SUM(CASE PERIODID WHEN 2 THEN BUDGETAMT ELSE 0 END) AS P02, SUM(CASE PERIODID WHEN 3 THEN BUDGETAMT ELSE 0 END) AS P03,
• SUM(CASE PERIODID WHEN 4 THEN BUDGETAMT ELSE 0 END) AS P04, SUM(CASE PERIODID WHEN 5 THEN BUDGETAMT ELSE 0 END) AS P05,
• SUM(CASE PERIODID WHEN 6 THEN BUDGETAMT ELSE 0 END) AS P06, SUM(CASE PERIODID WHEN 7 THEN BUDGETAMT ELSE 0 END) AS P07,
• SUM(CASE PERIODID WHEN 8 THEN BUDGETAMT ELSE 0 END) AS P08, SUM(CASE PERIODID WHEN 9 THEN BUDGETAMT ELSE 0 END) AS P09,
• SUM(CASE PERIODID WHEN 10 THEN BUDGETAMT ELSE 0 END) AS P10, SUM(CASE PERIODID WHEN 11 THEN BUDGETAMT ELSE 0 END) AS
P11,
• SUM(CASE PERIODID WHEN 12 THEN BUDGETAMT ELSE 0 END) AS P12
• FROM dbo.vw_BudgetData
• GROUP BY CompanyDB, Year, BUDGETID, ACTNUM, ACTINDX, ACTDESCR
• ORDER BY CompanyDB, Year, BUDGETID, ACTNUM
22
23. 23
View for Budget Cross Tab in GP
VW_BudgetCrossTab
25. 25
After you click finish the import
will start and tell you how many
records have been transferred to
the Excel Workbook – This data is
now stored in the Excel workbook
– No data writes back to the
database so you can manipulate
the data and created calculated
fields
28. To create a quick pivot table you can click on the PivotTable button under
the Home tab in the PowerPivot Section. This will give you a drop down of
choices between charts and tables. Or you can produce a flattened
PivotTable which puts the data in a flattened format instead of the pivot
table standard of adding each new item below the one above it.
29. • Row Fields are fields from the source data
that are assigned to a row layout in a
PivotTable.
• Column Fields are fields from the source
data that are assigned to a column layout.
• Report Filters are fields from the source
data that act as filters in a PivotTable report
• Items are the subcategories of a row,
column, or report filter.
• Values Fields are fields from the source
data that contain values to be summarized.
• The Data Area is the range of cells in a
PivotTable report that contains summarized
data.
34. Encore Project
tracking in GP –
participants and
projects. Pivot
table summarizes
the data – slicers
have been to
choose participants
and project to see
details
34
35. 35
Time Line and Slicer – pulled Tasks from Outlook -
36. Components of PowerPivot for SharePoint
Client and server components integrate with Excel and Excel Services in a
SharePoint farm.
On a SharePoint farm, Analysis Services runs on an application
server where it is paired with related services that handle
requests for PowerPivot data.
38. PowerPivot service
• PowerPivot Web service - runs on web application server.
• Redirects requests from web application to PowerPivot System
Service instance in the farm.
• Analysis Service server instance - SharePoint integrated mode.
• Loads, queries, and unloads data.
• Processes data if the workbook is configured for PowerPivot data
refresh.
38
39. This is a
PowerPivot
Gallery installed
on a SharePoint
Web Site.
There are
multiple Views
of the
documents
44. PowerPivot installation for SharePoint
• Created a Data Feed Library and PowerPivot Gallery
• Uploaded PowerPivot enabled excel workbook using slicers data refresh.
• Set up a special account in SQL called Report Writer with limited rights
• Required password entry upon refresh – did not want to save the
credentials with the workbook because it kept it in plain text
45. Things to keep in mind while working with
PowerPivot
• Increased maximum upload size and maximum workbook size from 50MB to
500MB for the SharePoint document libraries
• The data refresh account must be granted contribute permissions on any
PowerPivot workbook for which it is used.
• Contribute permission are set for the entire site but if any sites or libraries use
unique permissions, this account will need to be given the appropriate access in
order to open the workbook from a library and then save it back to the library after
a refresh.
• The data refresh account needs read-only permissions on all the external data
sources that are used in any data refresh operation.
• Each site collection has to be enabled for PowerPivot, so if any site collections are
added in the future this will need to be activated.
46. Links
• GPUG SSRS Monday SIG: Using Excel Power Pivot to Analyze GP Data (Sep 2014)
• http://www.gpug.com/communities/community-home/
librarydocuments/viewdocument/?DocumentKey=0f27e261-80e2-492a-b093-
99d40426594f
• DAX
• http://technet.microsoft.com/en-us/library/gg399181(v=sql.110).aspx
• GPUG Learn & Engage –Webinars on Demand (Members Only)
• http://www.gpug.com/engage/recordings
• http://victoriayudin.com
• Instant SQL Formatting
• http://www.dpriver.com/pp/sqlformat.htm?ref=g_wangz
46
Editor's Notes
Originally used Solomon – moved to GP while consolidating account GL Codes – went from a GL where people had been adding codes for years to a simple 4-4 code.
Keep summary in the GL with Detail in our membership database for the A/R
We have systems hosted in a private cloud, on premise and in the cloud. Three SQL servers with multiple databases that I need to gather information from.
I am the IT department – I pull lists and gather data for staff on demand. The quicker I can get the data out the easier my job is
Keeping everything in one place
Large Datasets
You have to download the add in for Excel 2010 – it is include in 2013 but you cannot use 2013 with the SharePoint 2010 PowerPivot Gallery – the workbooks will no longer work in the browser if you update them to the 2013 version
Once you set up your connection you have a choice to select from the list of tables or views or you can write your own query. Cannot write data back just pulls data.
This is an example of writing a simple query from our membership database – pulling information from multiple tables. Write queries for our membership database – use more views for GP
View from Encore Project tracking
Definitions of what goes into a pivot table – Rows and columns are just like Excel rows and columns – filters let you filter what will display in the pivot table.
Items – Org_name – then Prc_display_name would show each organization and then all the items that were connected to the organization – the payamount would go in the values
Change Slicer size – columns height
Example of a pivot table – Time Line and Slicer – pulled from Exports Tasks from Outlook -
More definitions
Model of the server and services
I have been downloading the files and refreshing them and then saving them back up – I did not want to have it autorefresh each time staff opened the file because they only needed a snapshot up to the time the financial statements were created. The refresh does put a load on the Web front and and Sql Server.
The next view is the Theater view - the file view is on the bottom of the