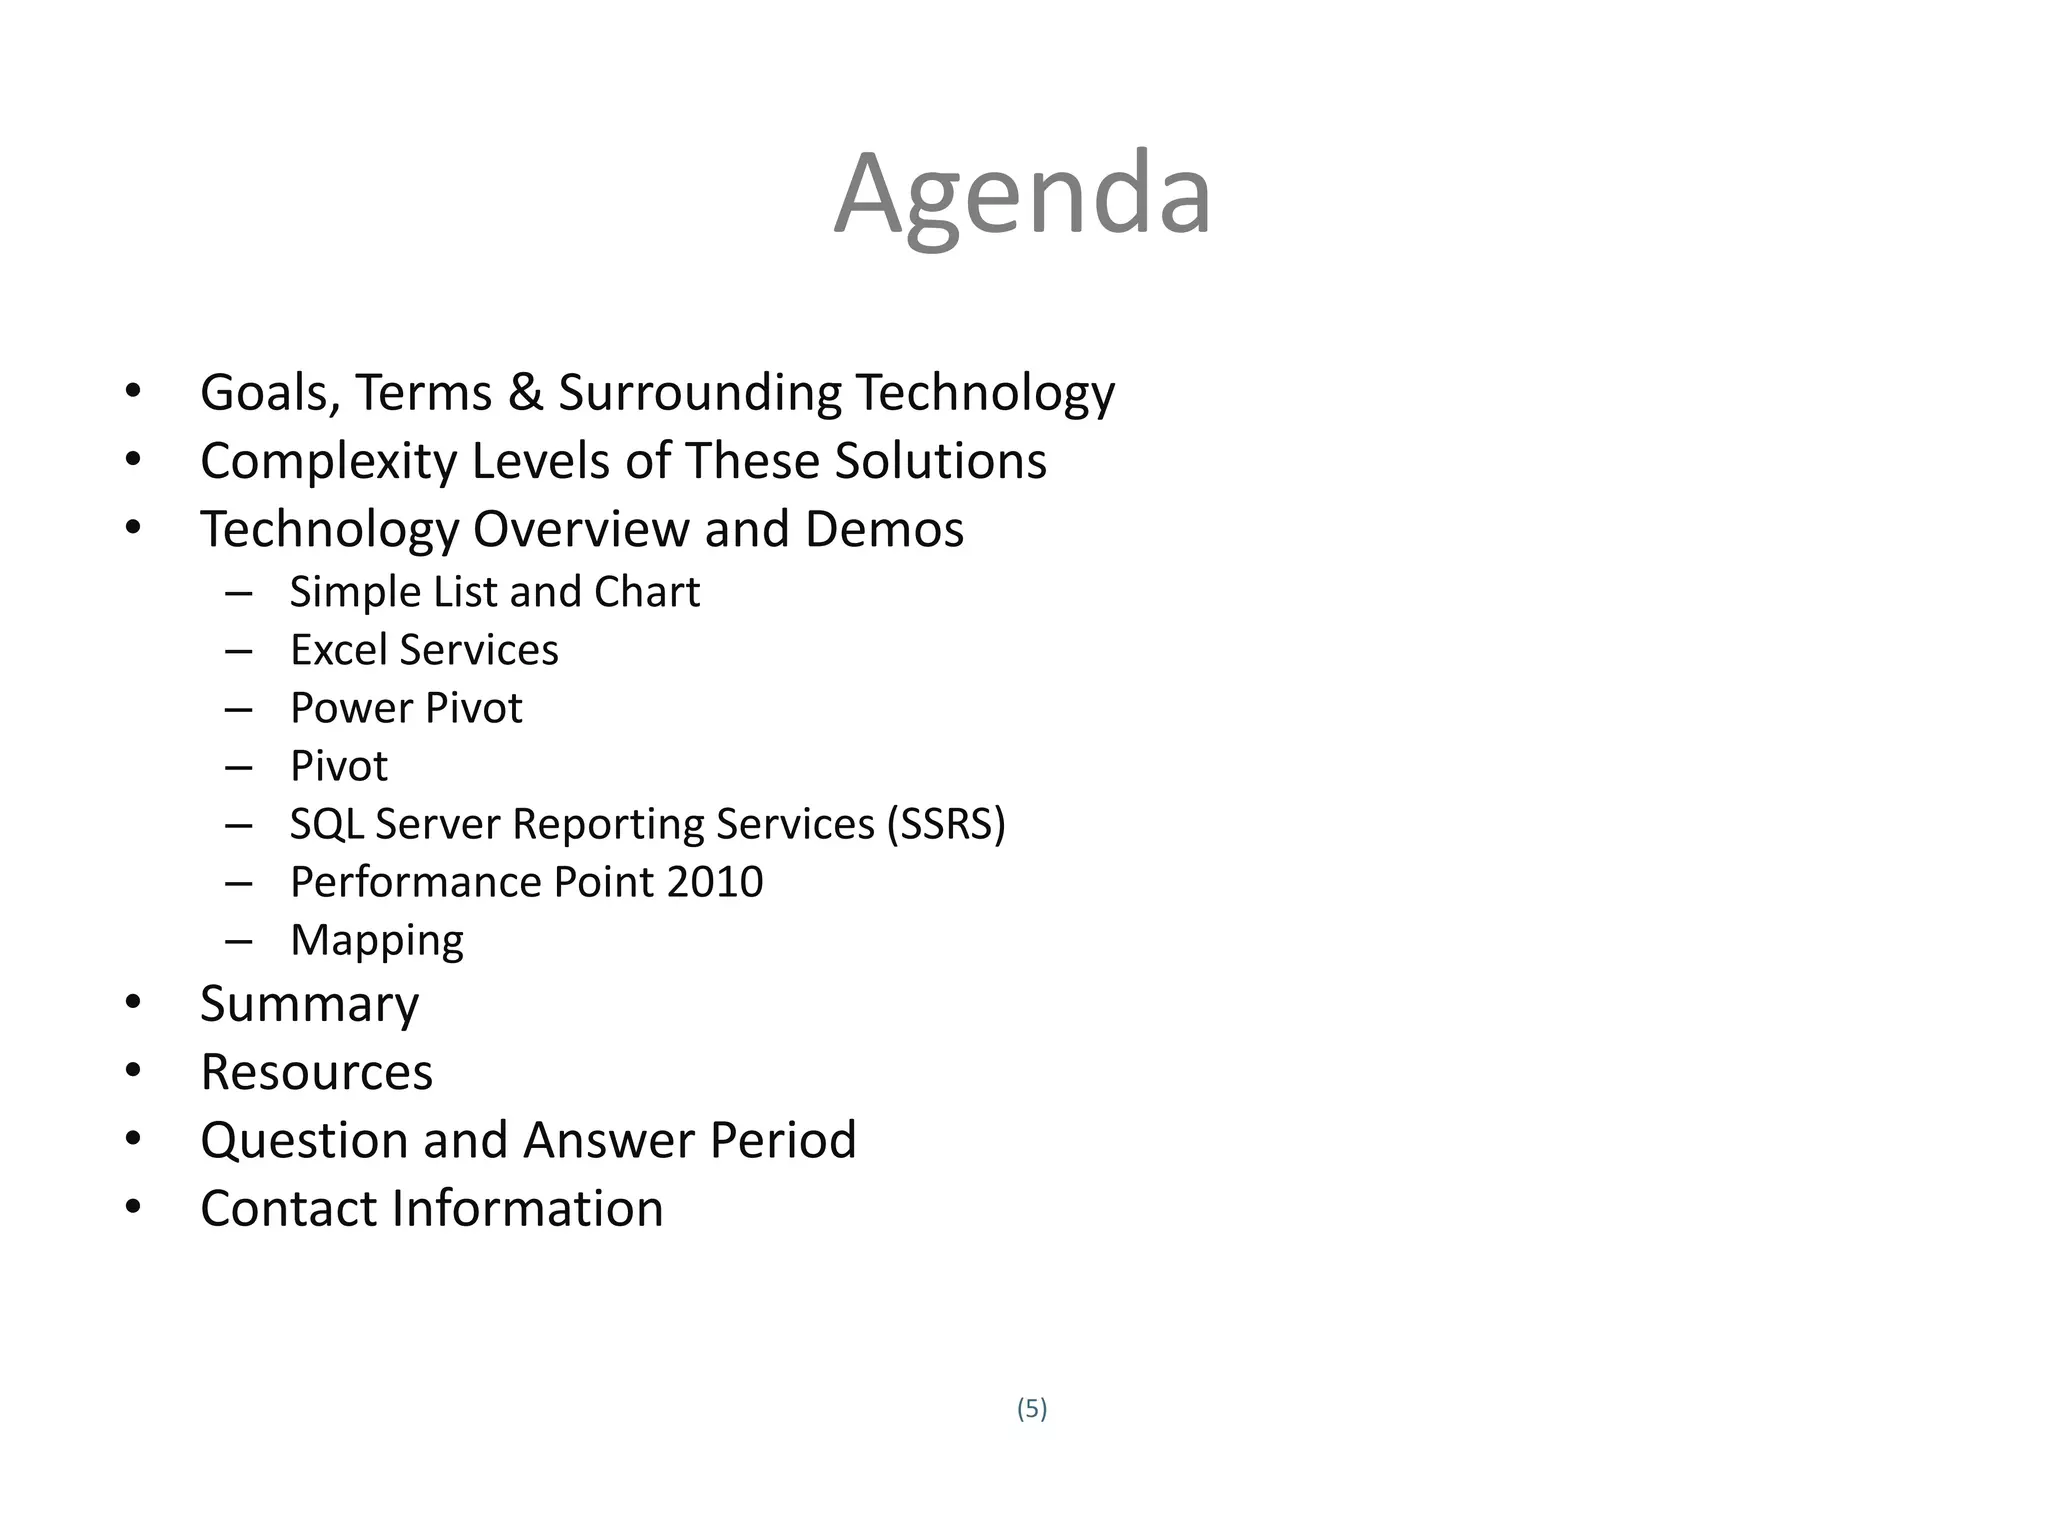
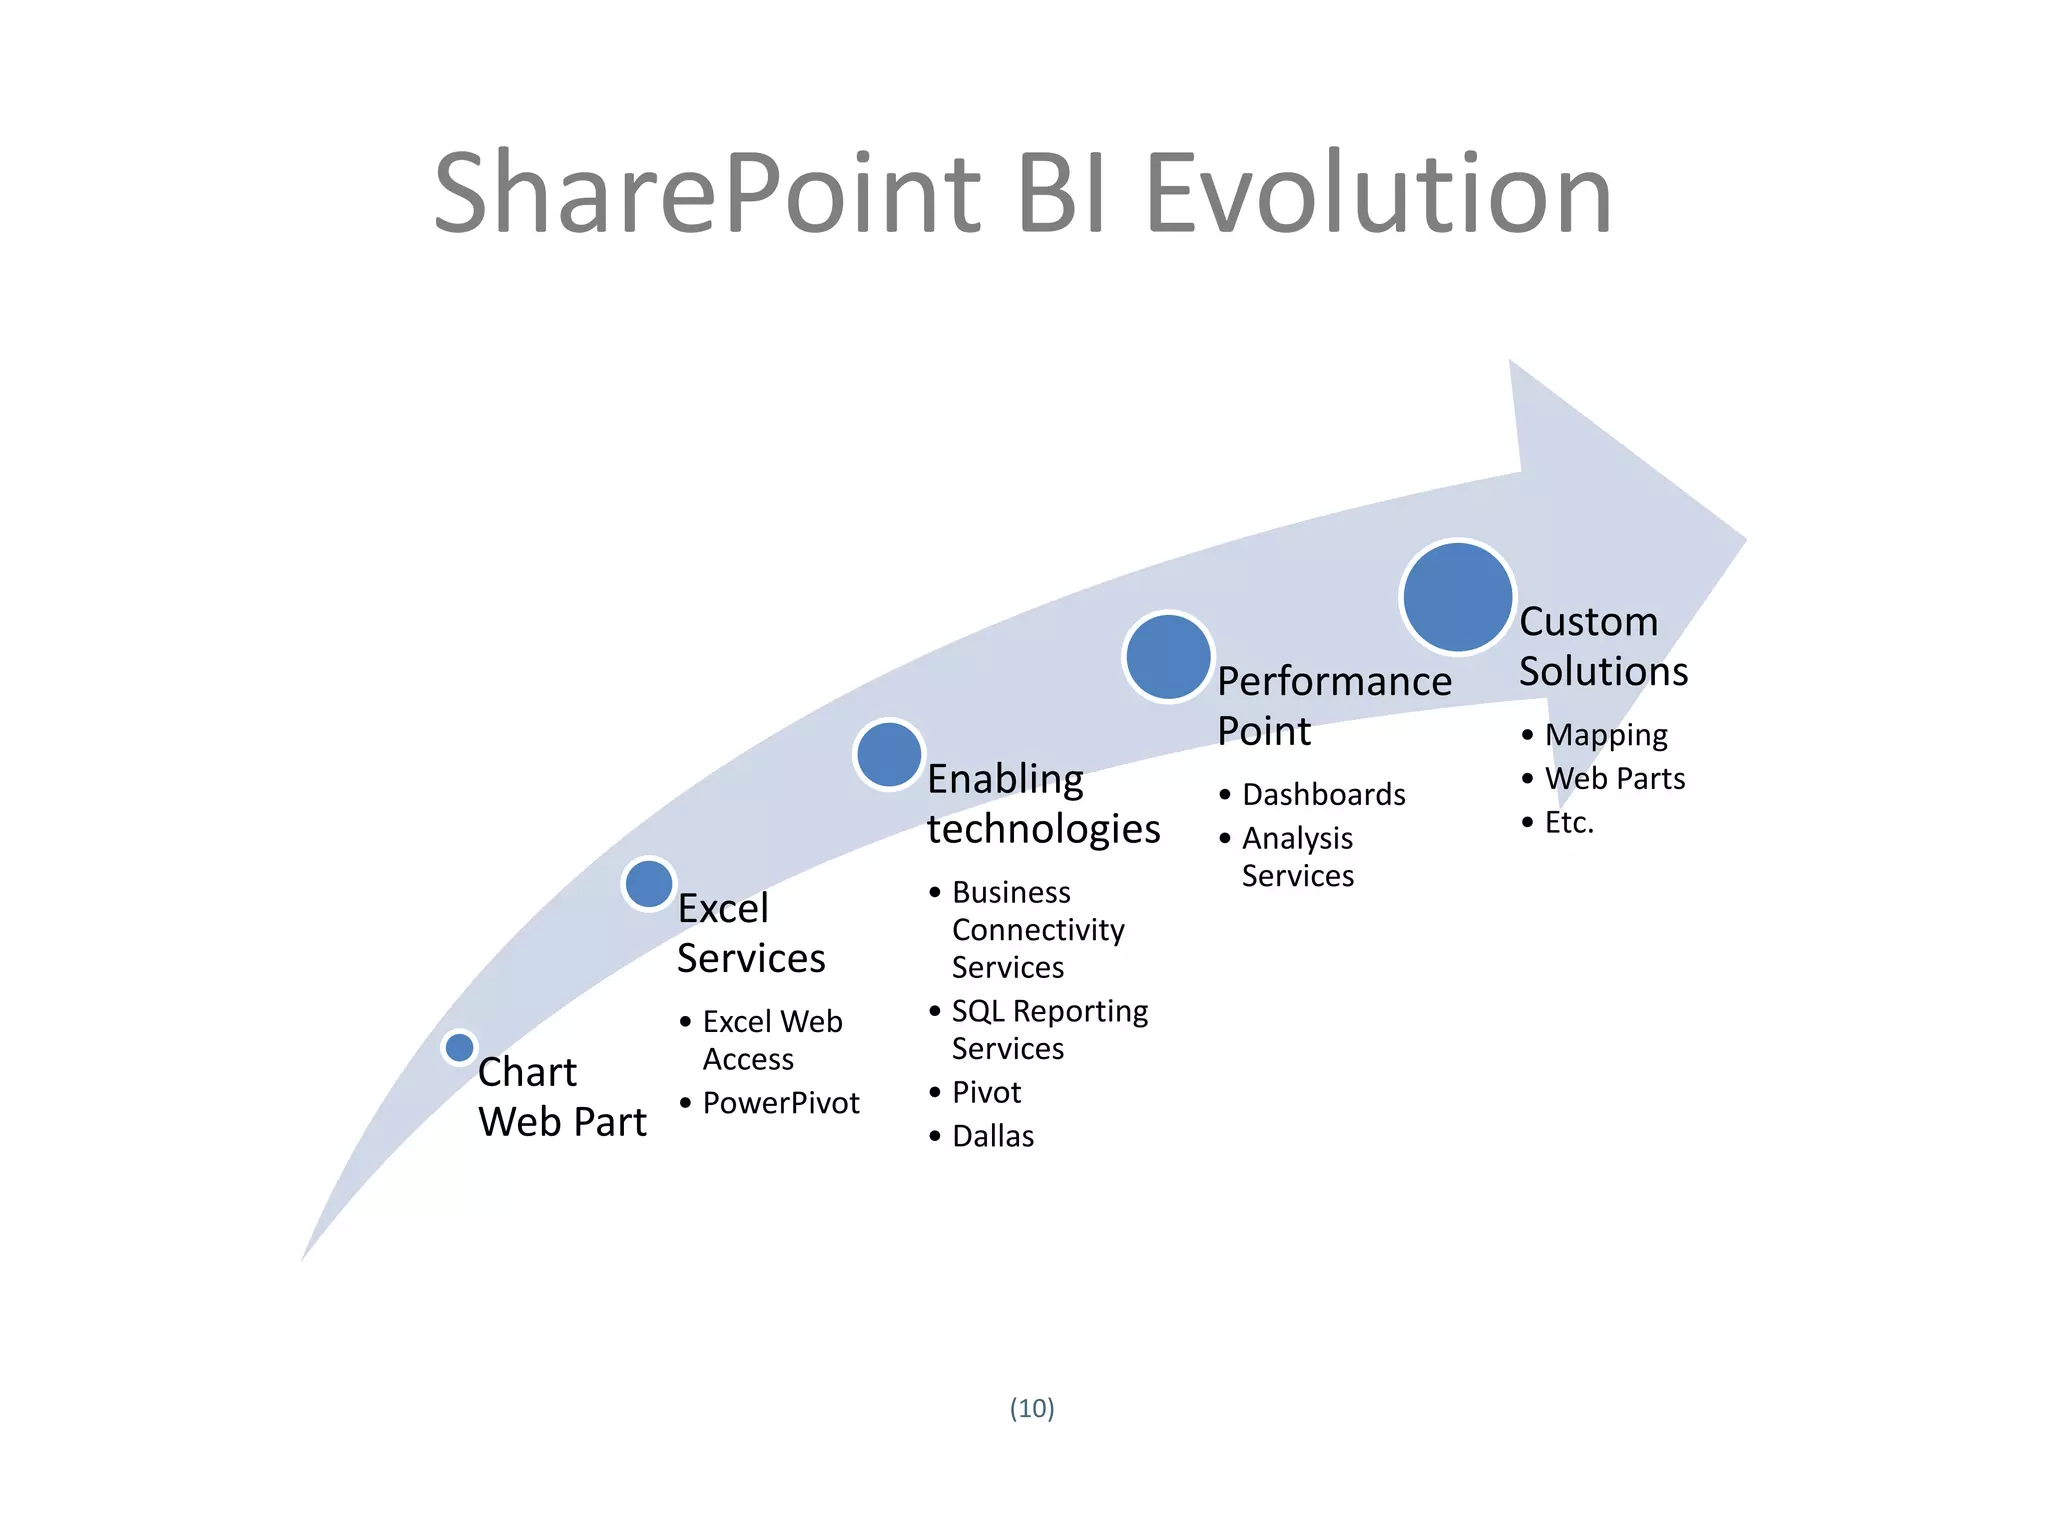
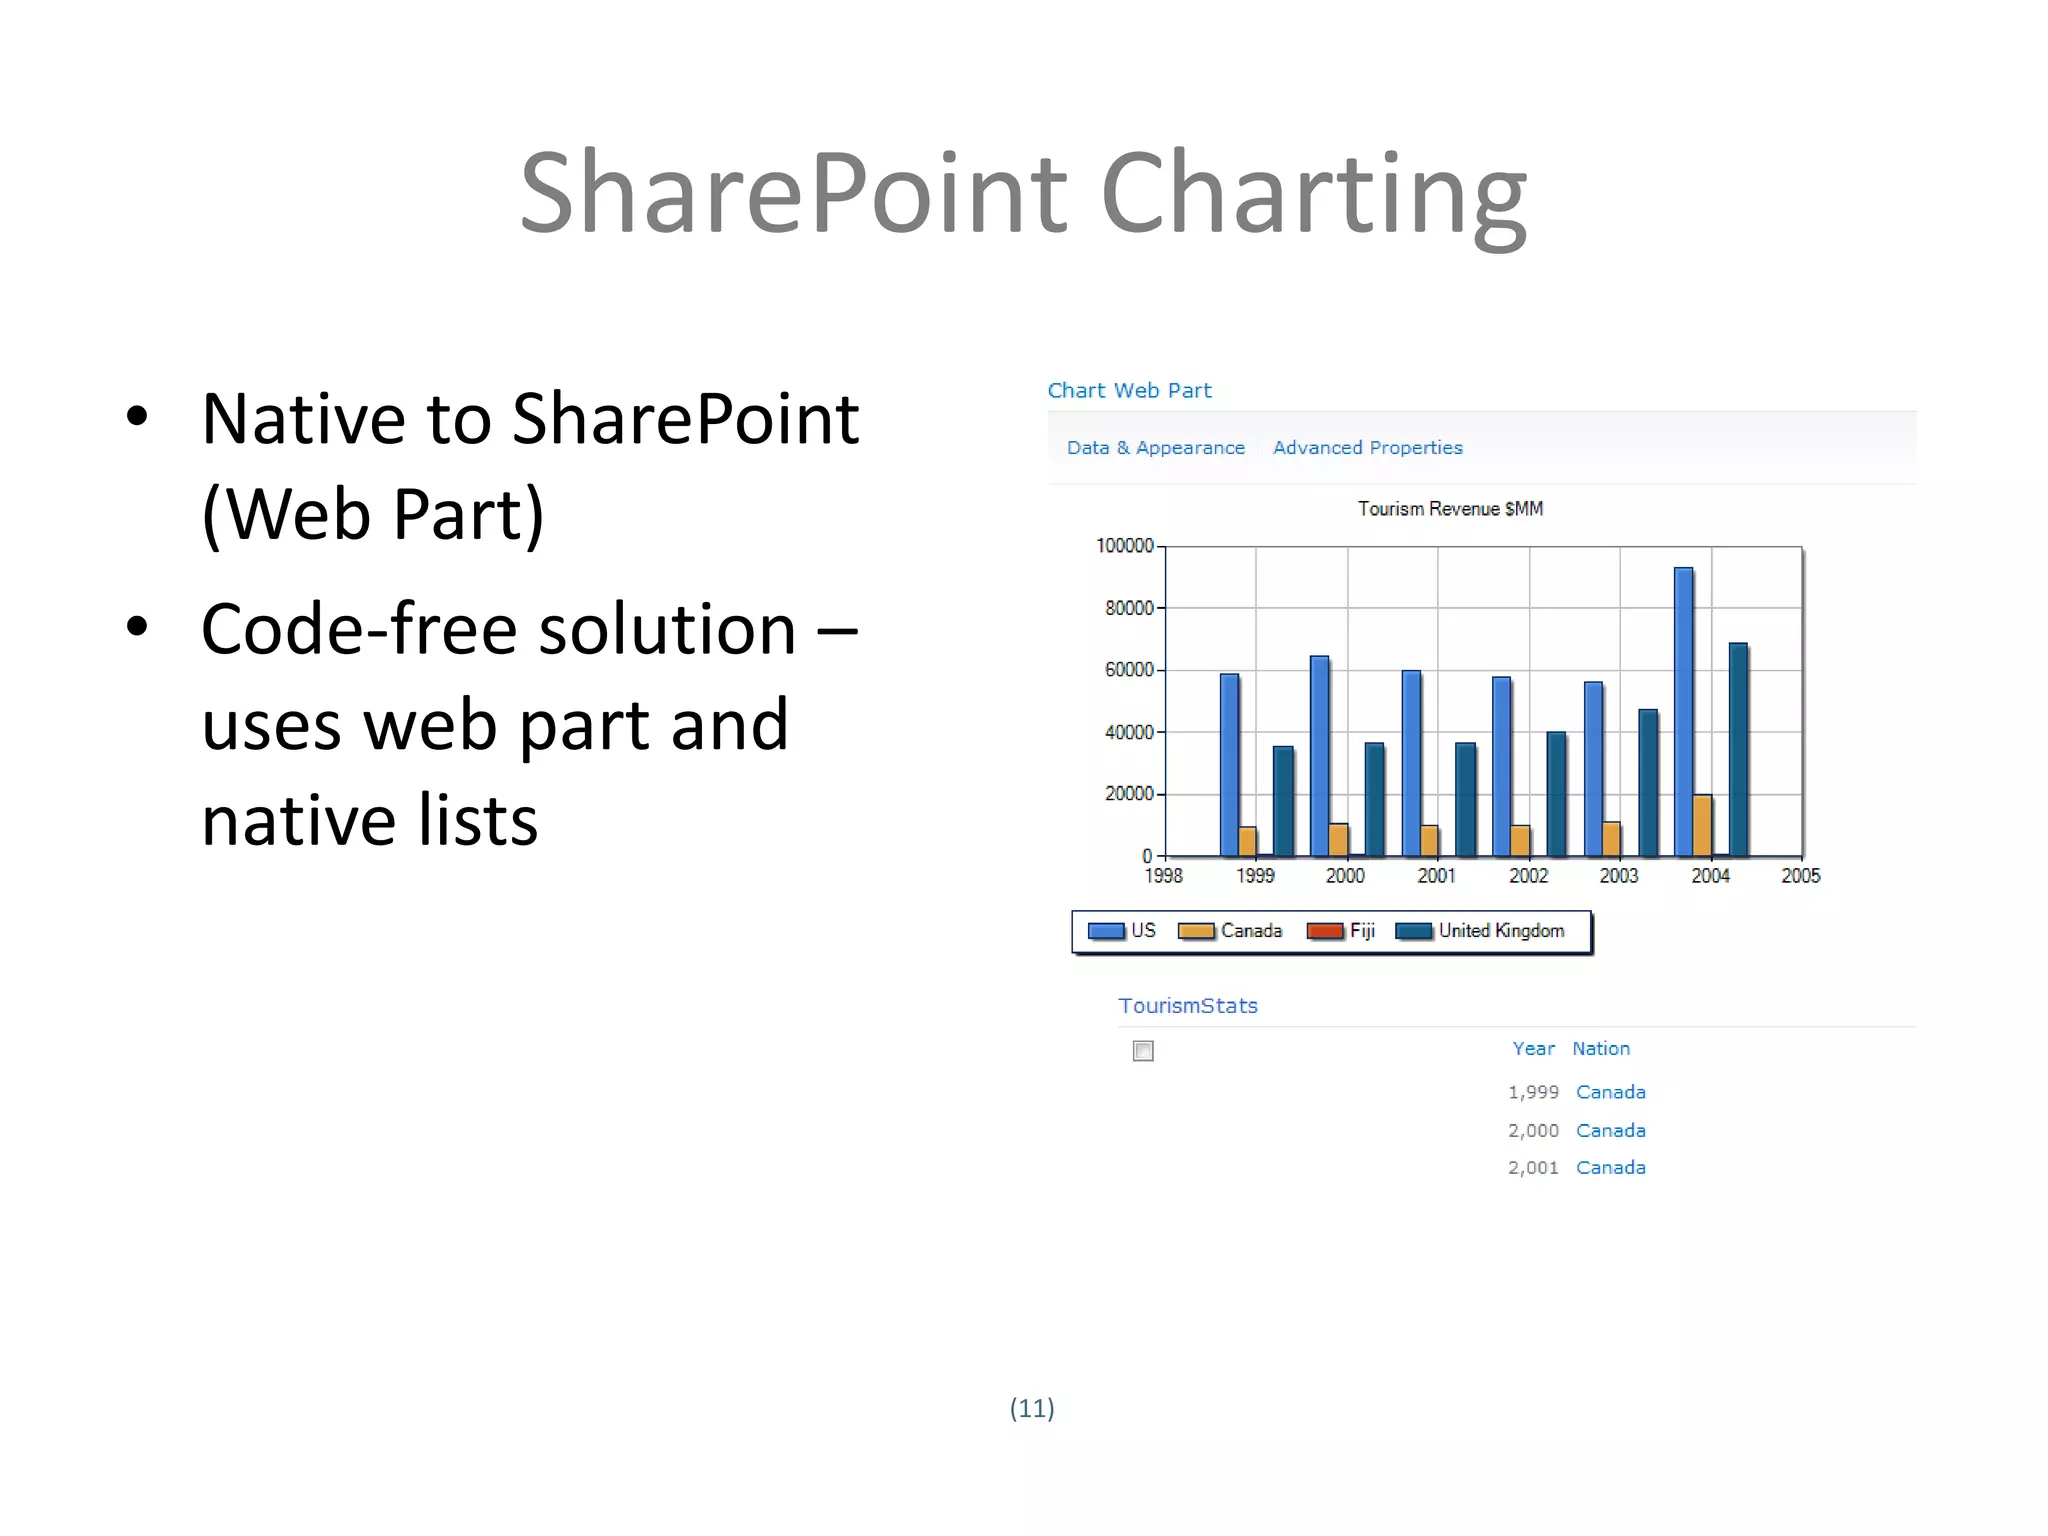
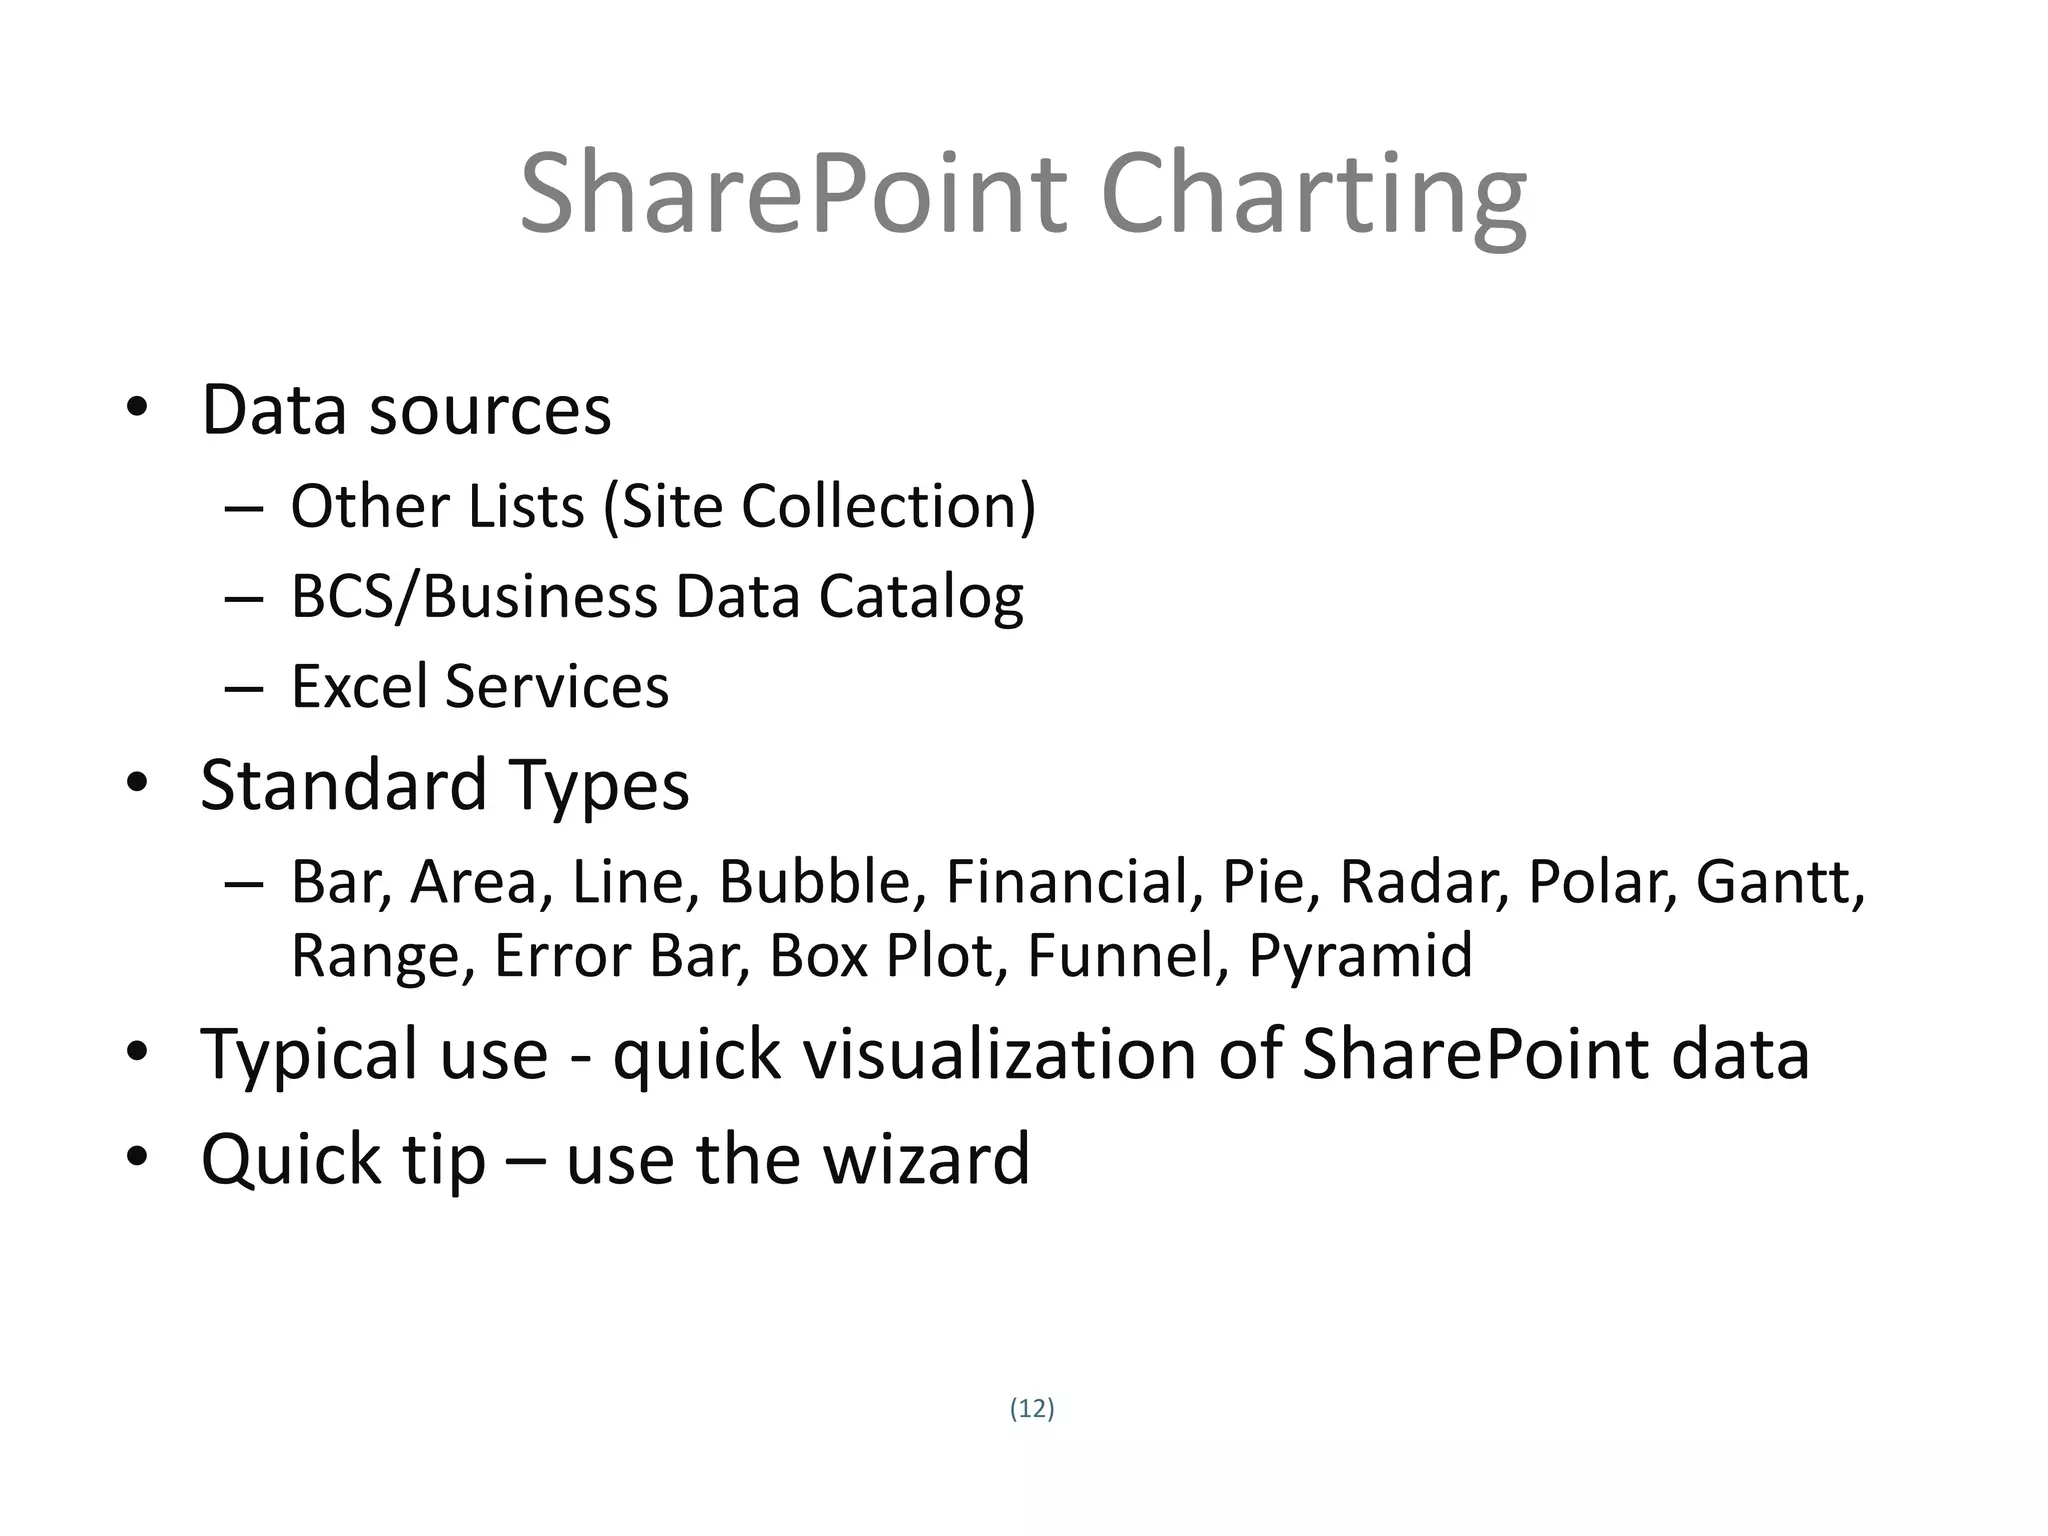
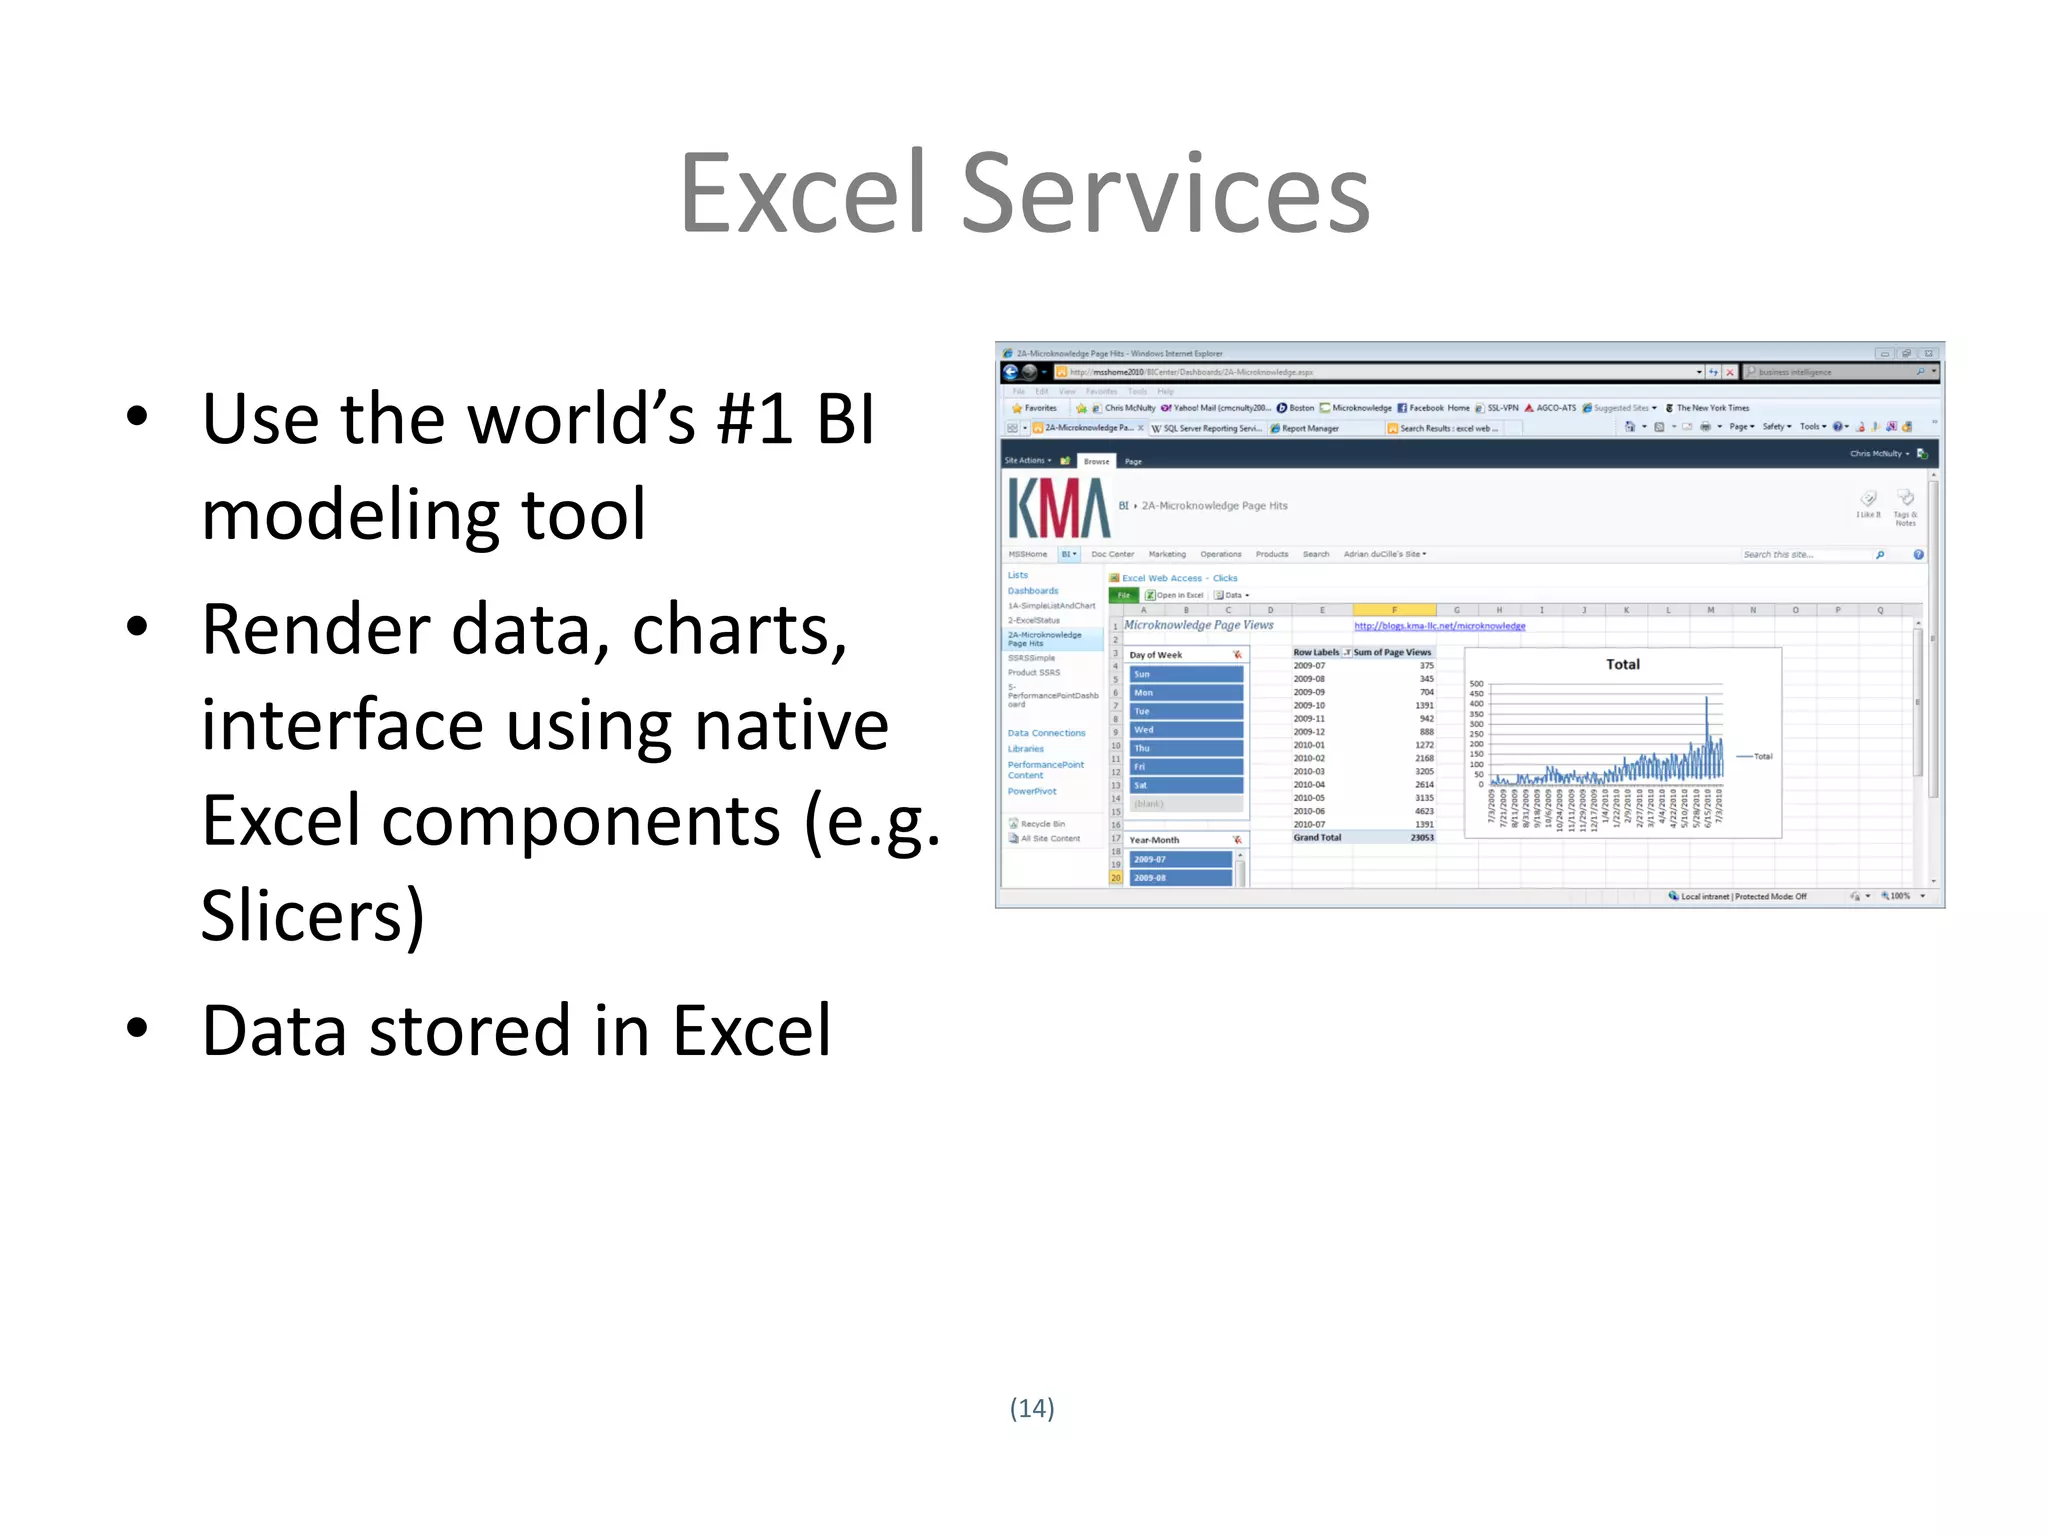
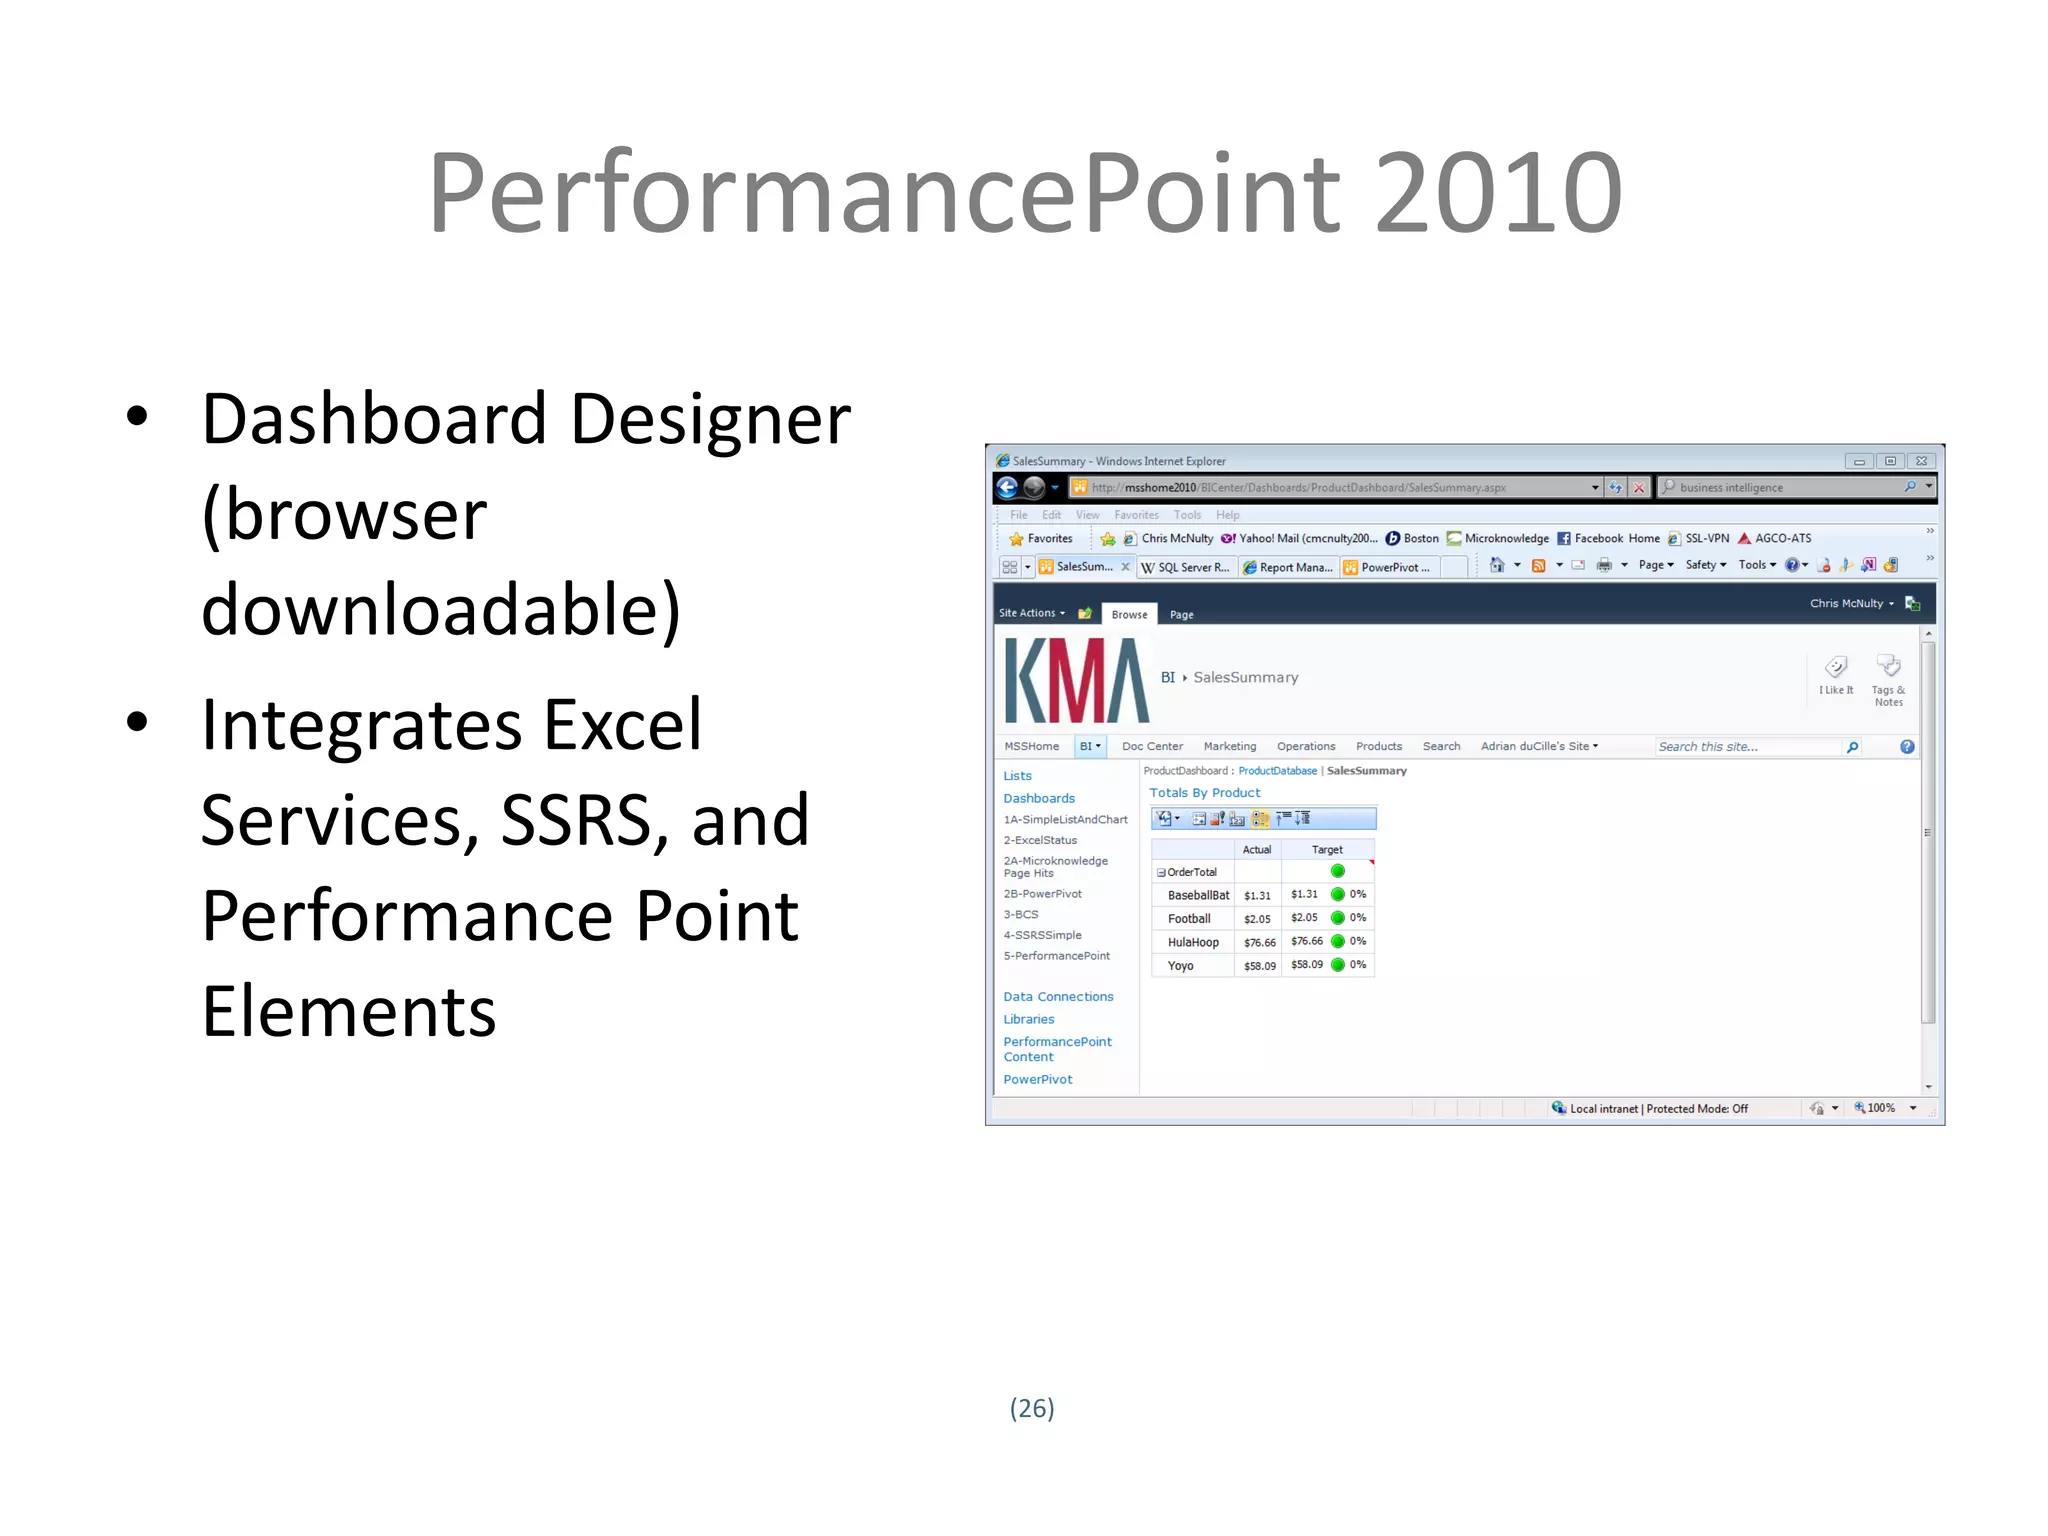
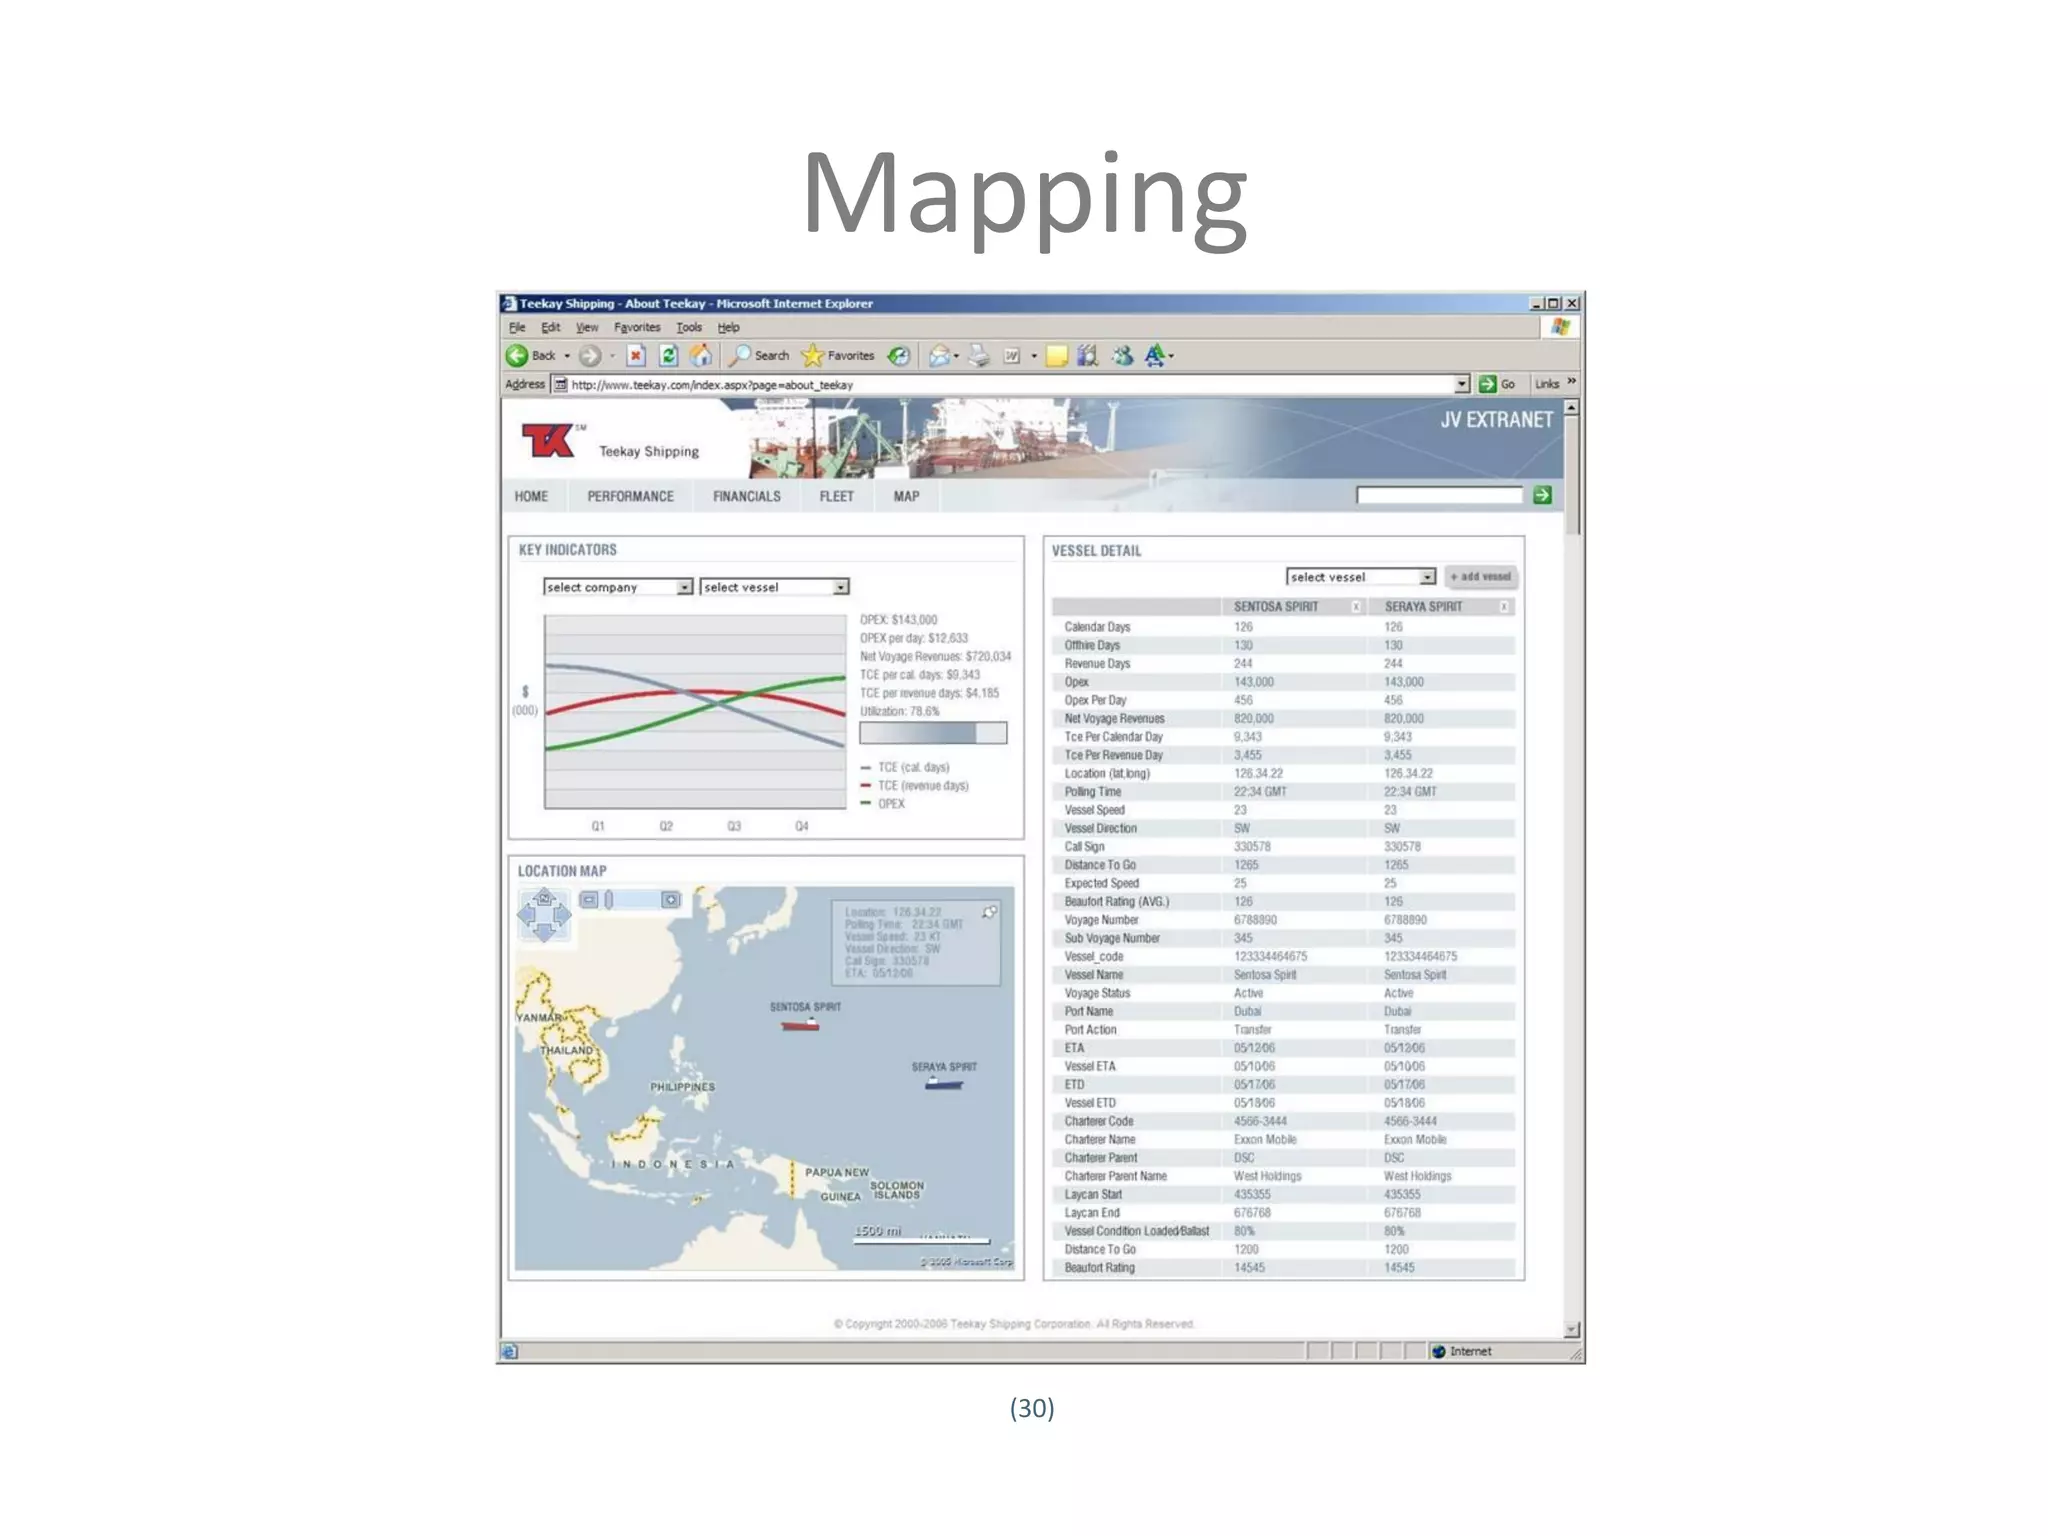
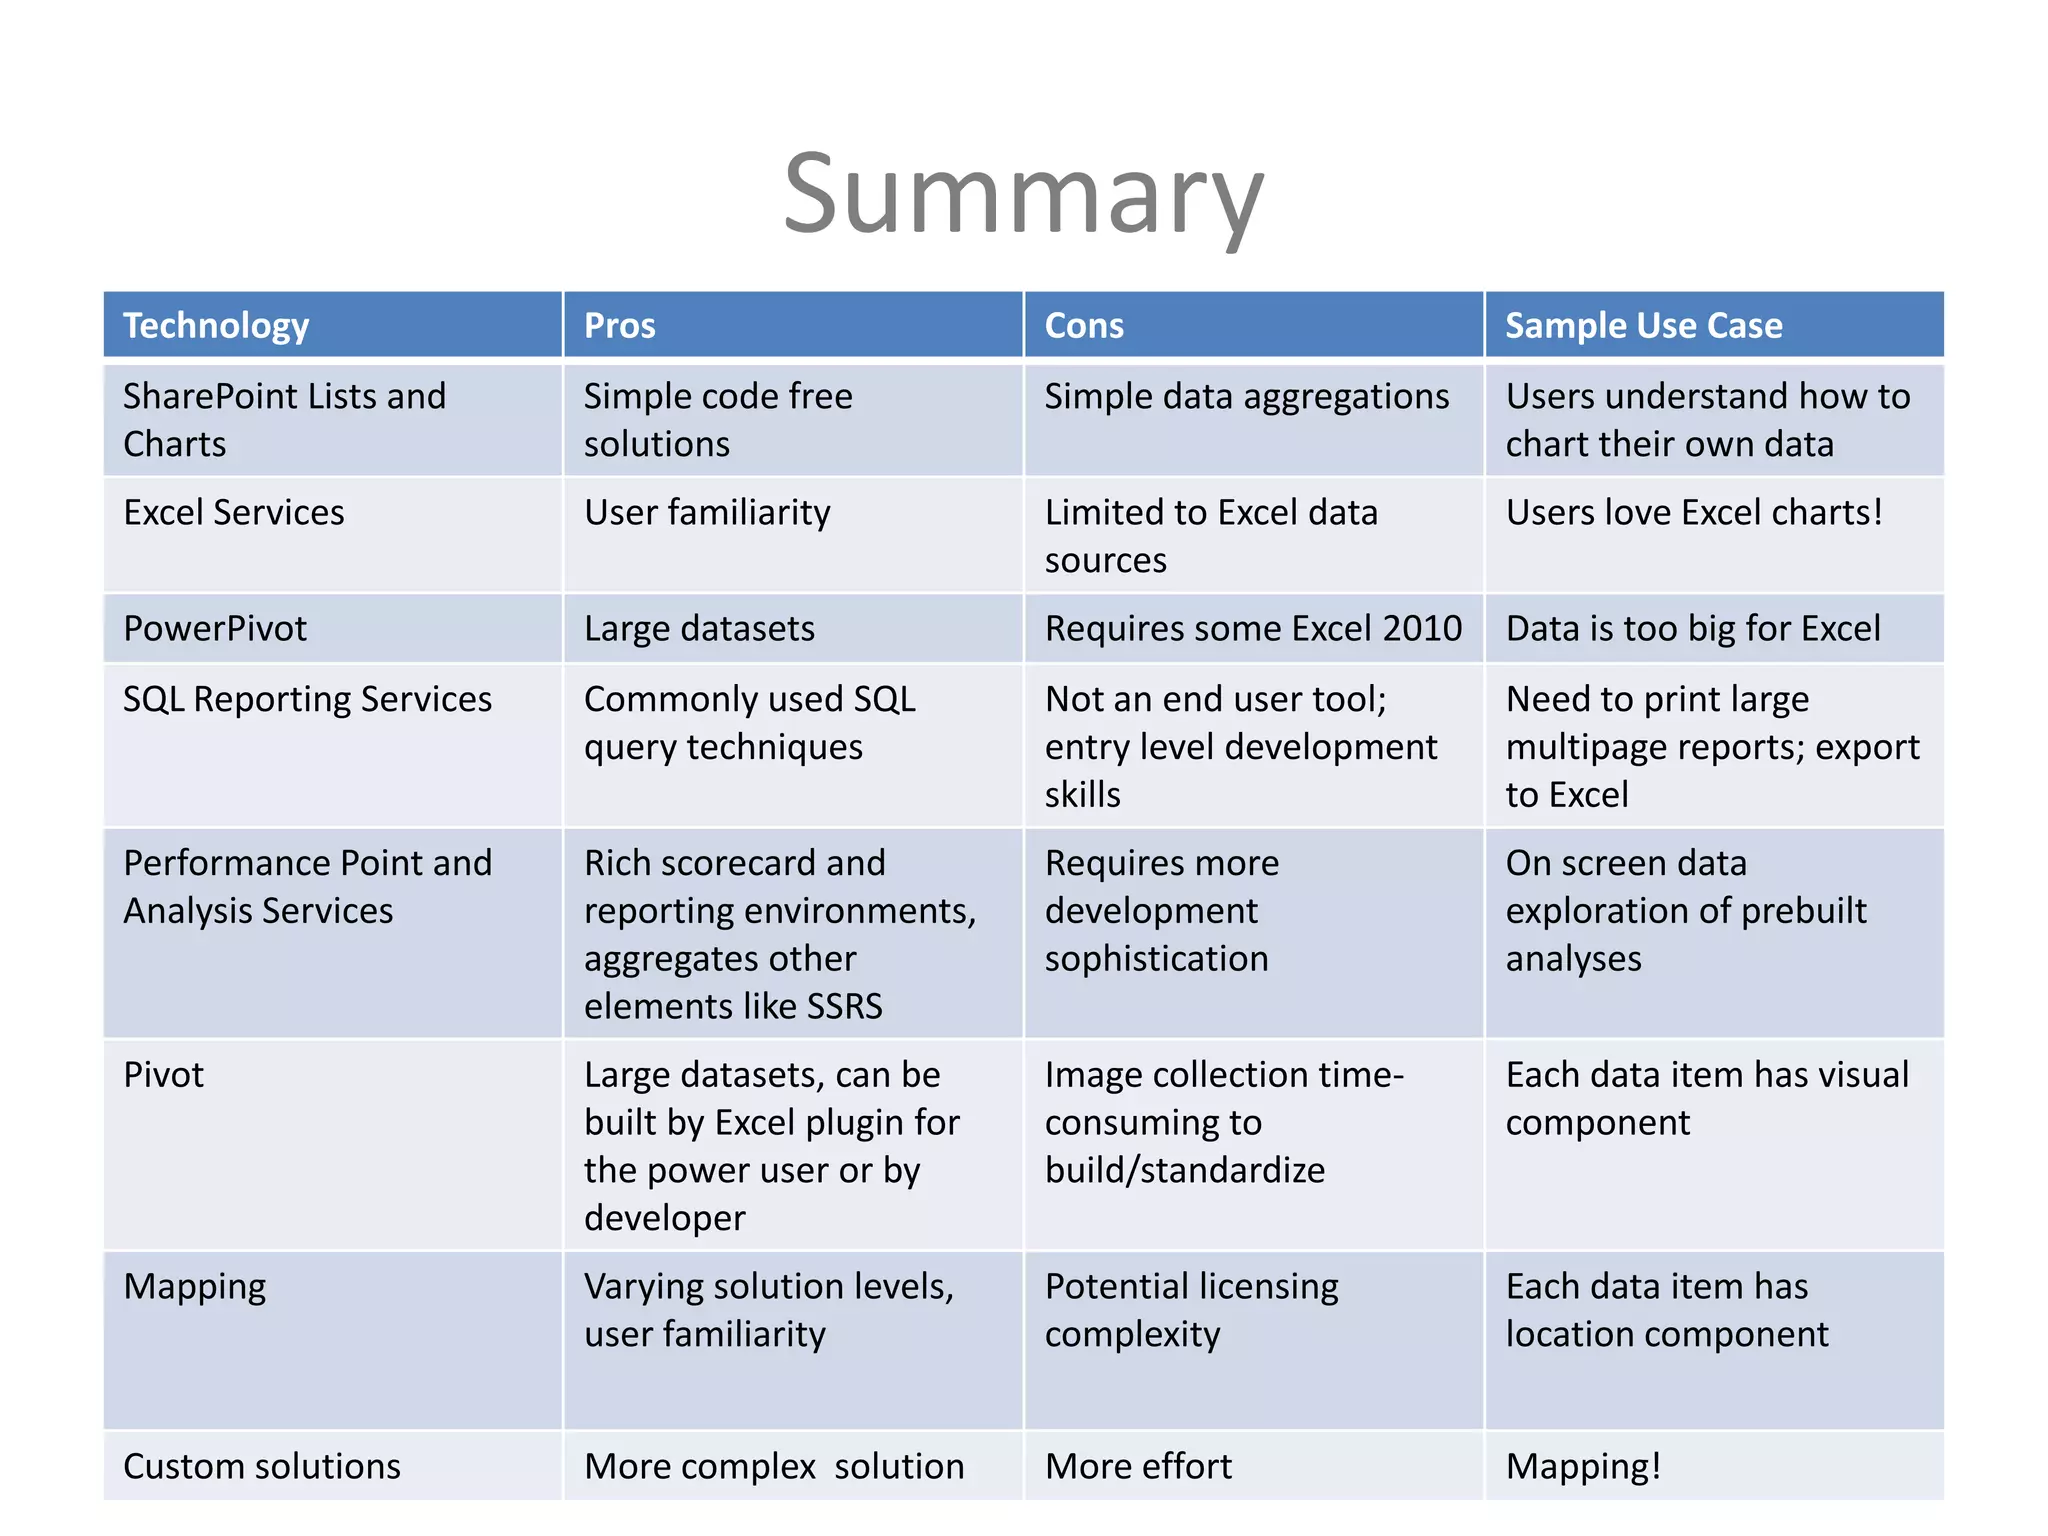
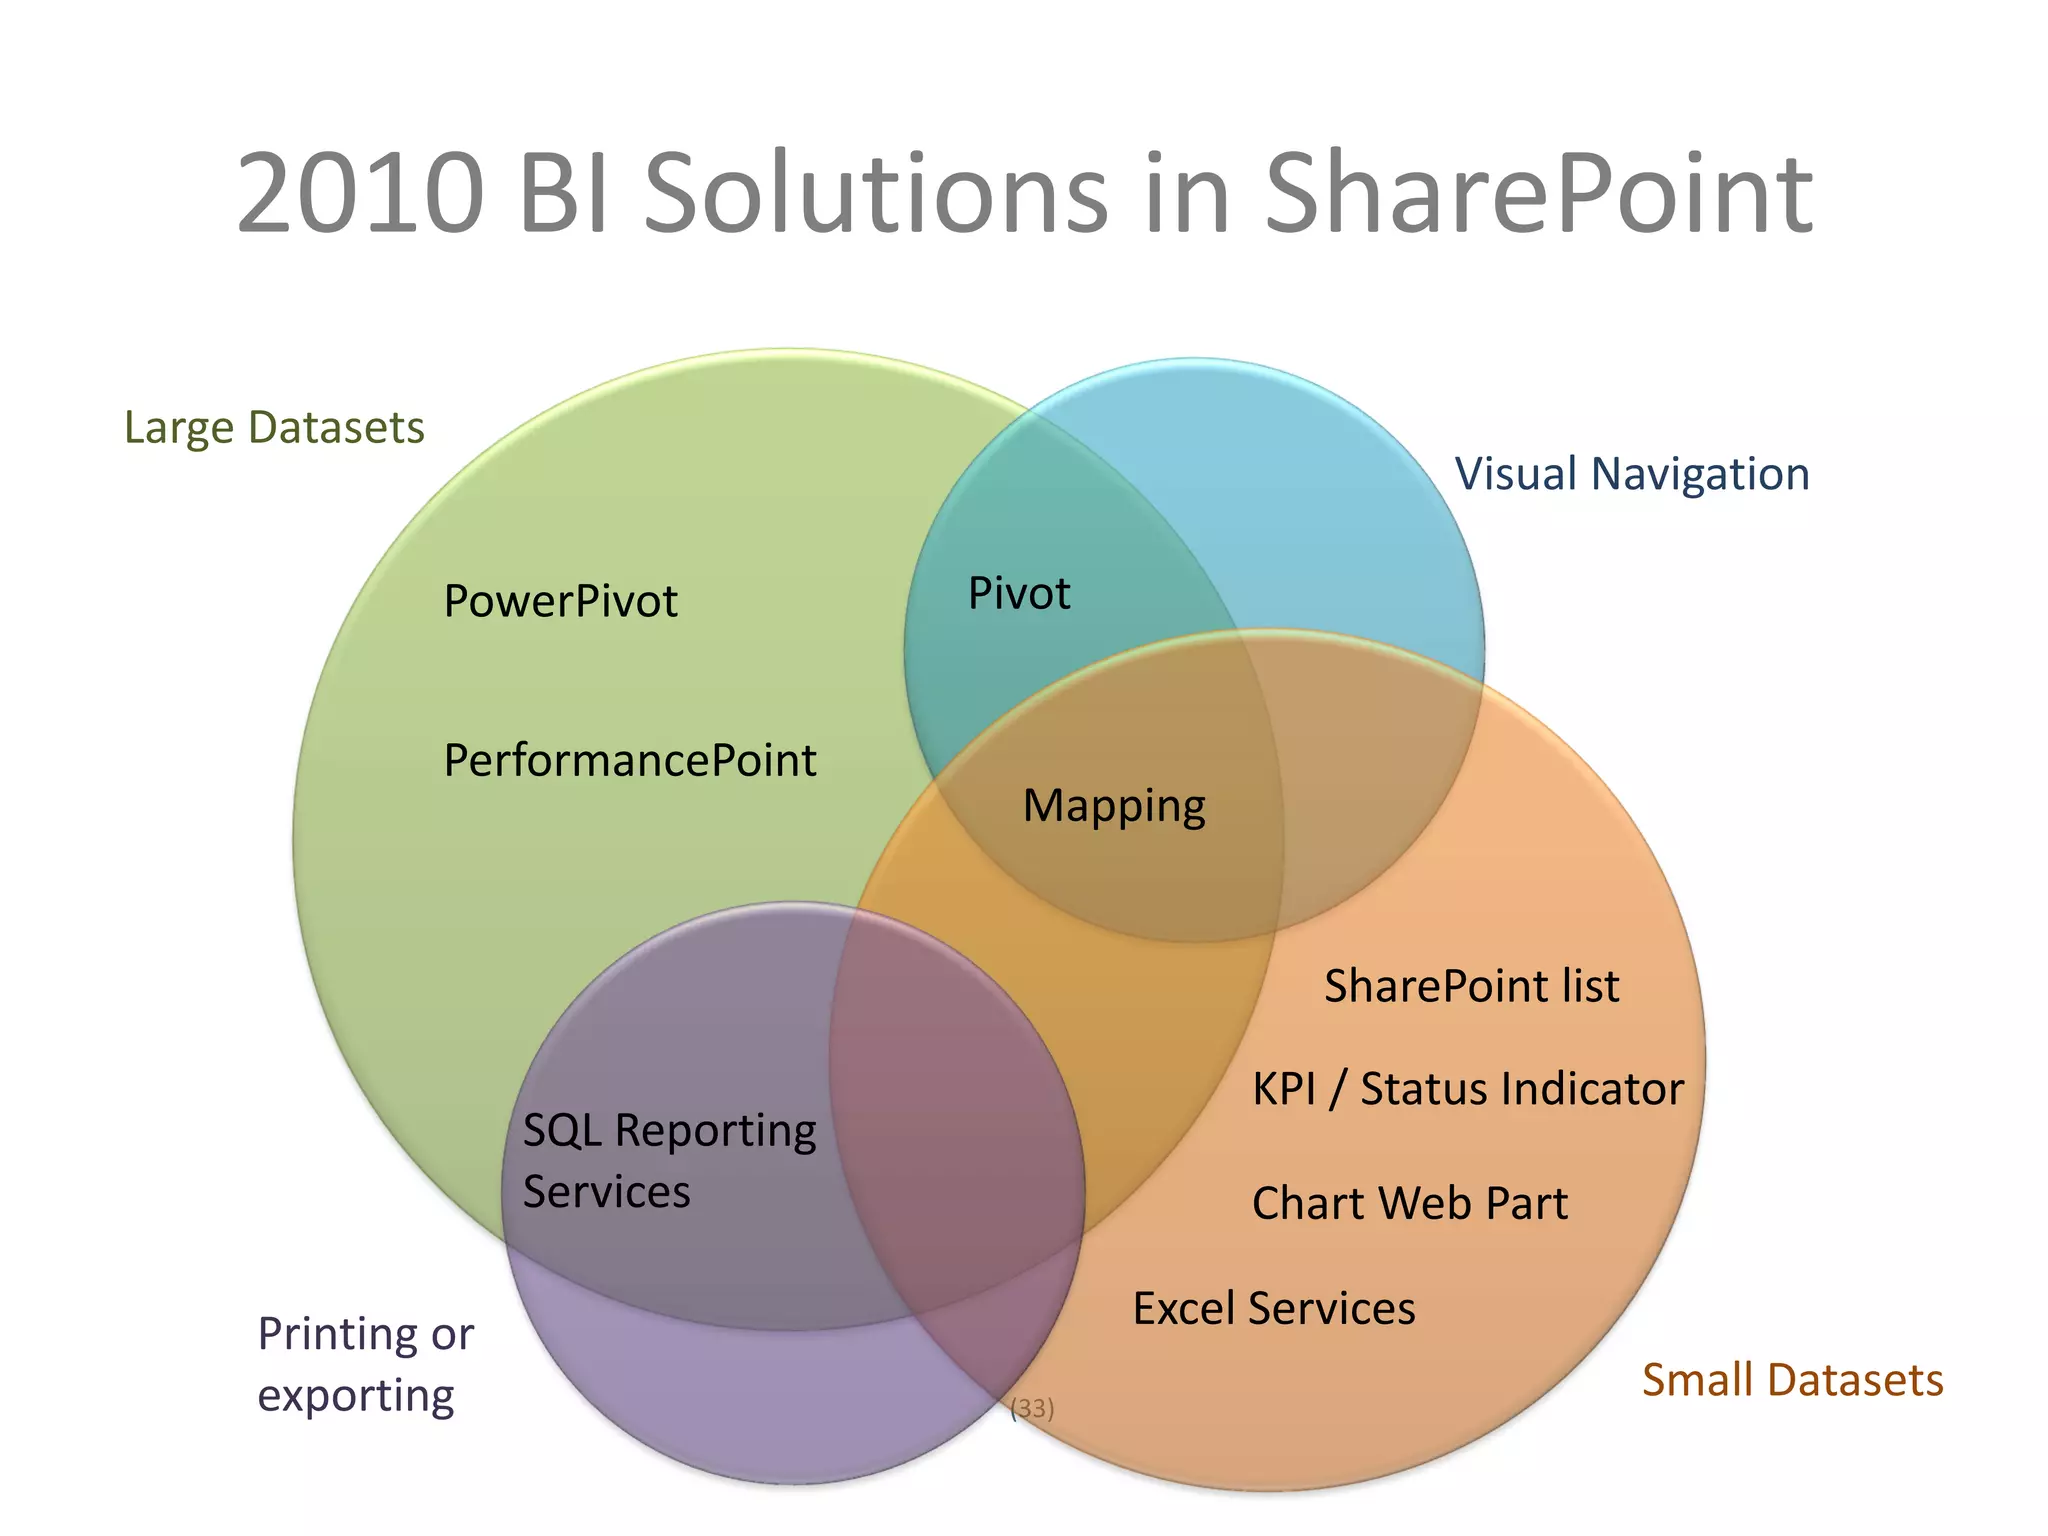
See Beyond the Numbers:
Data Visualization in SharePoint 2010
SharePoint Saturday Boston
September 2010
Chris McNulty, Sadie Van Buren
Chris McNulty
  • Working with SharePoint technologies since
    2000/2001
  • 20 years consulting and financial services
    technology (Santander, John Hancock, GMO,
    State Street)
  • Write and speak often on Microsoft
    information worker technologies (book out
    this month!)
  • Microsoft MCSE/MCTS/MSA/MVTS
  • BC MBA in Investment Management
  • Hiking, cooking, playing guitar, colonial history,
    photography
  • My family: Hayley, three kids (15, 6, 3) and my
    dog Stan


SharePoint Practice Lead, KMA
Sadie Van Buren
   • Project Manager and Business Analyst
     focusing on SharePoint
   • Working with SharePoint since beta
     2003 version
   • Over 40 SharePoint implementations
   • Microsoft Certified Technology
     Specialist


Consulting Manager, Burntsand
•      Full-service IT consulting firm                               • Leading systems integration firm
       established in 1995                                             founded in January 1996
•      28 employees: Partner, PM, Analyst,                           • More than 350 blue chip clients
       Developer, QA                                                 • Subsidiary of Open Text with local office
                                                                       in Waltham
•      Industry expertise and focus:
       Professional Services, Life Sciences &                        • Publicly traded on Toronto Stock
                                                                       Exchange (OTEX)
       Financial Services
                                                                     • Microsoft Gold Certified partner with six
•      Microsoft technology focus:                                     competencies
        •     Microsoft Certified Partner since 1995 /
                                                                     • Have delivered solutions built on the
              Microsoft Gold Certified Partner since
              2004
                                                                       SharePoint and .NET platforms since
                                                                       their inception in 2001
        • Working with SharePoint
                                                                     • Additional partnerships with Oracle,
          technologies since 2001
                                                                       EMC Documentum, SAP, and BMC
        • Specialties in                                               Software
                    Collaboration: Portals, Communities and
                     Content Management
                    Insight: Enterprise Search and Business
                     Intelligence
                    Productivity: Forms and Office Client     (4)
Twitter hashtag:
                     Customization, Mekko Graphics (ISV)
Agenda
• Goals, Terms & Surrounding Technology
• Complexity Levels of These Solutions
• Technology Overview and Demos
         –     Simple List and Chart
         –     Excel Services
         –     Power Pivot
         –     Pivot
         –     SQL Server Reporting Services (SSRS)
         –     Performance Point 2010
         –     Mapping
•      Summary
•      Resources
•      Question and Answer Period
•      Contact Information


                                                      (5)
Twitter hashtag:
Microsoft SharePoint Server 2010 … the bright frontier


                               Eastern Long Island, July 4, 2010
Complexity Levels of These Solutions
Cost


                     Time
                      (7)
Twitter hashtag:
Goals for BI Design
• Answering the known questions about our business

• Allowing users to self-discover patterns and answers
  to questions we haven’t yet been asked


                            (8)
Twitter hashtag:
Terms
• BCS – Business Connectivity Services
• SSRS – SQL Server Reporting Services
• Cube – a prebuilt matrix of data aggregations, hosted in
  SQL Server Analysis Services
• Project Dallas – Microsoft initiative to create publicly
  subscribed data services hosted on Azure and accessed
  via WCF, PowerPivot, etc.
  (http://www.sqlazureservices.com)
• Pivot - Interaction model that accommodates the
  complexity and scale of a massive collection of
  information

                             (9)
Twitter hashtag:
SharePoint BI Evolution


                                                                              Custom
                                                               Performance    Solutions
                                                               Point          • Mapping
                                             Enabling          • Dashboards   • Web Parts
                                             technologies      • Analysis     • Etc.

                                             • Business          Services
                              Excel            Connectivity
                              Services         Services
                              • Excel Web    • SQL Reporting
                                Access         Services
                   Chart                     • Pivot
                              • PowerPivot
                   Web Part                  • Dallas


                                                  (10)
Twitter hashtag:
SharePoint Charting
• Native to SharePoint
  (Web Part)
• Code-free solution –
  uses web part and
  native lists


                            (11)
Twitter hashtag:
SharePoint Charting
• Data sources
         – Other Lists (Site Collection)
         – BCS/Business Data Catalog
         – Excel Services
• Standard Types
         – Bar, Area, Line, Bubble, Financial, Pie, Radar, Polar, Gantt,
           Range, Error Bar, Box Plot, Funnel, Pyramid
• Typical use - quick visualization of SharePoint data
• Quick tip – use the wizard

                                       (12)
Twitter hashtag:
DEMO – Chart Web Part
Excel Services
• Use the world’s #1 BI
  modeling tool
• Render data, charts,
  interface using native
  Excel components (e.g.
  Slicers)
• Data stored in Excel


                           (14)
Twitter hashtag:
Excel Services
• Host a presentation layer using Excel Services
         – Closely related to Excel Web Access
• Use native SharePoint Status Indicators (KPIs)
         – Can also work with lists
• Render Excel 2010 functions (e.g. Slicers) without
  Excel 2010 on all clients
• Use when users are skilled in Excel modeling and
  charting and data lives in spreadsheets
• Quick tip: understand SSA’s

                                      (15)
Twitter hashtag:
PowerPivot
• “Project Gemini” – host
  1-10MM row datasets
• Excel and SharePoint
  components
• Data doesn’t live in
  spreadsheet
• Released with SQL Server
  2008 R2 but doesn’t
  explicitly require the R2
  Engine

                              (16)
Twitter hashtag:
PowerPivot
• Like Excel Web Access except underlying data can be sourced from:
         –     SQL, Analysis Services Cube, SSRS Report
         –     Access
         –     Power Pivot/Excel
         –     Data Feeds (XML, Atom, Azure, WCF OData, Dallas)
         –     Oracle, Teradata, Sybase, DB2
         –     ODBC
         –     Text files
• Excel optimized to handle data management and memory cache locally
• SharePoint builds cache and optimizes for server web access
• Use when Excel modeling skills are high but data is too large or too
  heterogeneous to keep in multiple Excel spreadsheets
• Quick tip: www.powerpivotgeeks.net


                                                 (17)
Twitter hashtag:
DEMO - PowerPivot
Pivot
• “Interact with massive amounts of data in ways
  that are powerful, informative, and fun”
• Interaction model that accommodates the
  complexity and scale of information rather than
  the traditional structure of the Web
• Create a “collection”- underlying schema is CXML
  or Collection XML.
• View in SharePoint via Silverlight viewer
• Complexity: Excel tool available
• Tip: http://getpivot.com
DEMO - Pivot
SQL Server Reporting Services (SSRS)
• “Code free” but
  requires development
  tools
• Designed using
  Business Intelligence
  Developer Studio
• Host in SQL Server or
  SharePoint


                          (23)
Twitter hashtag:
PerformancePoint 2010
• Dashboard Designer
  (browser
  downloadable)
• Integrates Excel
  Services, SSRS, and
  Performance Point
  Elements


                             (26)
Twitter hashtag:
PerformancePoint 2010
• Sophisticated self service modeling
• Decomposition Tree
• Ideal for SSAS but also work with standard data
  sources (lists, SQL)
• Requires true SQL development to build and
  maintain SSAS cubes for KPIs and scorecards


                             (27)
Twitter hashtag:
DEMO – PerformancePoint
Mapping
• IDC reports that nearly 80% of business data has a
  location component
• Make business tools as engaging as what’s on the
  web
• Use cases:
         –     Customer base / trade areas
         –     Routing and shipping
         –     Targeted marketing
         –     Supply chain & disruption resolution


                                        (29)
Twitter hashtag:
Mapping


                      (30)
Twitter hashtag:
DEMO - Mapping
Summary
Technology               Pros                           Cons                       Sample Use Case
SharePoint Lists and     Simple code free               Simple data aggregations   Users understand how to
Charts                   solutions                                                 chart their own data
Excel Services           User familiarity               Limited to Excel data      Users love Excel charts!
                                                        sources
PowerPivot               Large datasets                 Requires some Excel 2010   Data is too big for Excel
SQL Reporting Services   Commonly used SQL              Not an end user tool;      Need to print large
                         query techniques               entry level development    multipage reports; export
                                                        skills                     to Excel
Performance Point and    Rich scorecard and             Requires more              On screen data
Analysis Services        reporting environments,        development                exploration of prebuilt
                         aggregates other               sophistication             analyses
                         elements like SSRS
Pivot                    Large datasets, can be         Image collection time-     Each data item has visual
                         built by Excel plugin for      consuming to               component
                         the power user or by           build/standardize
                         developer
Mapping                  Varying solution levels,       Potential licensing        Each data item has
                         user familiarity               complexity                 location component
                                                     (32)
Twitter hashtag:
Custom solutions         More complex solution          More effort                Mapping!
2010 BI Solutions in SharePoint
Large Datasets
                                                                    Visual Navigation

                     PowerPivot           Pivot


                     PerformancePoint
                                             Mapping


                                                            SharePoint list

                                                        KPI / Status Indicator
                          SQL Reporting
                          Services                      Chart Web Part

            Printing or                            Excel Services
            exporting                       (33)
                                                                              Small Datasets
Twitter hashtag:
Resources - General
• From Microsoft:
         – Business Intelligence: http://www.microsoft.com/bi/
         – SharePoint 2010 site: http://sharepoint.microsoft.com
         – SharePoint Team Blog:
           http://blogs.msdn.com/sharepoint/default.aspx
         – BI Blog: http://blogs.msdn.com/b/bi/


                                    (34)
Twitter hashtag:
Resources: Mapping
• Bing Developer Center & Bing Maps Customer Gallery:
         – http://www.microsoft.com/maps/developers/
• Bing Maps Blog:
         – http://www.bing.com/community/blogs/maps/
• GIM International – online magazine of geomatics:
         – http://www.gim-international.com/index.php


                                  (35)
Twitter hashtag:
Resources: Pivot
• Microsoft Live Labs Pivot site
   – http://www.getpivot.com/
• Pivot Viewer control for Silverlight:
   – http://www.silverlight.net/learn/pivotviewer/
• Pivot Collection Gallery:
  http://www.getpivot.com/collections/
• Questions?
• Contact Us
• Ask the Experts
• Prizes!
Twitter hashtag:
                    (37)
Thank you…
Contact Chris:                               Contact Sadie:
    Email                                        Email
    cmcnulty@kma-llc.net                         svanburen@burntsand.com
    Blog                                         Blog
    http://blogs.kma-                            http://amatterofdegree.typepad.
    llc.net/microknowledge                       com/a_matter_of_degree/
    Twitter                                      Twitter
    http://twitter.com/cmcnulty2000              http://twitter.com/sadalit
    LinkedIn                                     LinkedIn
    http://www.linkedin.com/in/cmc               http://www.linkedin.com/in/sada
    nulty                                        lit


                                      (38)
Twitter hashtag:
SharePoint Saturday Boston
   Twitter: @SPSBoston | #SPSBos


                CORRIDOR

Business Intelligence Data Visualization from SharePoint Saturday Boston

  • 1.
    See Beyond theNumbers: Data Visualization in SharePoint 2010 SharePoint Saturday Boston September 2010 Chris McNulty, Sadie Van Buren
  • 2.
    Chris McNulty • Working with SharePoint technologies since 2000/2001 • 20 years consulting and financial services technology (Santander, John Hancock, GMO, State Street) • Write and speak often on Microsoft information worker technologies (book out this month!) • Microsoft MCSE/MCTS/MSA/MVTS • BC MBA in Investment Management • Hiking, cooking, playing guitar, colonial history, photography • My family: Hayley, three kids (15, 6, 3) and my dog Stan SharePoint Practice Lead, KMA
  • 3.
    Sadie Van Buren • Project Manager and Business Analyst focusing on SharePoint • Working with SharePoint since beta 2003 version • Over 40 SharePoint implementations • Microsoft Certified Technology Specialist Consulting Manager, Burntsand
  • 4.
    Full-service IT consulting firm • Leading systems integration firm established in 1995 founded in January 1996 • 28 employees: Partner, PM, Analyst, • More than 350 blue chip clients Developer, QA • Subsidiary of Open Text with local office in Waltham • Industry expertise and focus: Professional Services, Life Sciences & • Publicly traded on Toronto Stock Exchange (OTEX) Financial Services • Microsoft Gold Certified partner with six • Microsoft technology focus: competencies • Microsoft Certified Partner since 1995 / • Have delivered solutions built on the Microsoft Gold Certified Partner since 2004 SharePoint and .NET platforms since their inception in 2001 • Working with SharePoint • Additional partnerships with Oracle, technologies since 2001 EMC Documentum, SAP, and BMC • Specialties in Software  Collaboration: Portals, Communities and Content Management  Insight: Enterprise Search and Business Intelligence  Productivity: Forms and Office Client (4) Twitter hashtag: Customization, Mekko Graphics (ISV)
  • 5.
    Agenda • Goals, Terms& Surrounding Technology • Complexity Levels of These Solutions • Technology Overview and Demos – Simple List and Chart – Excel Services – Power Pivot – Pivot – SQL Server Reporting Services (SSRS) – Performance Point 2010 – Mapping • Summary • Resources • Question and Answer Period • Contact Information (5) Twitter hashtag:
  • 6.
    Microsoft SharePoint Server2010 … the bright frontier Eastern Long Island, July 4, 2010
  • 7.
    Complexity Levels ofThese Solutions Cost Time (7) Twitter hashtag:
  • 8.
    Goals for BIDesign • Answering the known questions about our business • Allowing users to self-discover patterns and answers to questions we haven’t yet been asked (8) Twitter hashtag:
  • 9.
    Terms • BCS –Business Connectivity Services • SSRS – SQL Server Reporting Services • Cube – a prebuilt matrix of data aggregations, hosted in SQL Server Analysis Services • Project Dallas – Microsoft initiative to create publicly subscribed data services hosted on Azure and accessed via WCF, PowerPivot, etc. (http://www.sqlazureservices.com) • Pivot - Interaction model that accommodates the complexity and scale of a massive collection of information (9) Twitter hashtag:
  • 10.
    SharePoint BI Evolution Custom Performance Solutions Point • Mapping Enabling • Dashboards • Web Parts technologies • Analysis • Etc. • Business Services Excel Connectivity Services Services • Excel Web • SQL Reporting Access Services Chart • Pivot • PowerPivot Web Part • Dallas (10) Twitter hashtag:
  • 11.
    SharePoint Charting • Nativeto SharePoint (Web Part) • Code-free solution – uses web part and native lists (11) Twitter hashtag:
  • 12.
    SharePoint Charting • Datasources – Other Lists (Site Collection) – BCS/Business Data Catalog – Excel Services • Standard Types – Bar, Area, Line, Bubble, Financial, Pie, Radar, Polar, Gantt, Range, Error Bar, Box Plot, Funnel, Pyramid • Typical use - quick visualization of SharePoint data • Quick tip – use the wizard (12) Twitter hashtag:
  • 13.
  • 14.
    Excel Services • Usethe world’s #1 BI modeling tool • Render data, charts, interface using native Excel components (e.g. Slicers) • Data stored in Excel (14) Twitter hashtag:
  • 15.
    Excel Services • Hosta presentation layer using Excel Services – Closely related to Excel Web Access • Use native SharePoint Status Indicators (KPIs) – Can also work with lists • Render Excel 2010 functions (e.g. Slicers) without Excel 2010 on all clients • Use when users are skilled in Excel modeling and charting and data lives in spreadsheets • Quick tip: understand SSA’s (15) Twitter hashtag:
  • 16.
    PowerPivot • “Project Gemini”– host 1-10MM row datasets • Excel and SharePoint components • Data doesn’t live in spreadsheet • Released with SQL Server 2008 R2 but doesn’t explicitly require the R2 Engine (16) Twitter hashtag:
  • 17.
    PowerPivot • Like ExcelWeb Access except underlying data can be sourced from: – SQL, Analysis Services Cube, SSRS Report – Access – Power Pivot/Excel – Data Feeds (XML, Atom, Azure, WCF OData, Dallas) – Oracle, Teradata, Sybase, DB2 – ODBC – Text files • Excel optimized to handle data management and memory cache locally • SharePoint builds cache and optimizes for server web access • Use when Excel modeling skills are high but data is too large or too heterogeneous to keep in multiple Excel spreadsheets • Quick tip: www.powerpivotgeeks.net (17) Twitter hashtag:
  • 18.
  • 19.
    Pivot • “Interact withmassive amounts of data in ways that are powerful, informative, and fun” • Interaction model that accommodates the complexity and scale of information rather than the traditional structure of the Web • Create a “collection”- underlying schema is CXML or Collection XML. • View in SharePoint via Silverlight viewer • Complexity: Excel tool available • Tip: http://getpivot.com
  • 20.
  • 21.
    SQL Server ReportingServices (SSRS) • “Code free” but requires development tools • Designed using Business Intelligence Developer Studio • Host in SQL Server or SharePoint (23) Twitter hashtag:
  • 22.
    PerformancePoint 2010 • DashboardDesigner (browser downloadable) • Integrates Excel Services, SSRS, and Performance Point Elements (26) Twitter hashtag:
  • 23.
    PerformancePoint 2010 • Sophisticatedself service modeling • Decomposition Tree • Ideal for SSAS but also work with standard data sources (lists, SQL) • Requires true SQL development to build and maintain SSAS cubes for KPIs and scorecards (27) Twitter hashtag:
  • 24.
  • 25.
    Mapping • IDC reportsthat nearly 80% of business data has a location component • Make business tools as engaging as what’s on the web • Use cases: – Customer base / trade areas – Routing and shipping – Targeted marketing – Supply chain & disruption resolution (29) Twitter hashtag:
  • 26.
    Mapping (30) Twitter hashtag:
  • 27.
  • 28.
    Summary Technology Pros Cons Sample Use Case SharePoint Lists and Simple code free Simple data aggregations Users understand how to Charts solutions chart their own data Excel Services User familiarity Limited to Excel data Users love Excel charts! sources PowerPivot Large datasets Requires some Excel 2010 Data is too big for Excel SQL Reporting Services Commonly used SQL Not an end user tool; Need to print large query techniques entry level development multipage reports; export skills to Excel Performance Point and Rich scorecard and Requires more On screen data Analysis Services reporting environments, development exploration of prebuilt aggregates other sophistication analyses elements like SSRS Pivot Large datasets, can be Image collection time- Each data item has visual built by Excel plugin for consuming to component the power user or by build/standardize developer Mapping Varying solution levels, Potential licensing Each data item has user familiarity complexity location component (32) Twitter hashtag: Custom solutions More complex solution More effort Mapping!
  • 29.
    2010 BI Solutionsin SharePoint Large Datasets Visual Navigation PowerPivot Pivot PerformancePoint Mapping SharePoint list KPI / Status Indicator SQL Reporting Services Chart Web Part Printing or Excel Services exporting (33) Small Datasets Twitter hashtag:
  • 30.
    Resources - General •From Microsoft: – Business Intelligence: http://www.microsoft.com/bi/ – SharePoint 2010 site: http://sharepoint.microsoft.com – SharePoint Team Blog: http://blogs.msdn.com/sharepoint/default.aspx – BI Blog: http://blogs.msdn.com/b/bi/ (34) Twitter hashtag:
  • 31.
    Resources: Mapping • BingDeveloper Center & Bing Maps Customer Gallery: – http://www.microsoft.com/maps/developers/ • Bing Maps Blog: – http://www.bing.com/community/blogs/maps/ • GIM International – online magazine of geomatics: – http://www.gim-international.com/index.php (35) Twitter hashtag:
  • 32.
    Resources: Pivot • MicrosoftLive Labs Pivot site – http://www.getpivot.com/ • Pivot Viewer control for Silverlight: – http://www.silverlight.net/learn/pivotviewer/ • Pivot Collection Gallery: http://www.getpivot.com/collections/
  • 33.
    • Questions? • ContactUs • Ask the Experts • Prizes! Twitter hashtag: (37)
  • 34.
    Thank you… Contact Chris: Contact Sadie: Email Email cmcnulty@kma-llc.net svanburen@burntsand.com Blog Blog http://blogs.kma- http://amatterofdegree.typepad. llc.net/microknowledge com/a_matter_of_degree/ Twitter Twitter http://twitter.com/cmcnulty2000 http://twitter.com/sadalit LinkedIn LinkedIn http://www.linkedin.com/in/cmc http://www.linkedin.com/in/sada nulty lit (38) Twitter hashtag:
  • 35.
    SharePoint Saturday Boston Twitter: @SPSBoston | #SPSBos CORRIDOR