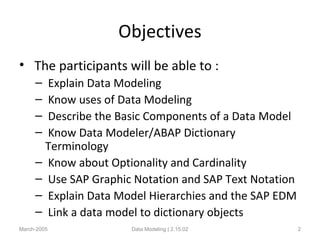
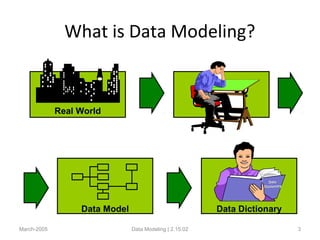
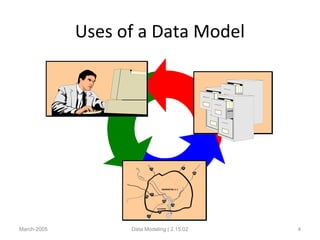
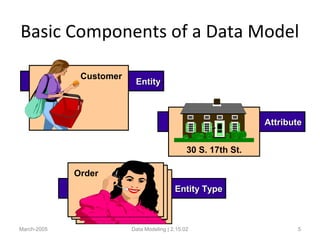
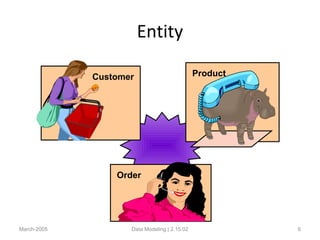
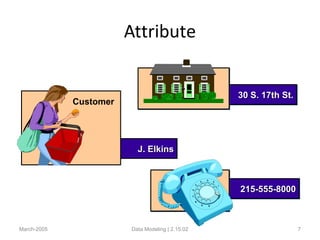
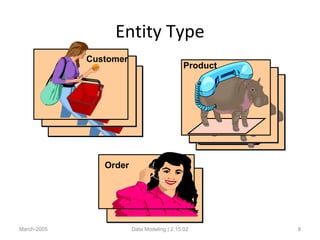
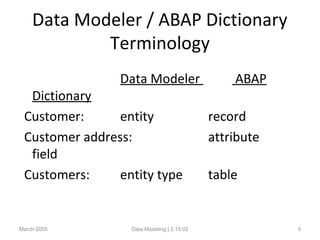
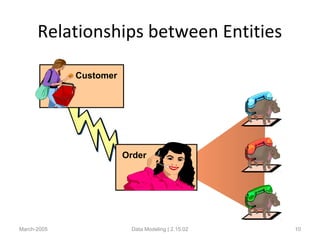
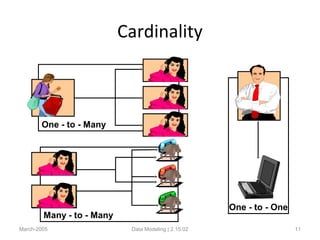
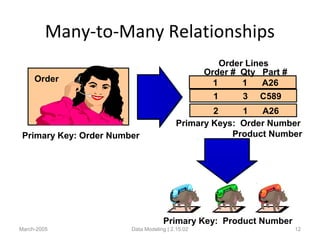
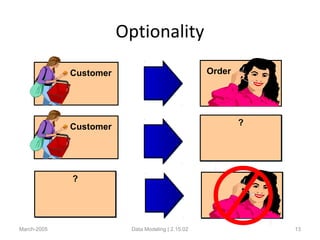
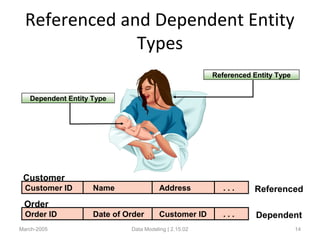
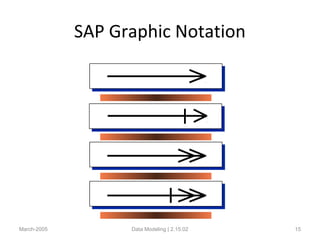
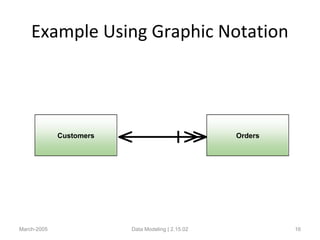
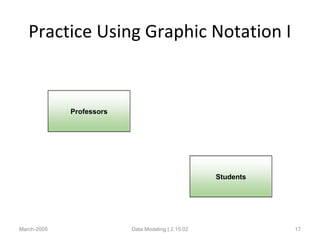
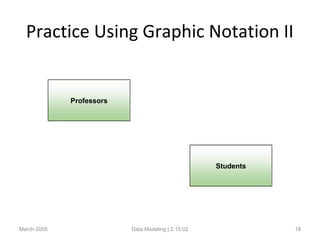
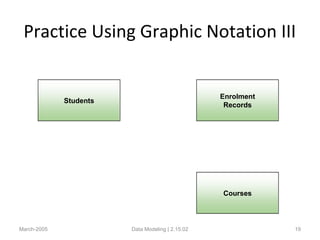
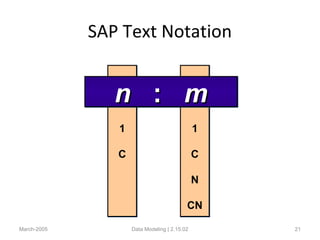
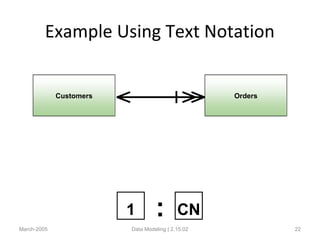
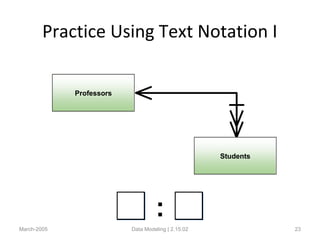
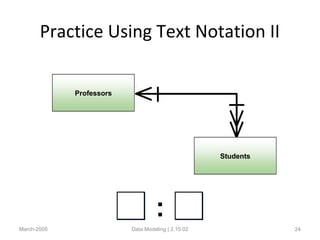
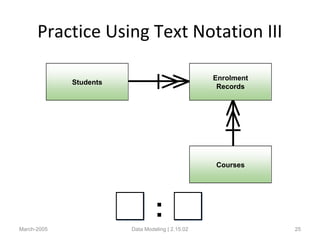
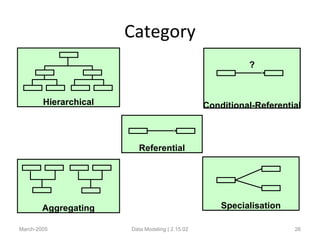
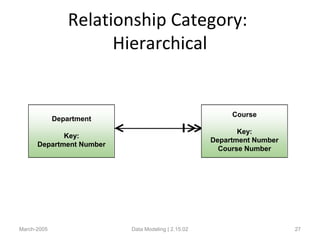
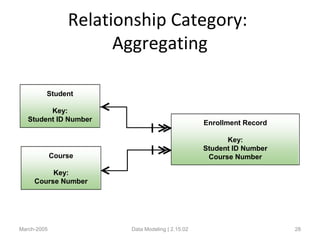
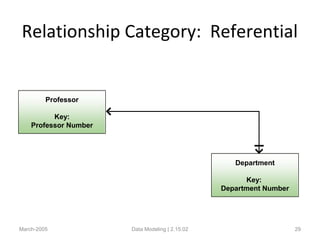
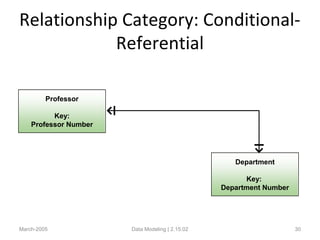
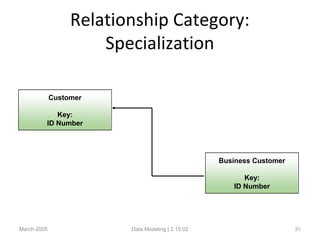
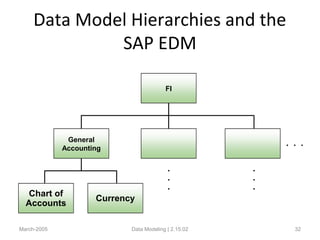
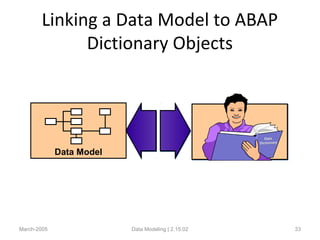
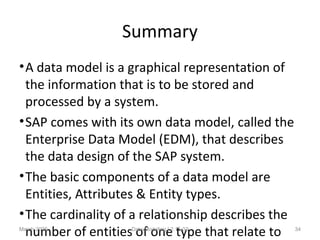
A data modeling training document outlines objectives like explaining data modeling, its uses, and components. Data modeling involves creating a graphical representation of information to be stored in a system. It has basic components like entities, attributes, and entity types. Relationships between entities have cardinality, and SAP comes with its own data model called the Enterprise Data Model.
This document discusses different types of views in ABAP dictionary objects. It defines a view as a way to look into one or more tables without containing its own data. It describes database views as the only type physically created at the database level, projection views as logical views that exist within the ABAP dictionary, and help and maintenance views as having specialized purposes for selection methods and permitting base table maintenance. The key relational operations of projection, selection, and join used to define view behavior are also explained.
The document discusses how to create database views with different steps: selecting the view type, defining primary and secondary tables and their relationship, defining view fields from those tables, setting selection criteria to filter records, and defining the view's maintenance status. Views allow efficiently extracting data from a database by defining fields, tables, and filtering criteria.
Structures allow users to group related fields together logically. Substructures let users include fields from other tables or structures. Customizing includes provided by SAP add fields to SAP tables without modifying the original tables, while append structures add extra fields to SAP structures or transparent tables not included previously.
This document discusses foreign key relationships in SAP. It defines a foreign key as a field that represents the primary key of another table, in order to link tables together and maintain data integrity. It explains that foreign keys allow creating aggregate objects and provide help texts. It also covers the prerequisites for defining foreign keys, key terminology, establishing relationships in ABAP Dictionary, field assignment types like partial and constant, and demonstrates creating a payroll table with a foreign key to the employee table.
Search helps are dictionary objects that compile valid values for users. An elementary search help is a single field combination, while a collective search help combines elementary search helps. When the user hits F4, the system checks assigned search helps and displays the appropriate list.
Chapter 04 abap dictionary tables in relational databases1Kranthi Kumar
This document discusses different types of tables in the SAP ABAP Dictionary, including transparent tables, structures, pool tables, cluster tables, and views. It describes technical settings that can optimize storage requirements and table access behavior, such as data class, size category, and buffering type. Indexes are also covered, and it is explained that unique index scans are generally faster than index range scans or full table scans when retrieving data.
Chapter 10 online help & documentation1Kranthi Kumar
This document discusses online help and documentation functions in SAP. It describes how to create and view documentation for data elements, including data element documentation displayed for all related fields when F1 is pressed and optional supplemental documentation specific to each screen. It also mentions documenting tables, structures and domains, and storing data element supplements and their references in table THLPF.
This document discusses ABAP dictionary objects. It covers accessing the ABAP dictionary using transaction code SE11, the basic objects of tables, data elements, and domains. It provides instructions on defining and creating these objects, including defining domains with value tables to provide validation for fields.
Foreign keys maintain relationships between tables in a database. They enforce referential integrity and help define relationships like one-to-many and many-to-many. Creating a foreign key requires the related fields in both tables to have matching data types and the referenced table's field to be a primary key. Multiple fields can also be used to define foreign keys between tables.
Chapter 01 overview of abap dictionary1Kranthi Kumar
The document defines the ABAP Dictionary as SAP's centralized data dictionary that enforces data integrity, avoids redundant data definitions, and integrates with the ABAP Workbench. It describes the ABAP Dictionary's main functions and objects, including tables, data elements, and domains, and explains that the database utility interfaces the dictionary with the underlying database.
Chapter 06 abap repository information system1Kranthi Kumar
The document discusses the ABAP Repository Information System, which allows users to search for ABAP development objects. It describes the Find and Where-Used functions that allow searching for objects by type and attributes or finding all objects that use a specific object. The Repository Information System is demonstrated by searching for tables that use a standard SAP field using the Where-Used functionality.
The document discusses changes to the ABAP dictionary in March 2005. It explains that objects must be activated in the SAP system to be used by other objects, and that activating an object releases any locks on it. It describes how SAP handles version management, maintaining both active and historical versions of objects. It also notes that changing a value table's primary key linked to a domain requires extensive changes due to embedded links between the domain and table.
This document discusses how to create and use a table maintenance generator in SAP. It explains that the table maintenance generator allows users to maintain tables through transaction SM30. The generator requires specifying an authorization group, function group, and maintenance screen number. It then generates an overview screen to display and edit all records in the specified table. The document demonstrates creating a table maintenance generator and has questions about the creation process and the transaction used for table maintenance.
The document summarizes a database created by Maritsa Lynet Trompa for Mr. Funny's Toy Store to store information about stock ordered in December 2011 and suppliers. The database contains two tables: Stock December 2011 and Suppliers. Four queries, one form, and four reports were generated using these tables. The form and reports include an image of a jack-in-the-box. Improvements suggested for the database include additional tables and forms.
This document discusses views in ABAP dictionary objects. Views allow querying one or more tables without containing data themselves. The main types are discussed as database views, projection views, help views, and maintenance views. Database views physically exist at the database level while projection views are logical views within the ABAP dictionary. Views can perform selection, projection, and join operations on related tables and are referenced similarly to tables within ABAP programs.
This document discusses the author's experience with various Microsoft business intelligence technologies including SQL Server, SQL Server Integration Services, SQL Server Analysis Services, SQL Server Reporting Services, and PerformancePoint Server. It provides examples of how the author has used these technologies to build data models, extract and transform data, create cubes and dimensions, develop reports, and design dashboards. Screenshots are included of two dashboards built in PerformancePoint Server and deployed to SharePoint.
This document discusses presenting query results from multiple database tables in an ASP.NET MVC application. It describes creating 3 tables in a SQL Server database to store student, course, and registration data. The controller uses LINQ to join the tables and format the results. The view displays the query results, presenting the data from the joined tables in an HTML list on the index page.
This research report document provides guidelines for formatting a research report, including defining what a research report is, how to create a title page in Microsoft Word, and the appropriate formatting for sections like the title, header, body, citations, bibliography, and sources. Key components that must be included are a title page with the report title, author's name, teacher/professor, and date, as well as a header on each page with the author's last name and page number. The body contains the paragraphs and any parenthetical citations, while the bibliography is an alphabetical listing of all sources cited.
This document provides an overview of measures in Power BI Desktop and includes a tutorial for creating basic measures. It discusses automatic measures, creating measures using DAX functions, and common measure examples like sums, averages, and counts. The tutorial guides the reader through understanding measures and creating their own basic measures in the Power BI Desktop model.
This document provides an overview of SAP S/4HANA Finance (formerly known as SAP SFIN). It discusses the key changes and improvements in SAP S/4HANA Finance compared to traditional SAP ERP Financial Accounting and Controlling modules, including the use of a single Universal Journal table to store financial and controlling documents, elimination of redundant tables, impact on configurations, and new capabilities like business cockpits. The document is divided into topics that cover the renovation of SAP, technical changes, eliminated tables, impact on configurations and functions, and advantages of SAP S/4HANA Finance.
This document contains a portfolio of business intelligence projects completed by Hong-Bing Li using Microsoft's BI product stack. It includes examples of SQL Server Integration Services (SSIS) packages to perform ETL, SQL programming, SQL Server Reporting Services (SSRS) reports including dashboards, SQL Server Analysis Services (SSAS) cubes, and MDX queries. The portfolio demonstrates skills in data integration, reporting, analytics, and dashboard development with a focus on Microsoft tools.
This portfolio showcases skills in Microsoft Business Intelligence, including SQL Server Integration Services (SSIS), Analysis Services (SSAS), and Reporting Services (SSRS). The document outlines projects involving:
1) Designing an ETL process in SSIS to load data from various sources into a SQL database.
2) Building a data warehouse cube in SSAS with dimensions, measures, and KPIs.
3) Creating SSRS reports including a sales scorecard, maps, and matrices and displaying them on a PerformancePoint dashboard in SharePoint.
This document summarizes Hong-Bing Li's portfolio of business intelligence projects using Microsoft BI tools. It includes 3 SQL Server Reporting Services reports, 8 dashboards in SharePoint including scorecards and KPIs, 18 examples of SQL programming, and 25 SQL Server Integration Services packages for data integration. The document provides detailed descriptions and screenshots of sample reports, dashboards, SQL code, and SSIS packages developed by the author.
6 reasons to use the query functionality in SAP R/3 or SAP:
1. It is delivered with SAP
2. It is available across all modules
3. It is easy to teach users to write their own reports
4. It requires minimal configuration
5. Security is built-in — no hard-coding
6. No ABAP programming skills required
Pentaho reporting is an open source collection of projects focused on creating, generating, and distributing report content from all data sources. It includes a reporting engine, report designer, Pentaho BI server, and client tools. Pentaho reporting allows for pixel-perfect report creation using the report designer, complex scheduling, and the ability to email published reports. It also features a metadata editor, design studio, and administration console to manage reports.
The document describes the functionality and purpose of the SAP ABAP Data Dictionary. The Data Dictionary provides a platform-independent interface to database metadata. It facilitates development by eliminating the need for programmers to manage specific database details. The Data Dictionary contains objects like domains, data elements, tables and their relationships which are used to develop and maintain ABAP applications.
The document discusses internal tables in ABAP/4, including defining, processing, accessing, and initializing internal tables. Internal tables are structured data types that allow programs to reorganize and perform calculations on database table contents. They exist only during program runtime and cannot be accessed outside the program environment. Lines are accessed individually using a work area interface. There are two types - with or without a header line. Internal tables are created by defining a table type and object, or referring to an existing structure. They are filled using statements like APPEND, COLLECT, INSERT, and copying from database tables. Lines are read using LOOP or READ and modified using MODIFY. DELETE removes lines individually or by condition. SORT orders the
The document provides an overview of Application Link Enabling (ALE) and Electronic Data Interchange (EDI) in SAP. It describes what ALE and EDI are, the components and basic concepts of ALE like IDocs, and how outbound and inbound processes work in ALE. It also discusses topics like configuration requirements, monitoring IDocs, and questions about ALE.
This document introduces ABAP programming concepts for reading database tables using SELECT statements in Open SQL. It discusses using SELECT to retrieve single records or multiple rows of data, filtering data with WHERE clauses, sorting results with ORDER BY, and working with system variables. Formal documentation methods are also introduced.
The document discusses cardinality in foreign key relationships and different foreign key field types. It defines cardinality and describes one-to-one, one-to-many, and many-to-many relationships. The document notes that when creating foreign keys, the cardinality of the relationship should be specified and whether the foreign key fields belong to the primary key of the other table. Examples of different foreign key field types are provided.
The document provides an overview of debugging in ABAP, including defining debugging, branching to debugging mode, key concepts such as breakpoints and watchpoints, examining and changing variables, and viewing contents of internal tables. It describes debugging modes, the debugging display, and the most important debugging functions such as single step, continue, breakpoint, watchpoint, and hexadecimal display. It also discusses setting breakpoints and watchpoints and using the ABAP debugger.
1) Cross-application integration in SAP systems allows exchange of data between different systems using ALE (Application Link Enabling) and IDOCs (Intermediate Documents).
2) IDOCs are used to carry data between systems and have control, data, and status records.
3) Setting up communication between systems involves defining logical systems, assigning clients, and maintaining RFC destinations.
The document provides information about Business Application Programming Interfaces (BAPIs) in SAP systems. It describes that BAPIs provide precise access to processes and data in SAP applications. It lists benefits of BAPIs such as being usable in different languages and platforms with reduced development and maintenance costs. It also provides steps to create and implement a BAPI, including defining structures, writing a function module, generating an API method, and configuring Apache Tomcat.
This document discusses ABAP modularization, subroutines, function modules, and the CATCH statement in ABAP. It provides examples of:
- Calling internal and external subroutines
- Passing parameters by value, reference, and value/result
- Creating and calling function modules
- Handling exceptions using the CATCH statement
The document provides an overview of Chapter 3 from an ABAP course. It discusses basic ABAP concepts like data types, data declaration, important instructions, control structures, and local modularization. It describes the different data types in ABAP including predefined and user-defined types. It also explains how to declare data, define own data types, and use structures like SYST. Selection screens, loops, branching, includes, and FORMs for modularization are also summarized.
- The document discusses controlling the flow of ABAP/4 programs using control statements like IF, CASE, DO and WHILE for branching and looping.
- It describes logical expressions that can be used to compare data fields and character strings. Operators like EQ, NE, LT are used to compare field types, while CO, CN, CA are used to compare strings.
- Programming techniques like conditional branching with IF and CASE, unconditional and conditional looping with DO and WHILE are covered. Statements like CONTINUE, CHECK and EXIT can be used to terminate loops.
The document discusses the ABAP List Viewer (ALV) reporting tool. It provides advantages over conventional reports including a better user interface with features like filtering, sorting, layout changes, and exporting to Excel. It describes programming with ALV using function modules and object-oriented approaches. Key points are populating an internal table, calling display functions, and handling events using callback programs and subroutines.
Step by-step creation of a bapi in detailed steps with scr…sapsarath612
This document provides a step-by-step guide to creating a custom BAPI in SAP. It involves creating a structure, function module, and BAPI using transactions SE11, SE37, and SWO1. The BAPI is then tested by passing input parameters and verifying the output matches expectations. Key steps include defining import/export parameters, setting the object and method release statuses, generating the BAPI, and executing it to ensure it works as intended.
1. The document describes the process of dialog programming in SAP systems. It involves using transaction codes, screens, and modules to manage user input and database updates.
2. Key aspects include using PBO, PAI, and flow logic modules to transfer data between screens and the database. Field statements can check user input validity.
3. Functions like POPUP_TO_CONFIRM_LOSS_OF_DATA allow for user confirmation popups. Transaction steps generally commit database updates to preserve data integrity.
This document provides an overview and table of contents for a book about ALE, EDI, and IDoc technologies for SAP. It covers topics such as EDI basics, the SAP EDI interface, configuring EDI components, operating and administering the EDI interface, and various EDI scenarios. The book is divided into five parts that cover EDI, the SAP EDI interface, configuring the EDI interface, operating and administering the interface, and specific EDI scenarios. Each part contains multiple chapters that dive deeper into the topics.
The document provides an overview of SAP Workflow concepts including basic terminology, the position of workflow in the SAP R/3 system, how workflow automates business processes, benefits of workflow, examples of workflow objects, events, methods and tasks. It describes the structure of a workflow definition including conditional processes, parallel processes, and loops. It also discusses templates, the universal inbox interface, and system components including definitions, item manager, and integrated inbox.
Module pool programming allows developers to create custom transactions in SAP. It involves developing screens and assigning flow logic using tools like the ABAP editor, screen painter, and menu painter. The key steps are:
1. Create a module pool program using transaction SE38.
2. Design screens using the screen painter to create screen elements like text fields, buttons.
3. Develop the flow logic using modules in PROCESS BEFORE OUTPUT (PBO) and PROCESS AFTER INPUT (PAI) events.
4. Create menus and toolbars for the screens using the menu painter.
5. Test the program by executing the assigned transaction code.
Module pool programming provides a user-
Metrics-Based Process Mapping: An Excel-Based SolutionTKMG, Inc.
To subscribe: http://www.ksmartin.com/subscribe
To purchase the book: http://bit.ly/MBPMbk
This is the Excel tool Mike Osterling & I developed to provide the means for electronically archiving & distributing manually prepared metrics-based process maps.
The Summary Metrics sheet auto-calculates projected improvement based on current state findings and future state design.
The community of practice gives people an opportunity to network, share practice, hear what various institutions are doing and what we're doing in this space. You'll have the opportunity to discover more about our digital apprenticeships project, as well as our new toolkits in this area.
Sapbpc nw 10.0 transactional data load guide v1Satya
This document provides steps to load transactional data from a flat file into SAP BPC NW 10.0 using the Data Manager. It describes creating dimensions, a financial model, uploading the data file, creating a conversion file with multiple sheets, creating a transformation file, adding and running packages, and generating a report to validate the data load. The document is intended as a guide for loading data from a flat file into BPC using the web interface and Data Manager add-in for Excel.
External Academic Audit (2012-2013)-R.D.SivakumarSivakumar R D .
This document provides information about the M.Com (CA) department of Ayya Nadar Janaki Ammal College. The vision is to empower learners to become worthy citizens and businessmen through commerce education with computer applications. The mission is to develop sound commerce knowledge, instill confidence, implement modern technology, and develop students' overall personality. The department offers an M.Com in computer applications and has 4 faculty members with experience in e-content development, data mining, insurance, and marketing. It provides details on students, achievements, publications, software developed, MoUs signed, syllabus revisions, elective papers from other departments, teaching methods, facilities, association activities, and future plans.
Advanced Excel 2013 2016 Tips and Tricks by Spark TrainingAhmed Yasir Khan
This document provides information about a 2-day advanced Excel workshop to be held in Karachi and Lahore in September. The workshop will be facilitated by Ahmed Yasir Khan, an experienced trainer with 20 years in finance and IT. The workshop will cover advanced Excel topics like data analysis, dashboards, pivot tables, VLOOKUP, and what-if analysis. It is aimed at professionals looking to enhance their Excel skills for tasks like data management, reporting, and analysis. The workshop will provide practical knowledge and tips to help participants optimize and automate routine work.
T.J. Meehan, AIA, LEED AP / Vice President of Professional Services, shares how to implement BIM for owners from the Government Solutions Breakfast hosted by DLT Solutions and CADD Microsystems.
Working with COUNTER Release 5 reports in JUSP - 30 April 2019JUSPSTATS
Laura Wong from Jisc presented on using COUNTER Release 5 reports in JUSP. She provided an overview of key R5 concepts like master reports, standard views, metrics and attributes. The presentation demonstrated the R5 reports available in JUSP, how to view and filter them. Uses of the reports include monitoring journal, book and database usage, compiling annual reports. Future planned features were outlined. Attendees were invited to get involved in testing and providing feedback to help develop the reports.
This document provides an introduction to the Business IT & Applications subject. It outlines that the subject aims to equip students with skills in office automation applications, data visualization tools, and data analytics to support business decision-making and management. Assessment is comprised of two projects - a spreadsheet project worth 35% and a data analytics project worth 35% - as well as laboratory assignments and online class participation. Important dates are also listed, including due dates for the two projects and weekly assignments.
In this comprehensive piece, I delve into the fascinating world of vegetation indices and demonstrate how I skillfully calculated them using the powerful programming language, Python. primarily i used multispectral bands for indices calculation then after that i applied ML in RGB images for classification and i also used DL models for the further process . Additionally, I share my expertise in crafting GIS course content that is sure to captivate learners. Furthermore, I take pride in detailing my proficiency in LiDAR data processing using Python alongside other cutting-edge processing software. I have had the opportunity to develop training content for a variety of purposes, including drone and GIS training courses that we provided to SIS. Additionally, I took responsibility for writing the TPM for DGCA remote pilot courses, which I highlighted in this presentation. By having a hand in both content development and course management, I ensure a comprehensive and well-rounded approach to training.
Presentations on the project roadmap and the objectives for the day, as well as the The Waste API and how it can power web services. Presented by Linda O'Halloran, Product Owner for the Waste Service Standards project, and Paul Mackay, Technical Lead for the project. Presented at the Local Waste Service Standards Front End Integration Workshop held on 8 January 2016 in London.
The document provides an introduction to the Business IT & Applications subject. It outlines that the subject aims to equip students with skills in office automation applications, data visualization tools, and data analytics to support business decision-making and management. Assessment is comprised of two projects - a spreadsheet project worth 35% and a data analytics project worth 35% - as well as laboratory assignments and online class participation. Key due dates are provided for the projects and weekly assignments.
19 11-13 MS Ignite The Tour Paris - Surfing Microsoft 365 wavesPatrick Guimonet
This document summarizes a presentation about analyzing innovations in Microsoft 365 using Power BI. It discusses identifying and loading data from Microsoft's roadmap, cleaning and transforming the data in Power Query, and performing data analysis and sharing in Power BI. The presentation provides tips for enhancing a roadmap analysis and Power BI reports. It analyzes technological waves in collaboration tools like SharePoint and Teams and concludes with an overview of the Power BI analysis process.
Enhanced Unifier Reporting with BI Publisher: On Prem and Cloudp6academy
Referenced: www.p6academy.com
Source: http://coll15.mapyourshow.com
Discover how to develop custom reports within Unifier taking advantage of BI Publisher. The presentation will include examples for: • Creating data views • Configuring custom reports and extracting sample data • Formatting reports within Microsoft Word • Importing report format into Unifier, defining permissions and running the reports within Unifier
Primavera unifier reporting with bipublisher on premandcloudCampin Chou
This document discusses custom reporting capabilities in Oracle's Unifier product using the BI Publisher tool. It covers creating data views from the Unifier database, extracting sample data, formatting reports in Microsoft Word, importing the report format into Unifier and defining permissions. The presentation also discusses advanced topics like additional parameters, conditional formatting and using images in reports. The goal is to provide greater flexibility, reuse and improved maintenance of reports over the standard user-defined reports in Unifier.
ML, Statistics, and Spark with Databricks for Maximizing Revenue in a Delayed...Databricks
In this talk, we will present how we used Spark, Databricks, Airflow and MLflow to process big data, and build a pipeline of both ML(XGBoost) and statistical models that maximizes our revenues in one of our core products, called the “Offer Wall”. The “Offer wall” is a mobile phone product that is integrated with existing apps, suggesting users to perform tasks in exchange for in-app currency. The problem gets even more interesting when considering the fact that some of the tasks users do take 15 minutes and some may take up to 2 to weeks, forcing us to make revenue determining decisions in an uncertain space all of the time. The solution we developed utilizes Databricks and Spark’s strengths and diversity in machine learning, big data, MLflow and Airflow integrations, allowing us to deliver a production-grade solution with short development time between experiments.
Microsoft Excel is a spreadsheet application developed by Microsoft for Microsoft Windows and Mac OS X. It features calculation, graphing tools, pivot tables, and a macro programming language called Visual Basic for Applications.
It has a programming aspect, Visual Basic for Applications, allowing the user to employ a wide variety of numerical methods, for example, for solving differential equations of mathematical physics, and then reporting the results back to the spreadsheet. It also has a variety of interactive features allowing user interfaces that can completely hide the spreadsheet from the user, so the spreadsheet presents itself as a so-called application, or decision support system (DSS), via a custom-designed user interface.
The document discusses recommendations for engineers conducting structural calculations using various software programs like STAAD, SAP2000, RISA, and SFrame. It recommends standardizing loads and load cases, using relevant information in the main report, and moving output files to appendices. It also recommends using Excel as a notepad for calculations and Word to extensively annotate and include graphics. The document provides an example outline for organizing calculation sections and subsections with indexes, revision sheets, introduction, and reference drawings.
Jessica Cinquanta is a PLM System Administrator and Applications Developer with over 15 years of experience in SQL, .NET, and ERP systems like NexGen. She has created reports, automated processes, and developed custom applications for companies in various industries. Her background includes configuring third party applications, identifying user concerns, monitoring performance, and partnering with vendors.
This document provides an overview of a course on business intelligence and data visualization. The course objectives are to introduce data visualization theories, techniques, and tools for analyzing and presenting business data. Students will learn to design, develop, and evaluate effective visualizations and dashboards using tools like Tableau. The course focuses on how business intelligence uses analytics tools to combine data from multiple sources and help users make more informed decisions. Key topics covered include the fundamentals of business intelligence, Tableau functionality, data modeling, and creating dashboards and stories.
The document provides an introduction to the Business IT & Applications subject. It outlines that the subject aims to equip students with skills in office automation applications, data visualization tools, and data analytics to support business decision-making and management. Assessment is comprised of two projects - a spreadsheet project worth 35% and a data analytics project worth 35% - as well as laboratory assignments and online participation, for a total weight of 100%. Important dates are also listed, including e-learning weeks, the project due dates of December 21, 2020 and February 22, 2021, and weekly assignment folders.
This document provides instructions for including an ALV (Application List Viewer) table component in a Web Dynpro application to display booking data. The steps are to: 1) Copy an existing component and rename it; 2) Define usage of the ALV component and map its data context to the booking table data; 3) Replace the existing table UI element with a view container displaying the ALV component. Following these steps will allow one to use the ALV table component to display bookings for a selected flight in a Web Dynpro application.
The document discusses dynamic programming in Web Dynpro. Key points covered include:
1. Dynamic modifications can be made to the context structure and UI element hierarchy at runtime through techniques like dynamic context manipulation, UI manipulation, and assigning actions to UI elements.
2. Circumstances where dynamic modifications are needed include when the data structure is unknown until runtime or for generic, reusable components.
3. The wdDoModifyView method allows direct access to UI elements and is where dynamic UI creation occurs.
4. Dynamic modifications involve creating context and UI element metadata at runtime through API methods and binding elements together through techniques like populating context nodes with data.
This document provides instructions for an exercise to demonstrate data binding, context mapping, and navigation in a Web Dynpro application. The exercise will:
1. Create a context node with attributes in the component controller to store data.
2. Map the context node to two view controllers to make the data available to views.
3. Bind UI elements on a view to display and capture the mapped context data.
4. Create navigation between the two views using outbound and inbound plugs on the views.
This document provides instructions for creating a simple "Hello World" Web Dynpro application in SAP. The steps are:
1. Create a new Web Dynpro component called ZWD_##_HELLO_WORLD with a MAIN view.
2. Add a TEXT element to the view's layout with text "Welcome to Web Dynpro!".
3. Create a Web Dynpro application to access the component via URL.
Run the application to display the greeting text in the browser.
The document discusses internationalization and error handling in ABAP Web Dynpro applications. It describes the Online Text Repository (OTR) which provides centralized storage and translation of texts. Developers can bind UI elements to OTR texts to retrieve translated text at runtime. The IF_WD_MESSAGE_MANAGER interface allows reporting different types of messages to users in a dedicated message area. Standard hook methods like WDDOBEFOREACTION can also be used to perform validation before actions.
This document provides instructions for creating a simple "Hello World" Web Dynpro application in SAP. The steps are:
1. Create a new Web Dynpro component called ZWD_##_HELLO_WORLD with a MAIN view.
2. Add a TEXT element to the view's layout with text "Welcome to Web Dynpro!".
3. Create a Web Dynpro application to access the component via URL.
Run the application to display the greeting text in the browser.
The document discusses various methods for accessing and manipulating context nodes and elements in Web Dynpro controllers. It describes how to navigate the context hierarchy to access specific nodes, retrieve element references, and get and set attribute values. It also covers creating new elements, binding elements and structures to nodes, and retrieving all elements in a node as a table. The goal is to understand the context API that can be used for application coding in controllers.
1. The document discusses the structure and usage of contexts in Web Dynpro controllers. Contexts are hierarchical data storage structures that hold runtime data for the lifespan of a controller.
2. Contexts are constructed from nodes and attributes at design time. At runtime, nodes become collections that can contain multiple elements. Singleton nodes ensure efficient data access by only loading child node data when needed.
3. Context mapping allows controllers to access each other's context data, sharing it without copying. Internal mapping refers to a mapping within a single component.
This document provides instructions for an exercise to demonstrate data binding, context mapping, and navigation in a Web Dynpro application. The exercise will:
1. Create a context node with attributes in the component controller to store data.
2. Map the context node to two view controllers to make the data available to views.
3. Bind UI elements on a view to display and capture the mapped context data.
4. Create navigation between the two views using outbound and inbound plugs on the views.
This document discusses using the ALV (Advanced List Viewer) component in Web Dynpro applications. The ALV is a display component that offers similar functionality to the common ALV in ABAP, including sorting, filtering, aggregation, and editing of data. It is realized as a Web Dynpro component rather than a UI element. The ALV component provides an interface for applications to modify its configuration model to enhance its generic functions with application-specific logic. Key aspects covered include binding application data to the ALV, customizing the ALV's configuration settings, and manipulating it from the application.
This document provides an overview of Web Dynpro, which is SAP's technology for developing web-based user interfaces. It discusses the key concepts behind Web Dynpro such as its model-view-controller architecture, use of declarative programming and code generation. The document also describes the main components of a Web Dynpro application including windows, views, controllers and contexts, and how they work together through mechanisms like context mapping, data binding, and navigation plugs.
This document provides definitions and explanations of key concepts in ABAP (Advanced Business Application Programming) and SAP. It defines terms like master data, transactional data, workflow, cost objects, and G/L accounts. It also explains database tables, views, matchcodes, locking, and the data dictionary. The data dictionary manages data definitions and ensures data integrity. Views combine data from multiple tables without duplicating it physically. Matchcodes and locking help control concurrent access to data.
The document discusses different aspects of SAP architecture and data modeling. It describes the three-tier client/server architecture of SAP R/3 systems with presentation, application, and database layers running on separate computers. It also discusses different types of database tables like transparent tables, pooled tables, and cluster tables and how they are structured and stored differently in the database. The key differences between pooled tables and cluster tables are explained. Important control properties of database tables like delivery class, data class, size category, and buffering status are also summarized.
The document discusses the benefits of meditation for reducing stress and anxiety. It notes that meditation can help calm the mind and body by lowering heart rate and blood pressure. Regular meditation of 10-20 minutes per day is recommended to experience the most benefits.
The document discusses how to debug SAPScript forms by activating the SAPScript debugger in the form printer and running the print program. It describes the features of the SAPScript layoutset debugger, including options to control processing like continue, execute, and single step. The document demonstrates debugging a SAPScript form and includes a summary section and questions.
This document discusses printing SAPScript forms. It describes output types which define when and where forms are printed. Output types can be set to print immediately, with scheduled jobs, or with application transactions. Forms can be previewed on screen or printed to a physical printer. Collective printing allows printing multiple documents scheduled for a specific output type, while repeating output reprints a form.
This document provides an overview of configuring SAPScript output by linking layout sets to programs in different SAP modules. It discusses output determination, which links a layout set, printing program, and form routine based on the output type and medium. The document then describes how to configure these linkages for specific programs in the SD, MM, and FI modules through various transaction codes. It concludes with a demonstration of the configuration and questions about output determination.
The document discusses SAPScript output programs. An output program retrieves data to print in a SAPScript form. It communicates with the form via function calls like OPEN_FORM, WRITE_FORM, and CLOSE_FORM. OPEN_FORM opens the form, WRITE_FORM transfers data to the form, and CLOSE_FORM closes the form after printing is complete. The document also describes the parameters and exceptions for each function call.
This document provides an overview of SAPScript forms. Key points include:
- SAPScript forms are client-specific and language-specific documents used to format output.
- Transaction SE71 is used to create, edit, and copy SAPScript forms. It allows setting page sizes and orientations as well as defining pages, windows, paragraphs, and character formats.
- Forms contain pages which contain windows for organizing content. There are four window types: MAIN, VAR, CONST, and GRAPH.
- Paragraphs and character formats are used to define text styles and attributes like font, alignment, and tabs.
SAPScript is a tool used to create formatted forms in SAP. It extracts data from SAP using an output program written in ABAP and places it into a layout set template, which formats the data for the form. The output program accesses SAP data, while the layout set defines how the extracted data will be arranged on the printed form. SAPScripts combine an output program and layout set to produce customized printed forms like invoices and purchase orders from SAP.
2. Objectives
• The participants will be able to :
– Explain Data Modeling
– Know uses of Data Modeling
– Describe the Basic Components of a Data Model
– Know Data Modeler/ABAP Dictionary
Terminology
– Know about Optionality and Cardinality
– Use SAP Graphic Notation and SAP Text Notation
– Explain Data Model Hierarchies and the SAP EDM
– Link a data model to dictionary objects
March-2005 Data Modeling | 2.15.02 2
3. What is Data Modeling?
March-2005 Data Modeling | 2.15.02 3
Data Dictionary
Real World
DataData
DictionaryDictionary
Data Model
4. Uses of a Data Model
March-2005 Data Modeling | 2.15.02 4
5. Basic Components of a Data Model
March-2005 Data Modeling | 2.15.02 5
EntityEntity
Customer
AttributeAttribute
30 S. 17th St.
Entity TypeEntity Type
Order
7. Attribute
March-2005 Data Modeling | 2.15.02 7
J. ElkinsJ. Elkins
Customer
30 S. 17th St.30 S. 17th St.30 S. 17th St.30 S. 17th St.
215-555-8000215-555-8000215-555-8000215-555-8000
9. Data Modeler / ABAP Dictionary
Terminology
Data Modeler ABAP
Dictionary
Customer: entity record
Customer address: attribute
field
Customers: entity type table
March-2005 Data Modeling | 2.15.02 9
12. Many-to-Many Relationships
March-2005 Data Modeling | 2.15.02 12
Order
Order Lines
1 1 A26
Order # Qty Part #
1 3 C589
2 1 A26
Primary Key: Order Number
Primary Key: Product Number
Primary Keys: Order Number
Product Number
14. Referenced and Dependent Entity
Types
March-2005 Data Modeling | 2.15.02 14
Dependent Entity Type
Referenced Entity Type
Customer ID Name Address . . .
Order ID Date of Order Customer ID . . .
Customer
Order
Referenced
Dependent
32. Data Model Hierarchies and the
SAP EDM
March-2005 Data Modeling | 2.15.02 32
General
Accounting
Chart of
Accounts
Currency
FI
. . .
.
.
.
.
.
.
33. Linking a Data Model to ABAP
Dictionary Objects
March-2005 Data Modeling | 2.15.02 33
DataData
DictionaryDictionary
Data Model
34. Summary
•A data model is a graphical representation of
the information that is to be stored and
processed by a system.
•SAP comes with its own data model, called the
Enterprise Data Model (EDM), that describes
the data design of the SAP system.
•The basic components of a data model are
Entities, Attributes & Entity types.
•The cardinality of a relationship describes the
number of entities of one type that relate toMarch-2005 Data Modeling | 2.15.02 34
35. Questions
•What is a data model ?
•What is SAP's data model called ?
•What are the basic components of a data
model ?
March-2005 Data Modeling | 2.15.02 35
Editor's Notes
A data model is a graphical representation of the information that is to be stored and processed by a system. It is composed of the entities about which you will store information (e.g., customers) and the relationships among those entities. It serves as a road map that documents information stored in the data dictionary.
Data modeling is the process of analysing a real-world activity, determining the information necessary for performing that activity, and documenting that information in a data model. Any process that involves data transfer (such as the placing of an order) is a strong candidate for data modeling.
A data model can be used:
As a basis for application design (this is an example of “top-down”data modeling)
As a road map when creating objects in the data dictionary (this is also “top-down” data modeling)
As documentation for an existing system (this is called “bottom-up”data modeling)
It is good practice to create and maintain a data model for a system. However, in most systems (and in SAP), it is not necessary to create a data model in order to create objects in the dictionary.
SAP comes with its own data model, called the Enterprise Data Model (EDM), that describes the data design of the SAP system. SAP also comes with its own data modeling tool, the SAP Data Modeler, with which you can view the EDM or create your own data models.
SAP calls the EDM the “commercially-oriented model of the real world”.
We will learn more about data modeling in general, and the SAP Data Modeler in particular, throughout the remainder of this chapter.
The basic components of a data model are:
Entities
Attributes
Entity types
An entity is a uniquely identifiable object for which information is to be collected.
Examples of entities might be customers, products and orders.
An attribute is a characteristic of an entity.
Examples of attributes might be a customer’s name, address and telephone number.
An entity type is a set of entities with common attributes.
Examples of entity types might be the sets of all customers, all products and all orders.
The above slide demonstrates how data modeling and data dictionaryterminology coincide.
An additional term that is important to learn is primary key:
A primary key is that attribute or combination of attributes that uniquely identifies an entity of a particular type. A customer ID number might serve as the primary key of the customers entity type.
Although the concept of a primary key is important to understanding the SAP Data Modeler, you can’t actually specify which attributes make up the primary key when building a data model. When building tables in the dictionary, however, you can and must specify a primary key.
In addition to representing information about entities, data models also represent the relationships between entities. For example, a business is not only interested in customers, orders and products, but also which customers place which orders and which orders are for which products.
These relationships represent the business rules that indicate how data is to be stored and processed (such as whether customers can place a second order before paying for the first one).
Relationships between entities can be classified in several ways:
In terms of cardinality
In terms of optionality
In terms of category
The cardinality of a relationship describes the number of entities of one type that relate to entities of other types.
For example:
There is likely to be a one-to-many relationship between customers and orders. In other words, a customer may place several orders, but each order belongs to a single customer.
There is likely to be a many-to-many relationship between orders and products. In other words, an order may consist of several products, and each product may be referenced in more than one order.
There is likely to be a one-to-one relationship between consultants and laptop computers. In other words, a consultant possesses one laptop computer, and a laptop computer belongs to a single consultant.
There is a problem with many-to-many relationships. It is not possible to directly represent those relationships in a normalised relational database. A discussion of normalisation is beyond the scope of this course, but what you need to know is that many-to-many relationships are represented in normalised relational databases by being “broken apart” into two one-to-many relationships with an intermediate entity type.
Let’s take the example of orders and products. In order to represent this many-to-many relationship, we would first create an intermediate entity type, such as “order lines”. There would be a separate order line for each product. Next, we would create a one-to-many relationship between orders and order lines (an order can have many lines, but each line belongs to exactly one order). Finally, we would create a one-to-many relationship between products and order lines (a product can be referenced by many lines, but each line refers to exactly one product).
This has the same effect as creating a many-to-many relationship between orders and products. You can see what this would look like in a data model in the above slide.
The optionality of a relationship describes whether or not entities of one type must refer to entities of another type.
For example, an order must belong to a customer. It does not make sense to have an order on file that was not placed by a customer. A customer, however, does not have to have an order. Every business wants to keep a record of its customers, whether or not they currently have orders outstanding. In this example, the relationship from orders to customers would be mandatory, but the relationship from customers to orders would be optional.
When representing entity relationships, it is necessary to give one entity type additional attributes that refer back to the primary key of the other entity type. Only one entity type in the relationship contains the additional attributes.
For example, the orders entity type would have an attribute for customer ID, indicating which customer had placed the order. Since a customer could place many orders, however, the customer entity would not contain an attribute for order ID.
The entity type that contains the additional attributes is the “child”, or dependent, entity type. The other entity type is the “parent”, or referenced, entity type.
In one-to-many relationships, the entity type that is on the “many” side of the relationship is always the dependent entity type. In one-to-one relationships, you may choose which entity type you would like to make as the dependent entity type.
The concept of referenced and dependent entity types is necessary to fully understand the notation SAP uses to represent cardinality and optionality.
SAP groups the terms cardinality and optionality together and calls them both cardinality.
The above slide indicates the graphical notation that SAP uses torepresent cardinality.
In the SAP Data Modeler, the graphical notation is only shown for one direction (from the referenced entity type to the dependent entity type). For practice and clarity, however, we will do some examples and exercises using the notation in both directions.
A customer may have zero, one or many orders.
An order must refer to exactly one customer.
Fill in the appropriate graphical notation on the above slide:
A professor may advise multiple students.
A student must have exactly one professor as an adviser.
Fill in the appropriate graphical notation on the above slide:
A professor may advise multiple students.
A student may have a professor assigned as an adviser.
Fill in the appropriate graphical notation on the above slide:
Students may enroll in many courses.
A course may have many students enrolled.
Enrolment records must refer to valid students and valid courses.
The above slide indicates the text notation that SAP uses to represent cardinality.
When specifying the cardinality of a relationship in the Data Modeler or in the ABAP Dictionary, you must use the text notation listed above, in the format:
n : m
The left-hand side of the colon refers to the relationship (the arrow) from the dependent entity type to the referenced entity type. This is called the n side of the relationship.
The right-hand side of the colon refers to the relationship from the referenced entity type to the dependent entity type. This is called the m side ofthe relationship.
You may find the text notation easier to understand if you first draw the relationship using graphical notation and then use the above slide to “translate” the graphical notation to text notation.
Here are the possible values for each side of the n:m notation.
For the left side:
n = 1Each dependent entity refers to exactly onereferenced entity.
n = CEach dependent entity refers to zero or onereferenced entities.
For the right side:
m = 1Each referenced entity has exactly onedependent entity.
m = CEach referenced entity has zero or onedependent entities.
m = NEach referenced entity has at least onedependent entity.
m = CNEach referenced entity has zero, one or many dependent entities.
A customer may have zero, one or many orders.
An order must refer to exactly one customer.
Fill in the appropriate text notation on the above slide:
A professor may advise multiple students.
A student must have exactly one professor as an adviser.
Fill in the appropriate text notation on the above slide:
A professor may advise multiple students.
A student may have a professor assigned as an adviser.
Fill in the appropriate text notation on the above slide:
Students may enroll in many courses.
A course may have many students enrolled.
Enrolment records must refer to valid students and valid courses.
Relationships are also identified by their category. A relationship’s category provides information about whether one entity is identified by its relationship to another entity.
There are five relationship categories specified in SAP:
Hierarchical
Aggregating
Referential
Conditional-Referential
Specialization
In a hierarchical relationship, a dependent entity is identified by its relationship to exactly one other entity of a referenced entity type.
The full primary key of the referenced entity type becomes part of the primary key of the dependent entity type.
Primary key for department (academic department): Department number
Primary key for courses: Department number, course number
For example, the course Biology 101 is identified by its number (101) and its department (Biology).
Remember that you don’t actually specify an entity type’s primary key in the data modeler.
In an aggregating relationship, a dependent entity is identified by its relationships with multiple entities of other entity types.
The full primary keys of the referenced entity types become part of the primary key of the dependent entity type.
Primary key for student: Student ID number
Primary key for course: Course number
Primary key for enrolment record: Student ID number, course number
For example, the enrolment record indicating that student 1224 is taking Biology 101 is identified by its student (1224) as well as its course (Biology 101).
Aggregating relationships are what are used to handle many-to-many relationships.
In a referential relationship, the dependent entity is not identified by its relationship to the referenced entity, and the relationship is non-optional.
The primary key of the dependent entity types is not affected by the relationship.
Primary key for professor: Professor number
Primary key for department: Department number
For example, the department Biology is not identified by its chairperson. In other words, the chairperson can be changed without changing the identity of the department itself.
However, in this example, since the relationship is a referential relationship, a department must always have a chairperson.
A conditional-referential relationship is the same as a referential relationship except that the relationship is optional.
The primary key of the dependent entity types is not affected by the relationship.
Primary key for professor: Professor number
Primary key for department: Department number
For example, the department Biology is not identified by its chairperson. In other words, the chairperson can be changed without changing the identity of the department itself.
However, in this example, since the relationship is a conditional-referential relationship, a department need not have a chairperson. It is possible for the position to be vacant.
In a specialising relationship, one entity type represents a subset of another entity type. In this case the dependent entity type is known as the specialisation, and the referenced entity type is known as the generalisation.
The primary key of the specialisation is the same as the primary key of the generalisation. Specialisations are a special kind of hierarchical relationship.
Generalisations and specialisations store different information in non-key attributes. For example, a telephone company might store general information about all customers (such as name and address) in a customer entity type, while more specific information might be stored in a specialisation that only applied to business customers (such as the appropriate contact person at the business, or whether the business was a corporation, partnership, or sole proprietorship).
Data models in SAP can be organised hierarchically. In other words, it is possible to create small data models that represent a portion of a system. These data models can then be linked together to form a larger, more complete data model.
For example, in the Enterprise Data Model (EDM) that comes delivered with SAP, there are “small” data models representing the Chart of Accounts and Currency types. These data models are in turn parts of the larger data model for General Accounting, which together with other data models form the overall data model for the FI module.
When data models are organised hierarchically, it is possible to display the hierarchy and then “drill down” to the level of detail you desire. Some or all of the hierarchy may then be displayed graphically.
To access the EDM, go to the main screen for the Data Modeler. From there, click one of the buttons:
SAP Applications
SAP Architecture
The SAP Data Modeler is integrated with the ABAP Dictionary.
In the Data Modeler, it is possible to specify the dictionary table that a particular entity type represents.
This permits easy navigation between the Data Modeler and the ABAP Dictionary. Additionally, when you assign an entity type to a table, the system automatically enters the entity type’s attributes for you (they are taken from the table’s field structure).
If you change the table’s structure, the entity type’s attribute list will automatically be updated. However, if you change the entity type’s attributes, the dictionary table is not changed.