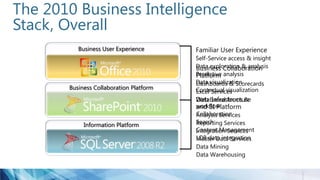
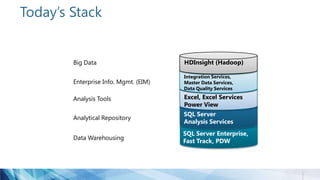
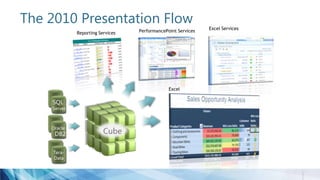
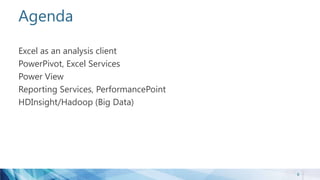
SlideShare a Scribd company logo
1 of 45
Hitchhiker’s Guide to SharePoint BI
(and Big Data too)
◦ Andrew J. Brust, Founder and CEO, Blue Badge Insights
Meet Andrew
CEO and Founder, Blue Badge Insights
Big Data blogger for ZDNet
Microsoft Regional Director, MVP
Co-chair VSLive! and 17 years as a speaker
Founder, Microsoft BI User Group of NYC
• http://www.msbinyc.com
Co-moderator, NYC .NET Developers Group
• http://www.nycdotnetdev.com
“Redmond Review” columnist for Visual Studio Magazine and Redmond Developer News
brustblog.com, Twitter: @andrewbrust
2
Andrew’s New Blog (bit.ly/bigondata)
Read all about it!
The 2010 Business Intelligence
Stack, Overall
Business User Experience
Data Infrastructure
and BI Platform
Analysis Services
Reporting Services
Integration Services
Master Data Services
Data Mining
Data Warehousing
Business Collaboration
Platform
Dashboards & Scorecards
Excel Services
Web based forms &
workflow
Collaboration
Search
Content Management
LOB data integration
Familiar User Experience
Self-Service access & insight
Data exploration & analysis
Predictive analysis
Data visualization
Contextual visualizationBusiness Collaboration Platform
Information Platform
Today’s Stack
Data Warehousing
Analytical Repository
Enterprise Info. Mgmt. (EIM)
Analysis Tools
Big Data
SQL Server Enterprise,
Fast Track, PDW
SQL Server
Analysis Services
Excel, Excel Services
Power View
Integration Services,
Master Data Services,
Data Quality Services
HDInsight (Hadoop)
The 2010 Presentation Flow
PerformancePoint Services
Excel Services
Excel
SQL
Server
Tera-
Data
Oracle
DB2
Reporting Services
Agenda
Excel as an analysis client
PowerPivot, Excel Services
Power View
Reporting Services, PerformancePoint
HDInsight/Hadoop (Big Data)
8
EXCEL AS AN ANALYSIS CLIENT
PivotStuff
PivotTable, and linked charts (sometimes referred to
as PivotCharts) work extremely well with OLAP cubes
How to create a PivotTable:
• Ribbon’s Data tab (From Other Sources button/From
Analysis Services option or Existing Connections button)
• Insert tab (PivotTable “split button”)
How to insert a chart
• PivotChart button on PivotTable Tools/Options tab
• Several others
Formula Language CUBE Functions
CUBEMEMBER and CUBEVALUE
• Also CUBEKPIMEMBER, CUBEMEMBERPROPERTY,
CUBERANKEDMEMBER, CUBESET and CUBESETCOUNT
IntelliSense style support
• In a cell, type “=CU” and all CUBE formulas will display
• Select one with arrow keys and hit Tab
• When prompted for connection, type " and view pop-up
list
• Other pop-ups activate on " or "."
At Your Service
“Range Drag” and relative formula support on CUBEVALUE
CUBEVALUE and Data Bars go great together
Ability to convert PivotTables to formulas
Excel as an Analysis Client
POWERPIVOT, EXCEL SERVICES
Self-Service BI with PowerPivot
Excel + Analysis Services + SharePoint
Enables the working in Excel but mitigates the “spreadmart” pitfalls:
• Use Analysis Services (AS) as a hidden engine
•Instead of no engine
• Share via SharePoint, accessible by all AS clients
•Instead of “deploying” via email
• Formal data refresh on server
•So data doesn’t get stale, and users don’t have to make effort at updating
• Allow IT to monitor
•So it’s not all rogue
• Provide path to more rigorous implementations
•Can be upsized to Analysis Services
How Do You Get PowerPivot?
For Excel 2010:
• Download the add-in from www.powerpivot.com
• Get 32-bit or 64-bit version, depending on your version of Office (not
Windows)
• Run the installer
For Excel 2013:
• Requires Excel ProPlus retail product under volume license, or an Office 365
ProPlus, Enterprise E3 or E4 subscription
• It’s still in add-in, installed but not activated by default
• Same goes for Excel version of Power View
PowerPivot Guidebook
Table tabs
View data
in Excel
DAX formula bar
Relationship
indicator
Import data from
almost anywhere
Sort and filter
Calculated
column
entry
Modeling the Data
KPIs
Calculations
Data and
Diagram views
Calculation
area
Calculation
formula
Sort one column
by another
Diagram View Default Aggregations Special Advanced Mode
Reporting
properties
Hierarchies
Hide specific
columns and
tables
Create
relationships
visually
KPIs
Perspectives
Calculations
PowerPivot Client
Excel Services
A component of SharePoint Server 2007+; requires
Enterprise CAL
Allows export of workbook, worksheet, or individual
items to SharePoint report library
• Works great for PivotTables and Charts!
• Also for sheets with CUBExxx formulas or conditional
formatting-driven “scorecards”
Content can be viewed in browser
• Excel client not required
• Drilldown interactivity maintained
• Rendered in pure HTML and JavaScript
• Parameterization supported
PowerPivot Server
Publish to Excel Services
Viewing and interacting
Data Refresh
Treating as SSAS cube
• 2008 R2 version: URL to .xlsx as server name
• 2012 version: use POWERPIVOT named instance and
treat just like SSAS
• DB name is GUID-based; best to discover it
Use Excel, Reporting Services as clients
• And now Power View too…more later
The IT Dashboard
Increase IT efficiency:
Familiar Technologies
for Authoring, Sharing,
Security, and
Compliance
Customizable IT
Dashboard
Visualize usage with
animated charts
Simplify management of SSBI content using
IT Operations Dashboard for SharePoint
SQL Server Analysis Services
Two Modes:
• Multidimensional (was the only mode until SQL Server 2012)
• Tabular (the SSAS version of PowerPivot)
Both modes query-able by various clients:
• Excel
• Excel Services
• Reporting Services
• PerformancePoint
• Even PowerPivot
Only Tabular mode is query-able by Power View
• Power View wedded to BISM, so PowerPivot on SharePoint works too
• Let’s talk about Power View now…
24
POWER VIEW
What is Power View?
Ad hoc reporting. Really!
Analysis, data exploration
Data Visualization
In Silverlight, in the browser, in SharePoint
• And now in Excel 2013, too
Is actually based on SSRS
• Power View makes a special RDL file
Power View Data Sources
Power View works only against BISM
DirectQuery mode supported, however
Support for SSAS Multidimensional cubes coming
Gist is this: Power View emits DAX expressions
• PowerPivot and SSAS Tabular support DAX (Data Analysis eXpressions).
• SSAS Multidimensional will support DAX soon
Create a Power View Report
In Excel 2013, click Power View button on Insert tab of ribbon
• Make sure add-in is activated
In SharePoint, click “Create Power View Report” button or option on
workbook in PowerPivot Gallery
For SSAS tabular model, create BISM data source, then click its “Create
Power View Report” button or option
• BISM data sources can point to PowerPivot workbooks too, if you want.
Can export to PowerPoint and view there
Power View
SSRS, PERFORMANCEPOINT, HDINSIGHT
SSRS and Report Builder
Report Builder 3.0
• Familiar Microsoft Office Interface
• Powerful Wizards
• SharePoint list as data source
• Powerful Query Designer
• Flexible Layout Options w/ rich
visualizations
• PowerPivot as data source
Rich Visualizations
Report Parts
Skilled SSRS designers can publish report parts
• From Report Builder 3.0 or VS report projects
End users can pick them from a gallery
• A task pane, in Report Builder 3.0, with search capability
• Cannot select from VS report designer
What can be published?:
• Tablixes (i.e. tables, matrices)
• Rectangles
• Images, Charts, Gauges, Maps
• Parameters and Lists
All aided by new ability to share Datasets and original
ability to share Data Sources
Easy to Publish; Easy to Select
PerformancePoint Services (PPS)
Scorecards
Cascading
scorecards
with
interactive
charts and
data from
multiple
sources
Analytics
Multi-
dimensional
slice and dice
for advanced
analytics
including
decomposition
tree,
performance
map, and
perspective
view
PPS Capabilities
Analytic Grids & Charts
• PPS’ own data visualizations
• AJAX-based interactive analytics capabilities
Scorecards
• Key Performance Indicators
• Objectives
• Dimensions
Dashboards
• Bird’s eye view of business activities
• Display Analytic Grids and Charts; Scorecards
• Integrate SSRS, Excel Services (including PowerPivot) content
• Add Filters
SSRS and PerformancePoint
Microsoft HDInsight
Developed with Hortonworks and incorporates Hortonworks Data
Platform (HDP) for Windows
Windows Azure HDInsight and Microsoft HDInsight (for Windows
Server)
Single node preview runs on Windows client
Includes ODBC Driver for Hive
And Excel Add-In that uses it
JavaScript MapReduce framework
Contribute it all back to open source Apache Project
The New Presentation Flow
Relational
Data
Hadoop/HDFS
Unstructured
Data
SSAS Tabular
Power View
Excel
Thank you
andrew.brust@bluebadgeinsights.com
@andrewbrust on twitter
Want to get on Blue Badge Insights’ list?”
• Text “bluebadge” to 22828
Blog:
http://www.bobhunt.net/
Twitter: @bobhms
Bob Hunt “The” Microsoft IT Pro Evangelist
Blog:
http://powertoe.wordpress.com/
Twitter: @toenuff
Tome Tanasovski PowerShell MVP
Blog:
www.ngenioussolutions.com/blog
Twitter: @nilaish
Nilesh Mehta SharePoint Architect
Blog: Too cool for one
Twitter: Too cool for one
Edwin Woo Windows Extremist
Blog: http://ehlotech.blogspot.com
Twitter:@bserebin
Ben Serebin Exchange Junkie
Thanks to our Organizers!
Blog:
http://www.bobhunt.net/
Twitter: @bobhms
Bob Hunt “The” Microsoft IT Pro Evangelist
Website: http://www.nyewin.org
Twitter: @NYeWin
Eric Fellen
Website:
http://www.nyewin.org
Ken Reid
Thanks to our Organizers!
Jason Gallicchio SharePoint Enthusiast
Twitter: @jasongall
Techstravaganza Communities
• Meetings: First Wednesday of the month, 5:30 to 7:30 PM, Microsoft NYC Office
• Web: http://www.sharepointusergroup.org/NewYork/Default.aspx
NYC SharePoint User Group
Princeton Area SharePoint User Group
NYC PowerShell User Group
• Meetings: Fourth Wednesday of the month, 6:00 to 8:00 PM, Infragistics Building
Cranberry NJ
• Web: www.princetonsug.com
• Meetings: Second Monday of the month, 6:00PM, Microsoft NYC Office
• Web: http://powershellgroup.org/nyc
• Meetings: Second Tuesday of the month, 5:45PM to 9PM, Microsoft NYC Office
• Web: www.nyexug.com
New York Exchange User Group
• Meetings: First Thursday of the month, 6:00PM, Microsoft NYC Office
• Web: http://www.nyewin.org/
NY Enterprise Windows User Group
Thanks to our Sponsors!
Event Sponsors
Thanks to our User Groups!
Event User Groups

More Related Content

What's hot

Relational databases vs Non-relational databases
Relational databases vs Non-relational databasesRelational databases vs Non-relational databases
Relational databases vs Non-relational databasesJames Serra
 
RDX Insights Presentation - Microsoft Business Intelligence
RDX Insights Presentation - Microsoft Business IntelligenceRDX Insights Presentation - Microsoft Business Intelligence
RDX Insights Presentation - Microsoft Business IntelligenceChristopher Foot
 
Data Modeling for NoSQL
Data Modeling for NoSQLData Modeling for NoSQL
Data Modeling for NoSQLTony Tam
 
Relational and non relational database 7
Relational and non relational database 7Relational and non relational database 7
Relational and non relational database 7abdulrahmanhelan
 
Azure Databricks is Easier Than You Think
Azure Databricks is Easier Than You ThinkAzure Databricks is Easier Than You Think
Azure Databricks is Easier Than You ThinkIke Ellis
 
SQL To NoSQL - Top 6 Questions Before Making The Move
SQL To NoSQL - Top 6 Questions Before Making The MoveSQL To NoSQL - Top 6 Questions Before Making The Move
SQL To NoSQL - Top 6 Questions Before Making The MoveIBM Cloud Data Services
 
Research on vector spatial data storage scheme based
Research on vector spatial data storage scheme basedResearch on vector spatial data storage scheme based
Research on vector spatial data storage scheme basedAnant Kumar
 
Should I move my database to the cloud?
Should I move my database to the cloud?Should I move my database to the cloud?
Should I move my database to the cloud?James Serra
 
Introduction to PolyBase
Introduction to PolyBaseIntroduction to PolyBase
Introduction to PolyBaseJames Serra
 
Introduction to Azure DocumentDB
Introduction to Azure DocumentDBIntroduction to Azure DocumentDB
Introduction to Azure DocumentDBDenny Lee
 
Power BI for Big Data and the New Look of Big Data Solutions
Power BI for Big Data and the New Look of Big Data SolutionsPower BI for Big Data and the New Look of Big Data Solutions
Power BI for Big Data and the New Look of Big Data SolutionsJames Serra
 
The Future of Analytics, Data Integration and BI on Big Data Platforms
The Future of Analytics, Data Integration and BI on Big Data PlatformsThe Future of Analytics, Data Integration and BI on Big Data Platforms
The Future of Analytics, Data Integration and BI on Big Data PlatformsMark Rittman
 
Data Modeling on Azure for Analytics
Data Modeling on Azure for AnalyticsData Modeling on Azure for Analytics
Data Modeling on Azure for AnalyticsIke Ellis
 
Azure Lowlands: An intro to Azure Data Lake
Azure Lowlands: An intro to Azure Data LakeAzure Lowlands: An intro to Azure Data Lake
Azure Lowlands: An intro to Azure Data LakeRick van den Bosch
 
Azure Synapse Analytics Overview (r1)
Azure Synapse Analytics Overview (r1)Azure Synapse Analytics Overview (r1)
Azure Synapse Analytics Overview (r1)James Serra
 
OTN EMEA TOUR 2016 - OBIEE12c New Features for End-Users, Developers and Sys...
OTN EMEA TOUR 2016  - OBIEE12c New Features for End-Users, Developers and Sys...OTN EMEA TOUR 2016  - OBIEE12c New Features for End-Users, Developers and Sys...
OTN EMEA TOUR 2016 - OBIEE12c New Features for End-Users, Developers and Sys...Mark Rittman
 
Eugene Polonichko "Azure Data Lake: what is it? why is it? where is it?"
Eugene Polonichko "Azure Data Lake: what is it? why is it? where is it?"Eugene Polonichko "Azure Data Lake: what is it? why is it? where is it?"
Eugene Polonichko "Azure Data Lake: what is it? why is it? where is it?"DataConf
 

What's hot (20)

Relational databases vs Non-relational databases
Relational databases vs Non-relational databasesRelational databases vs Non-relational databases
Relational databases vs Non-relational databases
 
RDX Insights Presentation - Microsoft Business Intelligence
RDX Insights Presentation - Microsoft Business IntelligenceRDX Insights Presentation - Microsoft Business Intelligence
RDX Insights Presentation - Microsoft Business Intelligence
 
Data Modeling for NoSQL
Data Modeling for NoSQLData Modeling for NoSQL
Data Modeling for NoSQL
 
RDBMS vs NoSQL
RDBMS vs NoSQLRDBMS vs NoSQL
RDBMS vs NoSQL
 
Relational and non relational database 7
Relational and non relational database 7Relational and non relational database 7
Relational and non relational database 7
 
Azure Databricks is Easier Than You Think
Azure Databricks is Easier Than You ThinkAzure Databricks is Easier Than You Think
Azure Databricks is Easier Than You Think
 
Relational vs. Non-Relational
Relational vs. Non-RelationalRelational vs. Non-Relational
Relational vs. Non-Relational
 
SQL To NoSQL - Top 6 Questions Before Making The Move
SQL To NoSQL - Top 6 Questions Before Making The MoveSQL To NoSQL - Top 6 Questions Before Making The Move
SQL To NoSQL - Top 6 Questions Before Making The Move
 
Research on vector spatial data storage scheme based
Research on vector spatial data storage scheme basedResearch on vector spatial data storage scheme based
Research on vector spatial data storage scheme based
 
Should I move my database to the cloud?
Should I move my database to the cloud?Should I move my database to the cloud?
Should I move my database to the cloud?
 
Introduction to PolyBase
Introduction to PolyBaseIntroduction to PolyBase
Introduction to PolyBase
 
Introduction to Azure DocumentDB
Introduction to Azure DocumentDBIntroduction to Azure DocumentDB
Introduction to Azure DocumentDB
 
Power BI for Big Data and the New Look of Big Data Solutions
Power BI for Big Data and the New Look of Big Data SolutionsPower BI for Big Data and the New Look of Big Data Solutions
Power BI for Big Data and the New Look of Big Data Solutions
 
The Future of Analytics, Data Integration and BI on Big Data Platforms
The Future of Analytics, Data Integration and BI on Big Data PlatformsThe Future of Analytics, Data Integration and BI on Big Data Platforms
The Future of Analytics, Data Integration and BI on Big Data Platforms
 
Data Modeling on Azure for Analytics
Data Modeling on Azure for AnalyticsData Modeling on Azure for Analytics
Data Modeling on Azure for Analytics
 
Rdbms vs. no sql
Rdbms vs. no sqlRdbms vs. no sql
Rdbms vs. no sql
 
Azure Lowlands: An intro to Azure Data Lake
Azure Lowlands: An intro to Azure Data LakeAzure Lowlands: An intro to Azure Data Lake
Azure Lowlands: An intro to Azure Data Lake
 
Azure Synapse Analytics Overview (r1)
Azure Synapse Analytics Overview (r1)Azure Synapse Analytics Overview (r1)
Azure Synapse Analytics Overview (r1)
 
OTN EMEA TOUR 2016 - OBIEE12c New Features for End-Users, Developers and Sys...
OTN EMEA TOUR 2016  - OBIEE12c New Features for End-Users, Developers and Sys...OTN EMEA TOUR 2016  - OBIEE12c New Features for End-Users, Developers and Sys...
OTN EMEA TOUR 2016 - OBIEE12c New Features for End-Users, Developers and Sys...
 
Eugene Polonichko "Azure Data Lake: what is it? why is it? where is it?"
Eugene Polonichko "Azure Data Lake: what is it? why is it? where is it?"Eugene Polonichko "Azure Data Lake: what is it? why is it? where is it?"
Eugene Polonichko "Azure Data Lake: what is it? why is it? where is it?"
 

Similar to Hitchhiker’s Guide to SharePoint BI

Building your first Analysis Services Tabular BI Semantic model with SQL Serv...
Building your first Analysis Services Tabular BI Semantic model with SQL Serv...Building your first Analysis Services Tabular BI Semantic model with SQL Serv...
Building your first Analysis Services Tabular BI Semantic model with SQL Serv...Microsoft TechNet - Belgium and Luxembourg
 
Powerbimadesimple 150206194215-conversion-gate01
Powerbimadesimple 150206194215-conversion-gate01Powerbimadesimple 150206194215-conversion-gate01
Powerbimadesimple 150206194215-conversion-gate01Zeeshan Ikram
 
Power BI Made Simple
Power BI Made SimplePower BI Made Simple
Power BI Made SimpleJames Serra
 
Microsoft Power Stack 2019 [Power BI, Excel, Azure & Friends]
Microsoft Power Stack 2019 [Power BI, Excel, Azure & Friends]Microsoft Power Stack 2019 [Power BI, Excel, Azure & Friends]
Microsoft Power Stack 2019 [Power BI, Excel, Azure & Friends]Olivier Travers
 
Self-Service Business Intelligence with Power BI
Self-Service Business Intelligence with Power BISelf-Service Business Intelligence with Power BI
Self-Service Business Intelligence with Power BITheresa Lubelski
 
Working with Microsoft Power Business Inteligence Tools - Presented by Atidan
Working with Microsoft Power Business Inteligence Tools - Presented by AtidanWorking with Microsoft Power Business Inteligence Tools - Presented by Atidan
Working with Microsoft Power Business Inteligence Tools - Presented by AtidanDavid J Rosenthal
 
How to integrate Visio 2013 and Visio Services 2013 with SharePoint to create...
How to integrate Visio 2013 and Visio Services 2013 with SharePoint to create...How to integrate Visio 2013 and Visio Services 2013 with SharePoint to create...
How to integrate Visio 2013 and Visio Services 2013 with SharePoint to create...Knut Relbe-Moe [MVP, MCT]
 
Microsoft BI reporting capabilities (on-prem solutions) Presentation
Microsoft BI reporting capabilities (on-prem solutions) PresentationMicrosoft BI reporting capabilities (on-prem solutions) Presentation
Microsoft BI reporting capabilities (on-prem solutions) Presentationjeromedoyen
 
powerbioverview-191114161542.pdf
powerbioverview-191114161542.pdfpowerbioverview-191114161542.pdf
powerbioverview-191114161542.pdfMarkMayle2
 
Power BI Overview
Power BI OverviewPower BI Overview
Power BI OverviewJames Serra
 
Business Intelligence in SharePoint 2013
Business Intelligence in SharePoint 2013Business Intelligence in SharePoint 2013
Business Intelligence in SharePoint 2013Jason Himmelstein
 
See Beyond the Numbers: Data Visualization in SharePoint 2010
See Beyond the Numbers: Data Visualization in SharePoint 2010See Beyond the Numbers: Data Visualization in SharePoint 2010
See Beyond the Numbers: Data Visualization in SharePoint 2010Sadalit Van Buren
 
BI in the Cloud - Microsoft Power BI Overview and Demo
BI in the Cloud - Microsoft Power BI Overview and DemoBI in the Cloud - Microsoft Power BI Overview and Demo
BI in the Cloud - Microsoft Power BI Overview and DemoChristopher Foot
 
SharePoint Connections Coast to Coast Business Intelligence Solutions with Sh...
SharePoint Connections Coast to Coast Business Intelligence Solutions with Sh...SharePoint Connections Coast to Coast Business Intelligence Solutions with Sh...
SharePoint Connections Coast to Coast Business Intelligence Solutions with Sh...Ivan Sanders
 

Similar to Hitchhiker’s Guide to SharePoint BI (20)

Building your first Analysis Services Tabular BI Semantic model with SQL Serv...
Building your first Analysis Services Tabular BI Semantic model with SQL Serv...Building your first Analysis Services Tabular BI Semantic model with SQL Serv...
Building your first Analysis Services Tabular BI Semantic model with SQL Serv...
 
Powerbimadesimple 150206194215-conversion-gate01
Powerbimadesimple 150206194215-conversion-gate01Powerbimadesimple 150206194215-conversion-gate01
Powerbimadesimple 150206194215-conversion-gate01
 
Power BI Made Simple
Power BI Made SimplePower BI Made Simple
Power BI Made Simple
 
Sps south fla-bi_data_visualization
Sps south fla-bi_data_visualizationSps south fla-bi_data_visualization
Sps south fla-bi_data_visualization
 
Microsoft Power Stack 2019 [Power BI, Excel, Azure & Friends]
Microsoft Power Stack 2019 [Power BI, Excel, Azure & Friends]Microsoft Power Stack 2019 [Power BI, Excel, Azure & Friends]
Microsoft Power Stack 2019 [Power BI, Excel, Azure & Friends]
 
Self-Service Business Intelligence with Power BI
Self-Service Business Intelligence with Power BISelf-Service Business Intelligence with Power BI
Self-Service Business Intelligence with Power BI
 
Sp tech con-bi2011
Sp tech con-bi2011Sp tech con-bi2011
Sp tech con-bi2011
 
Working with Microsoft Power Business Inteligence Tools - Presented by Atidan
Working with Microsoft Power Business Inteligence Tools - Presented by AtidanWorking with Microsoft Power Business Inteligence Tools - Presented by Atidan
Working with Microsoft Power Business Inteligence Tools - Presented by Atidan
 
How to integrate Visio 2013 and Visio Services 2013 with SharePoint to create...
How to integrate Visio 2013 and Visio Services 2013 with SharePoint to create...How to integrate Visio 2013 and Visio Services 2013 with SharePoint to create...
How to integrate Visio 2013 and Visio Services 2013 with SharePoint to create...
 
Microsoft BI reporting capabilities (on-prem solutions) Presentation
Microsoft BI reporting capabilities (on-prem solutions) PresentationMicrosoft BI reporting capabilities (on-prem solutions) Presentation
Microsoft BI reporting capabilities (on-prem solutions) Presentation
 
See Beyond the Numbers: Data Visualization in SharePoint
See Beyond the Numbers: Data Visualization in SharePointSee Beyond the Numbers: Data Visualization in SharePoint
See Beyond the Numbers: Data Visualization in SharePoint
 
Boston Area SharePoint User Group BI Data Visualization
Boston Area SharePoint User Group BI Data VisualizationBoston Area SharePoint User Group BI Data Visualization
Boston Area SharePoint User Group BI Data Visualization
 
powerbioverview-191114161542.pdf
powerbioverview-191114161542.pdfpowerbioverview-191114161542.pdf
powerbioverview-191114161542.pdf
 
Power BI Overview
Power BI OverviewPower BI Overview
Power BI Overview
 
Business intelligence
Business intelligenceBusiness intelligence
Business intelligence
 
Power bi overview
Power bi overview Power bi overview
Power bi overview
 
Business Intelligence in SharePoint 2013
Business Intelligence in SharePoint 2013Business Intelligence in SharePoint 2013
Business Intelligence in SharePoint 2013
 
See Beyond the Numbers: Data Visualization in SharePoint 2010
See Beyond the Numbers: Data Visualization in SharePoint 2010See Beyond the Numbers: Data Visualization in SharePoint 2010
See Beyond the Numbers: Data Visualization in SharePoint 2010
 
BI in the Cloud - Microsoft Power BI Overview and Demo
BI in the Cloud - Microsoft Power BI Overview and DemoBI in the Cloud - Microsoft Power BI Overview and Demo
BI in the Cloud - Microsoft Power BI Overview and Demo
 
SharePoint Connections Coast to Coast Business Intelligence Solutions with Sh...
SharePoint Connections Coast to Coast Business Intelligence Solutions with Sh...SharePoint Connections Coast to Coast Business Intelligence Solutions with Sh...
SharePoint Connections Coast to Coast Business Intelligence Solutions with Sh...
 

More from Andrew Brust

Azure ml screen grabs
Azure ml screen grabsAzure ml screen grabs
Azure ml screen grabsAndrew Brust
 
Big Data on the Microsoft Platform - With Hadoop, MS BI and the SQL Server stack
Big Data on the Microsoft Platform - With Hadoop, MS BI and the SQL Server stackBig Data on the Microsoft Platform - With Hadoop, MS BI and the SQL Server stack
Big Data on the Microsoft Platform - With Hadoop, MS BI and the SQL Server stackAndrew Brust
 
A Practical Look at the NOSQL and Big Data Hullabaloo
A Practical Look at the NOSQL and Big Data HullabalooA Practical Look at the NOSQL and Big Data Hullabaloo
A Practical Look at the NOSQL and Big Data HullabalooAndrew Brust
 
Hadoop and its Ecosystem Components in Action
Hadoop and its Ecosystem Components in ActionHadoop and its Ecosystem Components in Action
Hadoop and its Ecosystem Components in ActionAndrew Brust
 
Brust hadoopecosystem
Brust hadoopecosystemBrust hadoopecosystem
Brust hadoopecosystemAndrew Brust
 
SQL Server Workshop for Developers - Visual Studio Live! NY 2012
SQL Server Workshop for Developers - Visual Studio Live! NY 2012SQL Server Workshop for Developers - Visual Studio Live! NY 2012
SQL Server Workshop for Developers - Visual Studio Live! NY 2012Andrew Brust
 
Microsoft's Big Play for Big Data- Visual Studio Live! NY 2012
Microsoft's Big Play for Big Data- Visual Studio Live! NY 2012Microsoft's Big Play for Big Data- Visual Studio Live! NY 2012
Microsoft's Big Play for Big Data- Visual Studio Live! NY 2012Andrew Brust
 
Power View: Analysis and Visualization for Your Application’s Data
Power View: Analysis and Visualization for Your Application’s DataPower View: Analysis and Visualization for Your Application’s Data
Power View: Analysis and Visualization for Your Application’s DataAndrew Brust
 
Microsoft's Big Play for Big Data
Microsoft's Big Play for Big DataMicrosoft's Big Play for Big Data
Microsoft's Big Play for Big DataAndrew Brust
 
Evolved BI with SQL Server 2012
Evolved BIwith SQL Server 2012Evolved BIwith SQL Server 2012
Evolved BI with SQL Server 2012Andrew Brust
 
Grasping The LightSwitch Paradigm
Grasping The LightSwitch ParadigmGrasping The LightSwitch Paradigm
Grasping The LightSwitch ParadigmAndrew Brust
 
SQL Server Denali: BI on Your Terms
SQL Server Denali: BI on Your Terms SQL Server Denali: BI on Your Terms
SQL Server Denali: BI on Your Terms Andrew Brust
 
Microsoft and its Competition: A Developer-Friendly Market Analysis
Microsoft and its Competition: A Developer-Friendly Market Analysis Microsoft and its Competition: A Developer-Friendly Market Analysis
Microsoft and its Competition: A Developer-Friendly Market Analysis Andrew Brust
 
Cloud Computing and the Microsoft Developer - A Down-to-Earth Analysis
Cloud Computing and the Microsoft Developer - A Down-to-Earth AnalysisCloud Computing and the Microsoft Developer - A Down-to-Earth Analysis
Cloud Computing and the Microsoft Developer - A Down-to-Earth AnalysisAndrew Brust
 

More from Andrew Brust (14)

Azure ml screen grabs
Azure ml screen grabsAzure ml screen grabs
Azure ml screen grabs
 
Big Data on the Microsoft Platform - With Hadoop, MS BI and the SQL Server stack
Big Data on the Microsoft Platform - With Hadoop, MS BI and the SQL Server stackBig Data on the Microsoft Platform - With Hadoop, MS BI and the SQL Server stack
Big Data on the Microsoft Platform - With Hadoop, MS BI and the SQL Server stack
 
A Practical Look at the NOSQL and Big Data Hullabaloo
A Practical Look at the NOSQL and Big Data HullabalooA Practical Look at the NOSQL and Big Data Hullabaloo
A Practical Look at the NOSQL and Big Data Hullabaloo
 
Hadoop and its Ecosystem Components in Action
Hadoop and its Ecosystem Components in ActionHadoop and its Ecosystem Components in Action
Hadoop and its Ecosystem Components in Action
 
Brust hadoopecosystem
Brust hadoopecosystemBrust hadoopecosystem
Brust hadoopecosystem
 
SQL Server Workshop for Developers - Visual Studio Live! NY 2012
SQL Server Workshop for Developers - Visual Studio Live! NY 2012SQL Server Workshop for Developers - Visual Studio Live! NY 2012
SQL Server Workshop for Developers - Visual Studio Live! NY 2012
 
Microsoft's Big Play for Big Data- Visual Studio Live! NY 2012
Microsoft's Big Play for Big Data- Visual Studio Live! NY 2012Microsoft's Big Play for Big Data- Visual Studio Live! NY 2012
Microsoft's Big Play for Big Data- Visual Studio Live! NY 2012
 
Power View: Analysis and Visualization for Your Application’s Data
Power View: Analysis and Visualization for Your Application’s DataPower View: Analysis and Visualization for Your Application’s Data
Power View: Analysis and Visualization for Your Application’s Data
 
Microsoft's Big Play for Big Data
Microsoft's Big Play for Big DataMicrosoft's Big Play for Big Data
Microsoft's Big Play for Big Data
 
Evolved BI with SQL Server 2012
Evolved BIwith SQL Server 2012Evolved BIwith SQL Server 2012
Evolved BI with SQL Server 2012
 
Grasping The LightSwitch Paradigm
Grasping The LightSwitch ParadigmGrasping The LightSwitch Paradigm
Grasping The LightSwitch Paradigm
 
SQL Server Denali: BI on Your Terms
SQL Server Denali: BI on Your Terms SQL Server Denali: BI on Your Terms
SQL Server Denali: BI on Your Terms
 
Microsoft and its Competition: A Developer-Friendly Market Analysis
Microsoft and its Competition: A Developer-Friendly Market Analysis Microsoft and its Competition: A Developer-Friendly Market Analysis
Microsoft and its Competition: A Developer-Friendly Market Analysis
 
Cloud Computing and the Microsoft Developer - A Down-to-Earth Analysis
Cloud Computing and the Microsoft Developer - A Down-to-Earth AnalysisCloud Computing and the Microsoft Developer - A Down-to-Earth Analysis
Cloud Computing and the Microsoft Developer - A Down-to-Earth Analysis
 

Recently uploaded

WordPress Websites for Engineers: Elevate Your Brand
WordPress Websites for Engineers: Elevate Your BrandWordPress Websites for Engineers: Elevate Your Brand
WordPress Websites for Engineers: Elevate Your Brandgvaughan
 
Developer Data Modeling Mistakes: From Postgres to NoSQL
Developer Data Modeling Mistakes: From Postgres to NoSQLDeveloper Data Modeling Mistakes: From Postgres to NoSQL
Developer Data Modeling Mistakes: From Postgres to NoSQLScyllaDB
 
What's New in Teams Calling, Meetings and Devices March 2024
What's New in Teams Calling, Meetings and Devices March 2024What's New in Teams Calling, Meetings and Devices March 2024
What's New in Teams Calling, Meetings and Devices March 2024Stephanie Beckett
 
"Debugging python applications inside k8s environment", Andrii Soldatenko
"Debugging python applications inside k8s environment", Andrii Soldatenko"Debugging python applications inside k8s environment", Andrii Soldatenko
"Debugging python applications inside k8s environment", Andrii SoldatenkoFwdays
 
Story boards and shot lists for my a level piece
Story boards and shot lists for my a level pieceStory boards and shot lists for my a level piece
Story boards and shot lists for my a level piececharlottematthew16
 
Ensuring Technical Readiness For Copilot in Microsoft 365
Ensuring Technical Readiness For Copilot in Microsoft 365Ensuring Technical Readiness For Copilot in Microsoft 365
Ensuring Technical Readiness For Copilot in Microsoft 3652toLead Limited
 
"LLMs for Python Engineers: Advanced Data Analysis and Semantic Kernel",Oleks...
"LLMs for Python Engineers: Advanced Data Analysis and Semantic Kernel",Oleks..."LLMs for Python Engineers: Advanced Data Analysis and Semantic Kernel",Oleks...
"LLMs for Python Engineers: Advanced Data Analysis and Semantic Kernel",Oleks...Fwdays
 
Unraveling Multimodality with Large Language Models.pdf
Unraveling Multimodality with Large Language Models.pdfUnraveling Multimodality with Large Language Models.pdf
Unraveling Multimodality with Large Language Models.pdfAlex Barbosa Coqueiro
 
Human Factors of XR: Using Human Factors to Design XR Systems
Human Factors of XR: Using Human Factors to Design XR SystemsHuman Factors of XR: Using Human Factors to Design XR Systems
Human Factors of XR: Using Human Factors to Design XR SystemsMark Billinghurst
 
AI as an Interface for Commercial Buildings
AI as an Interface for Commercial BuildingsAI as an Interface for Commercial Buildings
AI as an Interface for Commercial BuildingsMemoori
 
Transcript: New from BookNet Canada for 2024: BNC CataList - Tech Forum 2024
Transcript: New from BookNet Canada for 2024: BNC CataList - Tech Forum 2024Transcript: New from BookNet Canada for 2024: BNC CataList - Tech Forum 2024
Transcript: New from BookNet Canada for 2024: BNC CataList - Tech Forum 2024BookNet Canada
 
Scanning the Internet for External Cloud Exposures via SSL Certs
Scanning the Internet for External Cloud Exposures via SSL CertsScanning the Internet for External Cloud Exposures via SSL Certs
Scanning the Internet for External Cloud Exposures via SSL CertsRizwan Syed
 
Vector Databases 101 - An introduction to the world of Vector Databases
Vector Databases 101 - An introduction to the world of Vector DatabasesVector Databases 101 - An introduction to the world of Vector Databases
Vector Databases 101 - An introduction to the world of Vector DatabasesZilliz
 
Dev Dives: Streamline document processing with UiPath Studio Web
Dev Dives: Streamline document processing with UiPath Studio WebDev Dives: Streamline document processing with UiPath Studio Web
Dev Dives: Streamline document processing with UiPath Studio WebUiPathCommunity
 
SIP trunking in Janus @ Kamailio World 2024
SIP trunking in Janus @ Kamailio World 2024SIP trunking in Janus @ Kamailio World 2024
SIP trunking in Janus @ Kamailio World 2024Lorenzo Miniero
 
"Federated learning: out of reach no matter how close",Oleksandr Lapshyn
"Federated learning: out of reach no matter how close",Oleksandr Lapshyn"Federated learning: out of reach no matter how close",Oleksandr Lapshyn
"Federated learning: out of reach no matter how close",Oleksandr LapshynFwdays
 
Artificial intelligence in cctv survelliance.pptx
Artificial intelligence in cctv survelliance.pptxArtificial intelligence in cctv survelliance.pptx
Artificial intelligence in cctv survelliance.pptxhariprasad279825
 
Beyond Boundaries: Leveraging No-Code Solutions for Industry Innovation
Beyond Boundaries: Leveraging No-Code Solutions for Industry InnovationBeyond Boundaries: Leveraging No-Code Solutions for Industry Innovation
Beyond Boundaries: Leveraging No-Code Solutions for Industry InnovationSafe Software
 
Designing IA for AI - Information Architecture Conference 2024
Designing IA for AI - Information Architecture Conference 2024Designing IA for AI - Information Architecture Conference 2024
Designing IA for AI - Information Architecture Conference 2024Enterprise Knowledge
 
Advanced Test Driven-Development @ php[tek] 2024
Advanced Test Driven-Development @ php[tek] 2024Advanced Test Driven-Development @ php[tek] 2024
Advanced Test Driven-Development @ php[tek] 2024Scott Keck-Warren
 

Recently uploaded (20)

WordPress Websites for Engineers: Elevate Your Brand
WordPress Websites for Engineers: Elevate Your BrandWordPress Websites for Engineers: Elevate Your Brand
WordPress Websites for Engineers: Elevate Your Brand
 
Developer Data Modeling Mistakes: From Postgres to NoSQL
Developer Data Modeling Mistakes: From Postgres to NoSQLDeveloper Data Modeling Mistakes: From Postgres to NoSQL
Developer Data Modeling Mistakes: From Postgres to NoSQL
 
What's New in Teams Calling, Meetings and Devices March 2024
What's New in Teams Calling, Meetings and Devices March 2024What's New in Teams Calling, Meetings and Devices March 2024
What's New in Teams Calling, Meetings and Devices March 2024
 
"Debugging python applications inside k8s environment", Andrii Soldatenko
"Debugging python applications inside k8s environment", Andrii Soldatenko"Debugging python applications inside k8s environment", Andrii Soldatenko
"Debugging python applications inside k8s environment", Andrii Soldatenko
 
Story boards and shot lists for my a level piece
Story boards and shot lists for my a level pieceStory boards and shot lists for my a level piece
Story boards and shot lists for my a level piece
 
Ensuring Technical Readiness For Copilot in Microsoft 365
Ensuring Technical Readiness For Copilot in Microsoft 365Ensuring Technical Readiness For Copilot in Microsoft 365
Ensuring Technical Readiness For Copilot in Microsoft 365
 
"LLMs for Python Engineers: Advanced Data Analysis and Semantic Kernel",Oleks...
"LLMs for Python Engineers: Advanced Data Analysis and Semantic Kernel",Oleks..."LLMs for Python Engineers: Advanced Data Analysis and Semantic Kernel",Oleks...
"LLMs for Python Engineers: Advanced Data Analysis and Semantic Kernel",Oleks...
 
Unraveling Multimodality with Large Language Models.pdf
Unraveling Multimodality with Large Language Models.pdfUnraveling Multimodality with Large Language Models.pdf
Unraveling Multimodality with Large Language Models.pdf
 
Human Factors of XR: Using Human Factors to Design XR Systems
Human Factors of XR: Using Human Factors to Design XR SystemsHuman Factors of XR: Using Human Factors to Design XR Systems
Human Factors of XR: Using Human Factors to Design XR Systems
 
AI as an Interface for Commercial Buildings
AI as an Interface for Commercial BuildingsAI as an Interface for Commercial Buildings
AI as an Interface for Commercial Buildings
 
Transcript: New from BookNet Canada for 2024: BNC CataList - Tech Forum 2024
Transcript: New from BookNet Canada for 2024: BNC CataList - Tech Forum 2024Transcript: New from BookNet Canada for 2024: BNC CataList - Tech Forum 2024
Transcript: New from BookNet Canada for 2024: BNC CataList - Tech Forum 2024
 
Scanning the Internet for External Cloud Exposures via SSL Certs
Scanning the Internet for External Cloud Exposures via SSL CertsScanning the Internet for External Cloud Exposures via SSL Certs
Scanning the Internet for External Cloud Exposures via SSL Certs
 
Vector Databases 101 - An introduction to the world of Vector Databases
Vector Databases 101 - An introduction to the world of Vector DatabasesVector Databases 101 - An introduction to the world of Vector Databases
Vector Databases 101 - An introduction to the world of Vector Databases
 
Dev Dives: Streamline document processing with UiPath Studio Web
Dev Dives: Streamline document processing with UiPath Studio WebDev Dives: Streamline document processing with UiPath Studio Web
Dev Dives: Streamline document processing with UiPath Studio Web
 
SIP trunking in Janus @ Kamailio World 2024
SIP trunking in Janus @ Kamailio World 2024SIP trunking in Janus @ Kamailio World 2024
SIP trunking in Janus @ Kamailio World 2024
 
"Federated learning: out of reach no matter how close",Oleksandr Lapshyn
"Federated learning: out of reach no matter how close",Oleksandr Lapshyn"Federated learning: out of reach no matter how close",Oleksandr Lapshyn
"Federated learning: out of reach no matter how close",Oleksandr Lapshyn
 
Artificial intelligence in cctv survelliance.pptx
Artificial intelligence in cctv survelliance.pptxArtificial intelligence in cctv survelliance.pptx
Artificial intelligence in cctv survelliance.pptx
 
Beyond Boundaries: Leveraging No-Code Solutions for Industry Innovation
Beyond Boundaries: Leveraging No-Code Solutions for Industry InnovationBeyond Boundaries: Leveraging No-Code Solutions for Industry Innovation
Beyond Boundaries: Leveraging No-Code Solutions for Industry Innovation
 
Designing IA for AI - Information Architecture Conference 2024
Designing IA for AI - Information Architecture Conference 2024Designing IA for AI - Information Architecture Conference 2024
Designing IA for AI - Information Architecture Conference 2024
 
Advanced Test Driven-Development @ php[tek] 2024
Advanced Test Driven-Development @ php[tek] 2024Advanced Test Driven-Development @ php[tek] 2024
Advanced Test Driven-Development @ php[tek] 2024
 

Hitchhiker’s Guide to SharePoint BI

  • 1. Hitchhiker’s Guide to SharePoint BI (and Big Data too) ◦ Andrew J. Brust, Founder and CEO, Blue Badge Insights
  • 2. Meet Andrew CEO and Founder, Blue Badge Insights Big Data blogger for ZDNet Microsoft Regional Director, MVP Co-chair VSLive! and 17 years as a speaker Founder, Microsoft BI User Group of NYC • http://www.msbinyc.com Co-moderator, NYC .NET Developers Group • http://www.nycdotnetdev.com “Redmond Review” columnist for Visual Studio Magazine and Redmond Developer News brustblog.com, Twitter: @andrewbrust 2
  • 3. Andrew’s New Blog (bit.ly/bigondata)
  • 5. The 2010 Business Intelligence Stack, Overall Business User Experience Data Infrastructure and BI Platform Analysis Services Reporting Services Integration Services Master Data Services Data Mining Data Warehousing Business Collaboration Platform Dashboards & Scorecards Excel Services Web based forms & workflow Collaboration Search Content Management LOB data integration Familiar User Experience Self-Service access & insight Data exploration & analysis Predictive analysis Data visualization Contextual visualizationBusiness Collaboration Platform Information Platform
  • 6. Today’s Stack Data Warehousing Analytical Repository Enterprise Info. Mgmt. (EIM) Analysis Tools Big Data SQL Server Enterprise, Fast Track, PDW SQL Server Analysis Services Excel, Excel Services Power View Integration Services, Master Data Services, Data Quality Services HDInsight (Hadoop)
  • 7. The 2010 Presentation Flow PerformancePoint Services Excel Services Excel SQL Server Tera- Data Oracle DB2 Reporting Services
  • 8. Agenda Excel as an analysis client PowerPivot, Excel Services Power View Reporting Services, PerformancePoint HDInsight/Hadoop (Big Data) 8
  • 9. EXCEL AS AN ANALYSIS CLIENT
  • 10. PivotStuff PivotTable, and linked charts (sometimes referred to as PivotCharts) work extremely well with OLAP cubes How to create a PivotTable: • Ribbon’s Data tab (From Other Sources button/From Analysis Services option or Existing Connections button) • Insert tab (PivotTable “split button”) How to insert a chart • PivotChart button on PivotTable Tools/Options tab • Several others
  • 11. Formula Language CUBE Functions CUBEMEMBER and CUBEVALUE • Also CUBEKPIMEMBER, CUBEMEMBERPROPERTY, CUBERANKEDMEMBER, CUBESET and CUBESETCOUNT IntelliSense style support • In a cell, type “=CU” and all CUBE formulas will display • Select one with arrow keys and hit Tab • When prompted for connection, type " and view pop-up list • Other pop-ups activate on " or "."
  • 12. At Your Service “Range Drag” and relative formula support on CUBEVALUE CUBEVALUE and Data Bars go great together Ability to convert PivotTables to formulas
  • 13. Excel as an Analysis Client
  • 15. Self-Service BI with PowerPivot Excel + Analysis Services + SharePoint Enables the working in Excel but mitigates the “spreadmart” pitfalls: • Use Analysis Services (AS) as a hidden engine •Instead of no engine • Share via SharePoint, accessible by all AS clients •Instead of “deploying” via email • Formal data refresh on server •So data doesn’t get stale, and users don’t have to make effort at updating • Allow IT to monitor •So it’s not all rogue • Provide path to more rigorous implementations •Can be upsized to Analysis Services
  • 16. How Do You Get PowerPivot? For Excel 2010: • Download the add-in from www.powerpivot.com • Get 32-bit or 64-bit version, depending on your version of Office (not Windows) • Run the installer For Excel 2013: • Requires Excel ProPlus retail product under volume license, or an Office 365 ProPlus, Enterprise E3 or E4 subscription • It’s still in add-in, installed but not activated by default • Same goes for Excel version of Power View
  • 17. PowerPivot Guidebook Table tabs View data in Excel DAX formula bar Relationship indicator Import data from almost anywhere Sort and filter Calculated column entry
  • 18. Modeling the Data KPIs Calculations Data and Diagram views Calculation area Calculation formula Sort one column by another
  • 19. Diagram View Default Aggregations Special Advanced Mode Reporting properties Hierarchies Hide specific columns and tables Create relationships visually KPIs Perspectives Calculations
  • 21. Excel Services A component of SharePoint Server 2007+; requires Enterprise CAL Allows export of workbook, worksheet, or individual items to SharePoint report library • Works great for PivotTables and Charts! • Also for sheets with CUBExxx formulas or conditional formatting-driven “scorecards” Content can be viewed in browser • Excel client not required • Drilldown interactivity maintained • Rendered in pure HTML and JavaScript • Parameterization supported
  • 22. PowerPivot Server Publish to Excel Services Viewing and interacting Data Refresh Treating as SSAS cube • 2008 R2 version: URL to .xlsx as server name • 2012 version: use POWERPIVOT named instance and treat just like SSAS • DB name is GUID-based; best to discover it Use Excel, Reporting Services as clients • And now Power View too…more later
  • 23. The IT Dashboard Increase IT efficiency: Familiar Technologies for Authoring, Sharing, Security, and Compliance Customizable IT Dashboard Visualize usage with animated charts Simplify management of SSBI content using IT Operations Dashboard for SharePoint
  • 24. SQL Server Analysis Services Two Modes: • Multidimensional (was the only mode until SQL Server 2012) • Tabular (the SSAS version of PowerPivot) Both modes query-able by various clients: • Excel • Excel Services • Reporting Services • PerformancePoint • Even PowerPivot Only Tabular mode is query-able by Power View • Power View wedded to BISM, so PowerPivot on SharePoint works too • Let’s talk about Power View now… 24
  • 26. What is Power View? Ad hoc reporting. Really! Analysis, data exploration Data Visualization In Silverlight, in the browser, in SharePoint • And now in Excel 2013, too Is actually based on SSRS • Power View makes a special RDL file
  • 27. Power View Data Sources Power View works only against BISM DirectQuery mode supported, however Support for SSAS Multidimensional cubes coming Gist is this: Power View emits DAX expressions • PowerPivot and SSAS Tabular support DAX (Data Analysis eXpressions). • SSAS Multidimensional will support DAX soon
  • 28. Create a Power View Report In Excel 2013, click Power View button on Insert tab of ribbon • Make sure add-in is activated In SharePoint, click “Create Power View Report” button or option on workbook in PowerPivot Gallery For SSAS tabular model, create BISM data source, then click its “Create Power View Report” button or option • BISM data sources can point to PowerPivot workbooks too, if you want. Can export to PowerPoint and view there
  • 31. SSRS and Report Builder Report Builder 3.0 • Familiar Microsoft Office Interface • Powerful Wizards • SharePoint list as data source • Powerful Query Designer • Flexible Layout Options w/ rich visualizations • PowerPivot as data source
  • 33. Report Parts Skilled SSRS designers can publish report parts • From Report Builder 3.0 or VS report projects End users can pick them from a gallery • A task pane, in Report Builder 3.0, with search capability • Cannot select from VS report designer What can be published?: • Tablixes (i.e. tables, matrices) • Rectangles • Images, Charts, Gauges, Maps • Parameters and Lists All aided by new ability to share Datasets and original ability to share Data Sources
  • 34. Easy to Publish; Easy to Select
  • 35. PerformancePoint Services (PPS) Scorecards Cascading scorecards with interactive charts and data from multiple sources Analytics Multi- dimensional slice and dice for advanced analytics including decomposition tree, performance map, and perspective view
  • 36. PPS Capabilities Analytic Grids & Charts • PPS’ own data visualizations • AJAX-based interactive analytics capabilities Scorecards • Key Performance Indicators • Objectives • Dimensions Dashboards • Bird’s eye view of business activities • Display Analytic Grids and Charts; Scorecards • Integrate SSRS, Excel Services (including PowerPivot) content • Add Filters
  • 38. Microsoft HDInsight Developed with Hortonworks and incorporates Hortonworks Data Platform (HDP) for Windows Windows Azure HDInsight and Microsoft HDInsight (for Windows Server) Single node preview runs on Windows client Includes ODBC Driver for Hive And Excel Add-In that uses it JavaScript MapReduce framework Contribute it all back to open source Apache Project
  • 39. The New Presentation Flow Relational Data Hadoop/HDFS Unstructured Data SSAS Tabular Power View Excel
  • 40. Thank you andrew.brust@bluebadgeinsights.com @andrewbrust on twitter Want to get on Blue Badge Insights’ list?” • Text “bluebadge” to 22828
  • 41. Blog: http://www.bobhunt.net/ Twitter: @bobhms Bob Hunt “The” Microsoft IT Pro Evangelist Blog: http://powertoe.wordpress.com/ Twitter: @toenuff Tome Tanasovski PowerShell MVP Blog: www.ngenioussolutions.com/blog Twitter: @nilaish Nilesh Mehta SharePoint Architect Blog: Too cool for one Twitter: Too cool for one Edwin Woo Windows Extremist Blog: http://ehlotech.blogspot.com Twitter:@bserebin Ben Serebin Exchange Junkie Thanks to our Organizers!
  • 42. Blog: http://www.bobhunt.net/ Twitter: @bobhms Bob Hunt “The” Microsoft IT Pro Evangelist Website: http://www.nyewin.org Twitter: @NYeWin Eric Fellen Website: http://www.nyewin.org Ken Reid Thanks to our Organizers! Jason Gallicchio SharePoint Enthusiast Twitter: @jasongall
  • 43. Techstravaganza Communities • Meetings: First Wednesday of the month, 5:30 to 7:30 PM, Microsoft NYC Office • Web: http://www.sharepointusergroup.org/NewYork/Default.aspx NYC SharePoint User Group Princeton Area SharePoint User Group NYC PowerShell User Group • Meetings: Fourth Wednesday of the month, 6:00 to 8:00 PM, Infragistics Building Cranberry NJ • Web: www.princetonsug.com • Meetings: Second Monday of the month, 6:00PM, Microsoft NYC Office • Web: http://powershellgroup.org/nyc • Meetings: Second Tuesday of the month, 5:45PM to 9PM, Microsoft NYC Office • Web: www.nyexug.com New York Exchange User Group • Meetings: First Thursday of the month, 6:00PM, Microsoft NYC Office • Web: http://www.nyewin.org/ NY Enterprise Windows User Group
  • 44. Thanks to our Sponsors! Event Sponsors
  • 45. Thanks to our User Groups! Event User Groups

Editor's Notes

  1. http://www.chegg.com/textbooks/foundations-of-sql-server-2008-r2-business-intelligence-2nd-edition-9781430233244-1430233249http://www.chegg.com/textbooks/smart-business-intelligence-solutions-with-microsoft-sql-server-2008-1st-edition-9780735625808-0735625808