Downloaded 124 times


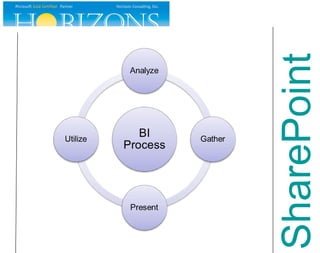
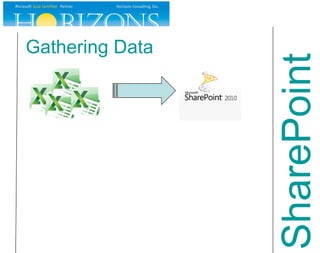
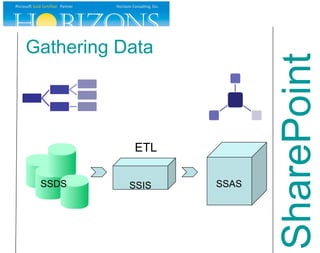

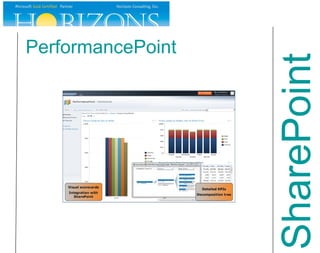
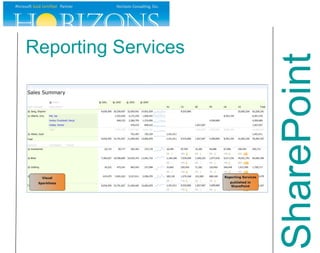
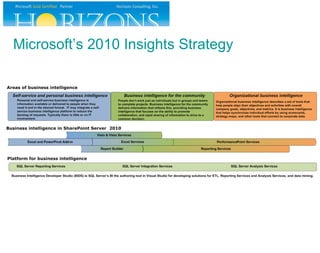
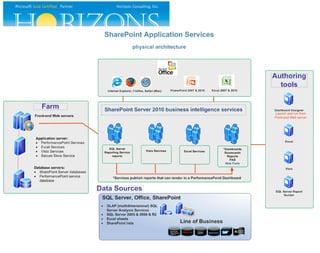


This document summarizes Microsoft's business intelligence (BI) tools for SharePoint 2010, including Excel, PowerPivot, Excel Services, Visio Services, PerformancePoint, and Reporting Services. It provides an overview of how each tool can be used to gather, analyze, and present business data in SharePoint. The document also outlines new features for some of the tools in areas like multi-user editing, interactive pivot tables, and reporting on SharePoint lists.


