Download to read offline


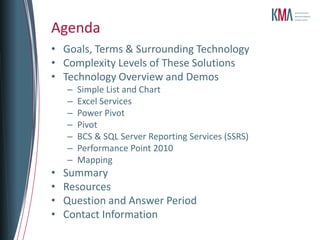


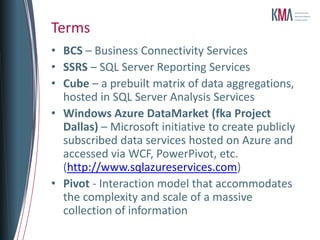


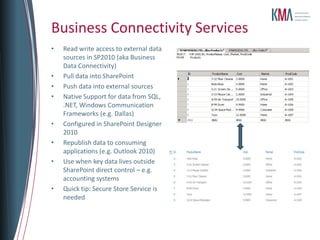


This document summarizes a presentation about data visualization in SharePoint 2010. It discusses various options for visualizing data in SharePoint, from simple charts using out-of-the-box web parts to more advanced solutions like Excel Services, PowerPivot, Pivot, and PerformancePoint. It provides an overview and demos of these techniques, highlighting the different data sources and use cases they support. The presentation aims to help users understand the appropriate visualization approach based on their specific data and needs.


