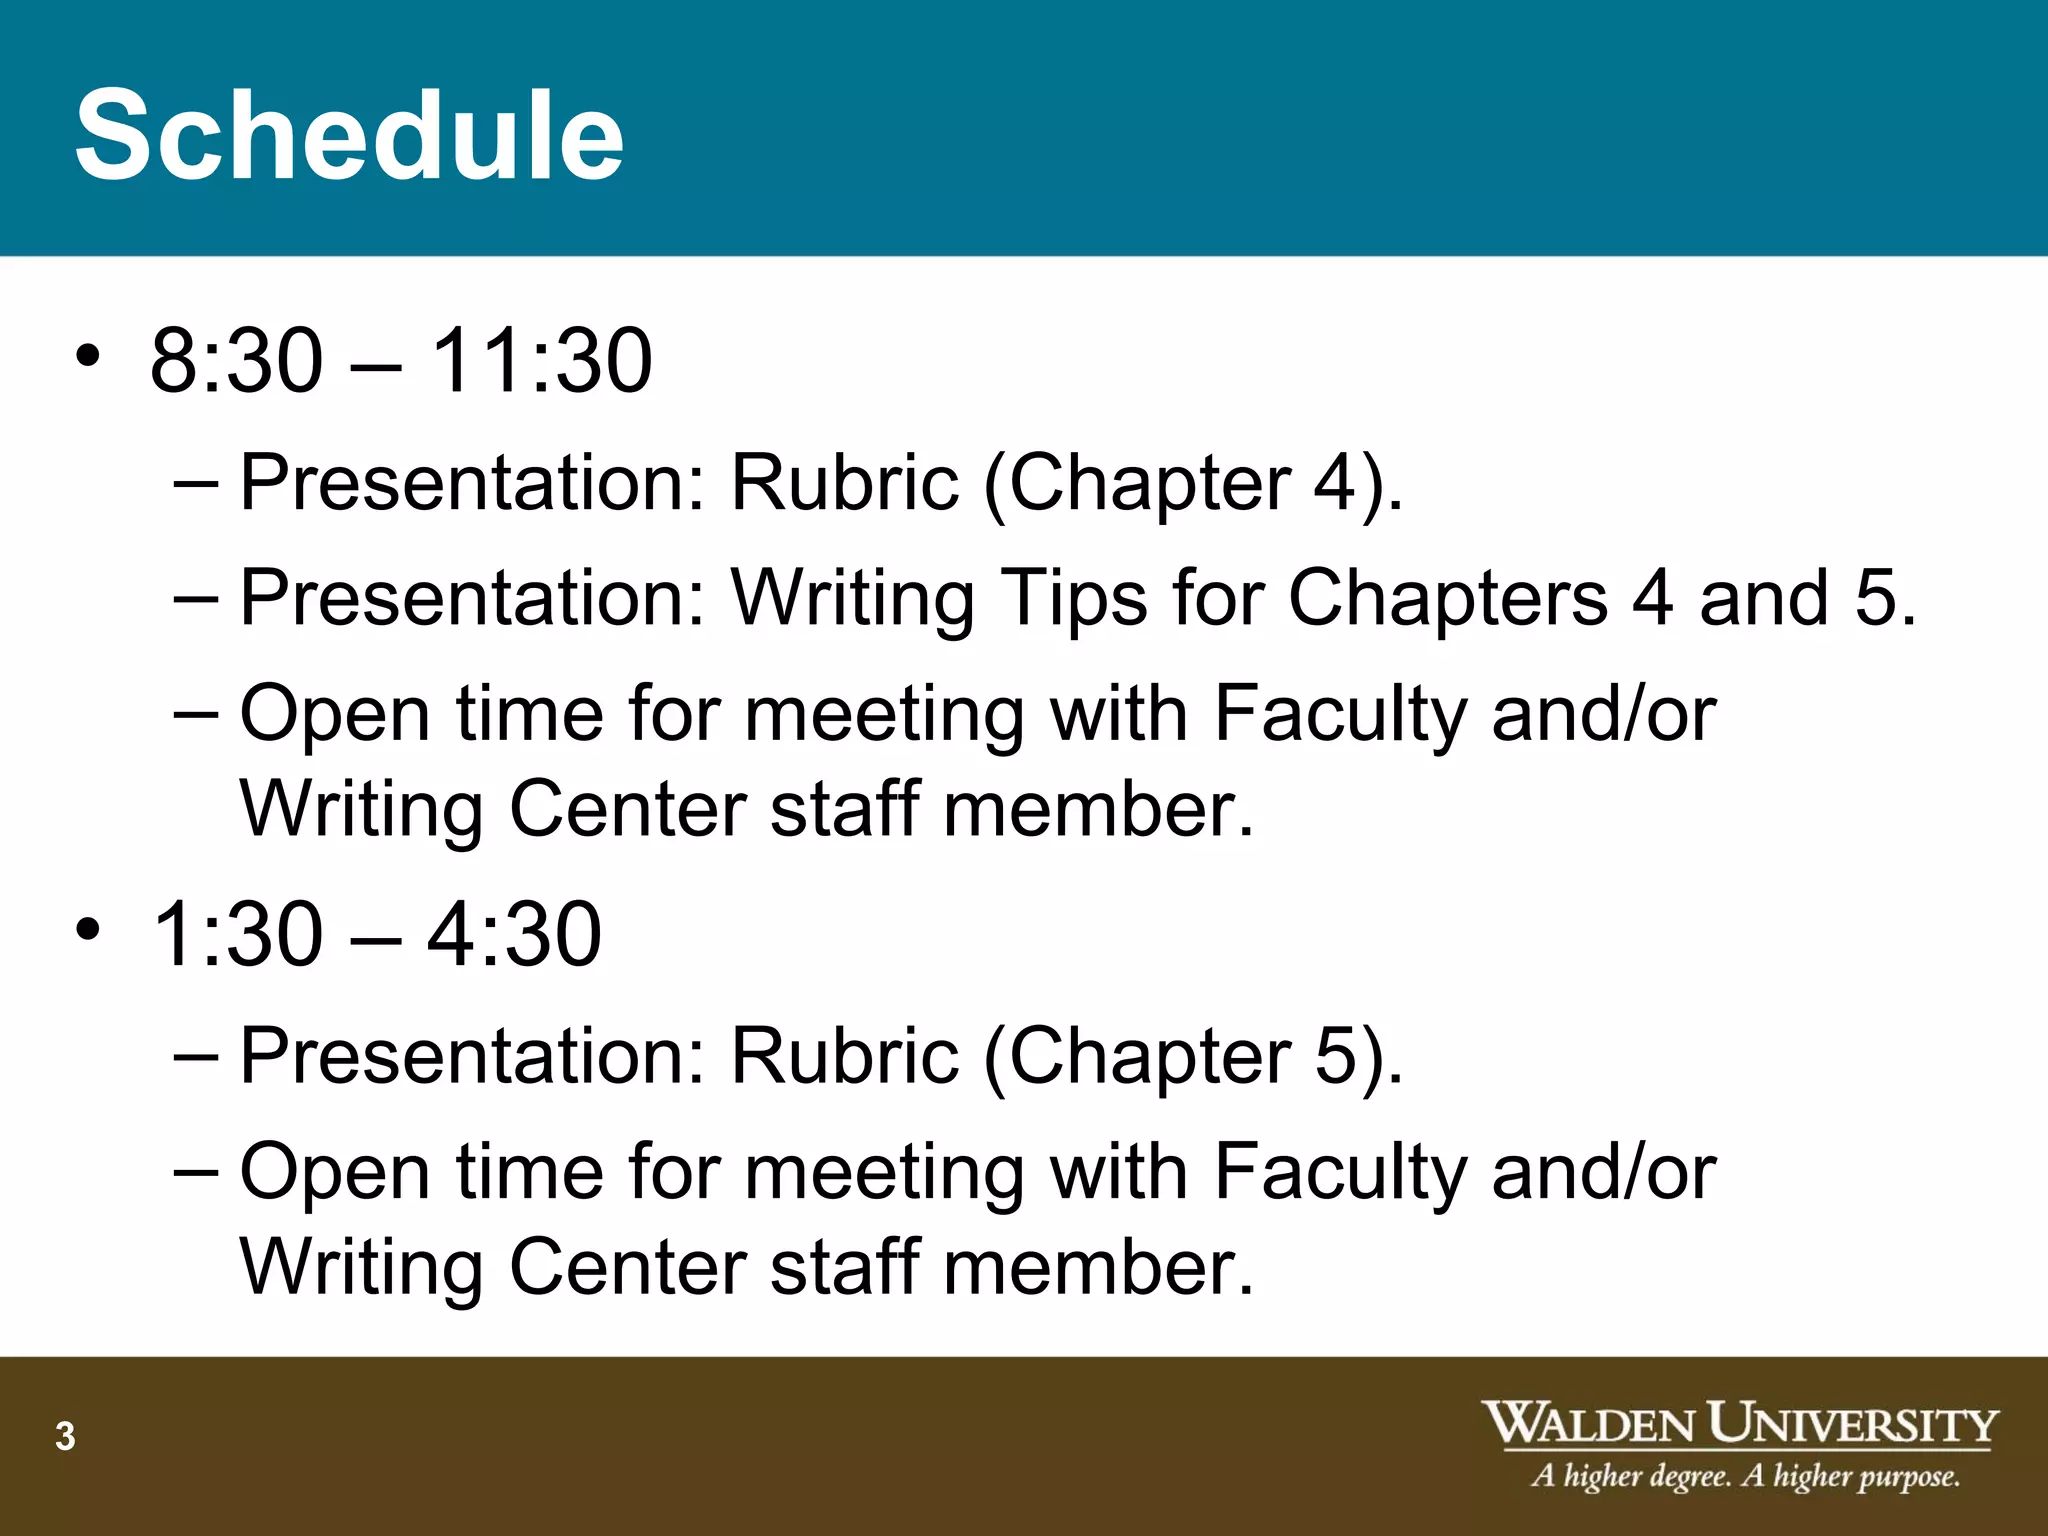
Dissertation Writing Workshop
       Chapters 4 and 5


       Gary J Burkholder, PhD
     Center for Research Support
          Annie Pezalla, MS
            Writing Center
Objectives
• Use the dissertation rubric to guide
  development of Chapters 4 and 5.
• Become familiar with and use effective
  writing tips specific to Chapters 4 and 5.


2
Schedule
• 8:30 – 11:30
    – Presentation: Rubric (Chapter 4).
    – Presentation: Writing Tips for Chapters 4 and 5.
    – Open time for meeting with Faculty and/or
      Writing Center staff member.
• 1:30 – 4:30
    – Presentation: Rubric (Chapter 5).
    – Open time for meeting with Faculty and/or
      Writing Center staff member.
3
Optimizing your Experience
• Attend to key points of the presentations.
• Ask questions!
• Maximize meeting times with faculty and writing
  center staff member to get questions answered
  related to writing your dissertation.
• Write as much as possible while you are onsite.
• Utilize faculty and writing center advising during the
  remainder of your stay to continue writing. Try to
  finish a draft of one or both chapters while you are
  onsite.
4
Dissertation Chapter 4


5
Overall Goal for Chapter 4
• Presentation of the results.
    – Description of demographics.
    – Results of inferential analyses (Quantitative).
    – Results of text analyses (Qualitative).


6
Quantitative


7
Organization
• Chapter 4 is structured around the research
  questions and/or hypotheses addressed in
  the study, reporting the findings related to
  each.


8
Research Tools
• Data collection instruments have been used
  correctly.
• Measures obtained are reported clearly,
  following standard procedures.
• Adjustments or revisions to the use of
  standardized instruments have been
  justified, and any effects on interpretation of
  findings are clearly described.

9
Consistency of Analyses
• Overall, data analysis (presentation,
  interpretation, explanation) is consistent with
  research questions or hypotheses and
  underlying theoretical conceptual framework
  for the study.
     – Check: Consistency of hypothesis/research
       questions between Chapters 1, 3, and 4.
     – Check: Are the analyses consistent with what
       was proposed in Chapter 3?

10
Data Analyses
• Logically and sequentially address all
  research questions or hypotheses.
• Where appropriate, outcomes of hypothesis
  testing procedures are clearly reported (e.g.,
  findings support or fail to support).
• Does not contain any evident statistical
  errors.


11
Tables and Figures
• As self-descriptive as possible, informative,
  and conform to standard dissertation format.
• Are directly related to and referred to within
  the narrative text included in the chapter.
• Have immediate adjacent comments.
     – For example, any table notes are at the bottom.
• Are properly titled and captioned.
• Show copyright permission if not in the public
  domain.
12
Consistency of Findings
• The comments on the findings address
  observed consistencies and inconsistencies
  and discuss possible alternate
  interpretations.


13
Conclusion
• In a concluding section of Chapter 4,
  outcomes are logically and systematically
  summarized and interpreted in relation to
  their importance to the research questions
  and hypotheses.


14
Qualitative


15
Data
• The process by which data were generated,
  gathered, and recorded is identified.
• The systems for keeping track of data and
  emerging understandings (research logs,
  reflective journals, cataloging systems) are
  clearly described.


16
Findings
• Build logically from the problem and the research
  design.
• Are presented in a manner that addresses the
  research questions.
• Discrepant cases and non-confirming data are
  included in the findings.
• Patterns, relationships, and themes described as
  findings are supported by the data. All salient data
  are accounted for in the findings.


17
Evidence of Quality
• A discussion on evidence of quality shows
  how this study followed procedures to assure
  accuracy of the data (e.g., trustworthiness,
  member checks, triangulation, etc.).
  Appropriate evidence occurs in the
  appendixes (sample transcripts, researcher
  logs, field notes, etc.). (May appear in
  chapter 5.)


18
5 Writing Tips for Chapter 4


19
Tip # 1: Select the right tool for
               the right job
• You have 3 main tools for presenting your results:
  prose, tables, and figures. Your choice of tools
  depends on several things.

     – How many numbers you need to report.
     – How much time (or patience) your audience will
       have to grasp your data.
     – Whether your readers need exact values.


20
Tables vs. Text
• Only use tables to simplify text that otherwise would be dense
  with numbers.
• From your APA manual:
   (Dense)

     – The mean final errors (with standard deviations in
       parentheses) for the Age x Level of Difficulty interaction were .
       05, (.08), .05 (.07), and .11 (.10) for the younger participants
       and .14 (.15), .17 (.15), and .26 (.21) for the older participants
       at low, moderate, and high levels of difficulty, respectively.


21
Tables vs. Text
• Only use tables to simplify text that otherwise would be dense
  with numbers.
• From your APA manual:
   (Better)

                                                Standard
                    Mean error rate             deviation               Sample size
     Level of     Younger       Older   Younger             Older   Younger      Older
     difficulty

     Low            .05          .14      .08                .15      12              18

     Moderate       .05          .17      .07                .15      15              12

     High           .11          .26      .10                .21      16              14


22
Tip #2: Summarize patterns
•    Find a generalization that fits most of the data.
•    Report a few illustrative numbers from the
     associated table or figure.
•    Describe exceptions to the general pattern.
       - DO NOT repeat all the numbers in a table.


23
An example report…
 Of the total superintendents surveyed, 61 (39.1%) had obtained a
 doctorate degree. Within this category, 34 (55.7%) were servant leaders,
 and 27 (44.3%) were nonservant leaders. A total of 15 superintendents
 were education specialists, an official title defined in this state as having
 all of their doctoral credits for formal coursework; however, deficient the
 credits and final product of a doctoral study. Within this cohort of 15, 7
 (46.7%) were servant leaders, and 8 (53.3%) were nonservant leaders. In
 the most widespread category of this demographic, 80 (51.3%)
 superintendents had obtained a master’s degree as their highest level of
 formal education. Of these superintendents, 38 (47.5%) were designated
 servant leaders, and 42 (52.5%) as nonservant leaders. Table 10 presents
 a visual summary of the data from SASL response data.


24
The corresponding table…
Table 10
Self-Assessment of Servant Leadership Information for Highest Academic Degree
Obtained Results

                                                                       Total
                              Servant leaders   Nonservant leaders
     Highest degree
        obtained          N               %       N          %            N       %
                   BA          0          0       0                0      0       0
                   MA         38        47.50     42          52.5        80     51.3
        Ed. Specialist         7         46.7     8         53.3          15   9.63
              Doctorate       34         55.7     27        44.3          61   39.1
     Totals
                              79                  77                     156


25
A better report
Of the total superintendents surveyed (N = 156), 61 had
obtained a doctorate degree, and about half of this
group were servant leaders (n = 34). Eighty
superintendents had obtained a master’s degree as
their highest level of formal education; about half of this
group, too, were servant leaders (n = 38). Table 10
presents a visual summary of the data from SASL
response data.


26
A better table
                 Servant leaders   Nonservant leaders   Total

Highest degree
   obtained      n           %       n          %           N     %
MA               38         47.5     42        52.5        80    51.3
Ed. Specialist   7          46.7     8         53.3        15    9.6
Doctorate        34         55.7     27        44.3        61    39.1

Totals           79                  77                    156


27
Tip # 3: Define your terms
 •       Reporting results often requires technical
         language. To make sure that your readers
         comprehend your information, define your terms,
         acronyms, and symbols.
     -     Unfamiliar terms (“opportunity cost,” standardized
           mortality ratio,” SES, LBW, PSA, etc.)
     -     Terms that have more than one meaning (significant,
           considerable, appreciable, big, etc.)

 •       How do you know what to define?
     –     Carpenter analogy

28
Tip # 4: Avoid regressive
     material
•     Your readers don’t need a detailed description of
      how you approached writing up p = .08, the steps
      to calculate a mean, why you right-justified the
      numbers in your table, or why you chose a
      stacked bar chart rather than a pie chart.

•     Make those decisions, do those calculations, and
      create your charts and tables, but don’t write
      about how or why you did so. Instead, present the
      fruits of those labors, following the examples from
      your favorite article or published Walden
      dissertation.

29
Tip # 5: Accept the need for
     revision
• Embrace the fact that writing your results
  will be an iterative process.
     -   Draft tables and charts with a pencil and paper before
         creating a computerized version.
     -   Outline key findings before you describe a complex
         pattern.


30
Dissertation Chapter 5


31
Overall Goal for Chapter 5
• Analysis of results in the context of the
  literature described in Chapter 2.
• Implications for further research, practice,
  and social change.


32
Introduction
• The chapter begins with a brief overview of
  why and how the study was done, reviewing
  the questions or issues being addressed and
  a brief summary of the findings.


33
Interpretations of the Findings
• Includes conclusions that address all of the
  research questions.
• Contains references to outcomes in Ch. 4.
• Covers all the data.
• Is bounded by the evidence collected.
• Relates the findings to a larger body of
  literature on the topic, including the
  conceptual/theoretical framework.

34
Implications for Social Change
• The Implications for Social Change are
  clearly grounded in the significance section
  of Chapter 1 and outcomes presented in
  Chapter 4. The implications are expressed in
  terms of tangible improvements to
  individuals, communities, organizations,
  institutions, cultures, or societies.


35
Recommendations
• Action
     – Should flow logically from the conclusions and
       contain steps to useful action.
     – State who needs to pay attention to the results.
     – Indicate how the results might be disseminated.
• Further Study
     – Point to topics that need closer examination and
       may generate a new round of questions.


36
Qualitative Studies
• Includes a reflection on the researcher's
  experience with the research process in
  which the researcher discusses possible
  personal biases or preconceived ideas and
  values, the possible effects of the researcher
  on the participants or the situation, and
  her/his changes in thinking as a result of the
  study.


37
Conclusion
• The work closes with a strong concluding
  statement making the “take-home message”
  clear to the reader.


38
5 Writing Tips for Chapter 5


39
Tip # 6: Avoid generalizations
•     Generalizations encourage blanket or sweeping
      statements.
     – Ex: “All” “Every” “None” “Never”


40
Tip # 7: Address
counterargument
• Pretending there are not two sides does not make
  one side true.
     – “After I interviewed the teachers at Alpha School, I
       discovered that all teachers hate the No Child Left
       Behind Act” (Pezalla, 2010, p. 9).
• Tackle the best points of the other side.
• Look for intersections.
• This is not a cage match; it is research.


41
Tip # 8: Avoid Logical Fallacies

• Slippery slope fallacy:
  – If we commit to Action A, it will invariably lead to
     dramatic and negative Outcome Z (A>Z).
  – If we do not work with at-risk middle school boys
     in reading, they will inevitably end up in jail.
• Correlation vs. causation confusion:
  – “After the remedy, test scores improved”
    (Pezalla, 2010, p. 20).
  – The rooster crowing before dawn does not mean
    that his noise made the sun rise.
42
Tip # 9: Be humble

     • Avoid praising yourself too much.
       – Ex: The methods outlined in chapter 3 represent a
         major breakthrough in the design of distributed
         systems…”


43
Tip # 10: Acknowledge your
good work
     • Avoid criticizing yourself too much.
       – Ex: “Although the technique employed in the current
         study was not earthshaking…”


44
Rubric Writing Quality Indicator
• Writing Style and Composition:
     – Written in scholarly language (accurate, balanced,
       objective, tentative). The writing is clear, precise, and
       avoids redundancy. Statements are specific and topical
       sentences are established for paragraphs. The flow of
       words is smooth and comprehensible. Bridges are
       established between ideas.

     – Scored on a Likert scale, ranging from 1 (must be revised
       and resubmitted) to 5 (approved with commendation)


45
Rubric Writing Quality Indicator
• Organization and Form:
     – Is logically and comprehensive organized, using
       subheadings where appropriate
     – Has a professional, scholarly appearance
     – Is written with correct grammar, punctuation, and spelling
     – Includes citations for the following: Direct quotes,
       paraphrasing, facts, and references to research studies
     – Includes in-text citations in the reference list.

     Scored on a Likert scale, ranging from 1 (must be revised
       and resubmitted) to 5 (approved with commendation)

46

Writing chapters 4_and_5

  • 1.
    Dissertation Writing Workshop Chapters 4 and 5 Gary J Burkholder, PhD Center for Research Support Annie Pezalla, MS Writing Center
  • 2.
    Objectives • Use thedissertation rubric to guide development of Chapters 4 and 5. • Become familiar with and use effective writing tips specific to Chapters 4 and 5. 2
  • 3.
    Schedule • 8:30 –11:30 – Presentation: Rubric (Chapter 4). – Presentation: Writing Tips for Chapters 4 and 5. – Open time for meeting with Faculty and/or Writing Center staff member. • 1:30 – 4:30 – Presentation: Rubric (Chapter 5). – Open time for meeting with Faculty and/or Writing Center staff member. 3
  • 4.
    Optimizing your Experience •Attend to key points of the presentations. • Ask questions! • Maximize meeting times with faculty and writing center staff member to get questions answered related to writing your dissertation. • Write as much as possible while you are onsite. • Utilize faculty and writing center advising during the remainder of your stay to continue writing. Try to finish a draft of one or both chapters while you are onsite. 4
  • 5.
  • 6.
    Overall Goal forChapter 4 • Presentation of the results. – Description of demographics. – Results of inferential analyses (Quantitative). – Results of text analyses (Qualitative). 6
  • 7.
  • 8.
    Organization • Chapter 4is structured around the research questions and/or hypotheses addressed in the study, reporting the findings related to each. 8
  • 9.
    Research Tools • Datacollection instruments have been used correctly. • Measures obtained are reported clearly, following standard procedures. • Adjustments or revisions to the use of standardized instruments have been justified, and any effects on interpretation of findings are clearly described. 9
  • 10.
    Consistency of Analyses •Overall, data analysis (presentation, interpretation, explanation) is consistent with research questions or hypotheses and underlying theoretical conceptual framework for the study. – Check: Consistency of hypothesis/research questions between Chapters 1, 3, and 4. – Check: Are the analyses consistent with what was proposed in Chapter 3? 10
  • 11.
    Data Analyses • Logicallyand sequentially address all research questions or hypotheses. • Where appropriate, outcomes of hypothesis testing procedures are clearly reported (e.g., findings support or fail to support). • Does not contain any evident statistical errors. 11
  • 12.
    Tables and Figures •As self-descriptive as possible, informative, and conform to standard dissertation format. • Are directly related to and referred to within the narrative text included in the chapter. • Have immediate adjacent comments. – For example, any table notes are at the bottom. • Are properly titled and captioned. • Show copyright permission if not in the public domain. 12
  • 13.
    Consistency of Findings •The comments on the findings address observed consistencies and inconsistencies and discuss possible alternate interpretations. 13
  • 14.
    Conclusion • In aconcluding section of Chapter 4, outcomes are logically and systematically summarized and interpreted in relation to their importance to the research questions and hypotheses. 14
  • 15.
  • 16.
    Data • The processby which data were generated, gathered, and recorded is identified. • The systems for keeping track of data and emerging understandings (research logs, reflective journals, cataloging systems) are clearly described. 16
  • 17.
    Findings • Build logicallyfrom the problem and the research design. • Are presented in a manner that addresses the research questions. • Discrepant cases and non-confirming data are included in the findings. • Patterns, relationships, and themes described as findings are supported by the data. All salient data are accounted for in the findings. 17
  • 18.
    Evidence of Quality •A discussion on evidence of quality shows how this study followed procedures to assure accuracy of the data (e.g., trustworthiness, member checks, triangulation, etc.). Appropriate evidence occurs in the appendixes (sample transcripts, researcher logs, field notes, etc.). (May appear in chapter 5.) 18
  • 19.
    5 Writing Tipsfor Chapter 4 19
  • 20.
    Tip # 1:Select the right tool for the right job • You have 3 main tools for presenting your results: prose, tables, and figures. Your choice of tools depends on several things. – How many numbers you need to report. – How much time (or patience) your audience will have to grasp your data. – Whether your readers need exact values. 20
  • 21.
    Tables vs. Text •Only use tables to simplify text that otherwise would be dense with numbers. • From your APA manual: (Dense) – The mean final errors (with standard deviations in parentheses) for the Age x Level of Difficulty interaction were . 05, (.08), .05 (.07), and .11 (.10) for the younger participants and .14 (.15), .17 (.15), and .26 (.21) for the older participants at low, moderate, and high levels of difficulty, respectively. 21
  • 22.
    Tables vs. Text •Only use tables to simplify text that otherwise would be dense with numbers. • From your APA manual: (Better) Standard Mean error rate deviation Sample size Level of Younger Older Younger Older Younger Older difficulty Low .05 .14 .08 .15 12 18 Moderate .05 .17 .07 .15 15 12 High .11 .26 .10 .21 16 14 22
  • 23.
    Tip #2: Summarizepatterns • Find a generalization that fits most of the data. • Report a few illustrative numbers from the associated table or figure. • Describe exceptions to the general pattern. - DO NOT repeat all the numbers in a table. 23
  • 24.
    An example report… Of the total superintendents surveyed, 61 (39.1%) had obtained a doctorate degree. Within this category, 34 (55.7%) were servant leaders, and 27 (44.3%) were nonservant leaders. A total of 15 superintendents were education specialists, an official title defined in this state as having all of their doctoral credits for formal coursework; however, deficient the credits and final product of a doctoral study. Within this cohort of 15, 7 (46.7%) were servant leaders, and 8 (53.3%) were nonservant leaders. In the most widespread category of this demographic, 80 (51.3%) superintendents had obtained a master’s degree as their highest level of formal education. Of these superintendents, 38 (47.5%) were designated servant leaders, and 42 (52.5%) as nonservant leaders. Table 10 presents a visual summary of the data from SASL response data. 24
  • 25.
    The corresponding table… Table10 Self-Assessment of Servant Leadership Information for Highest Academic Degree Obtained Results Total Servant leaders Nonservant leaders Highest degree obtained N % N % N % BA 0 0 0 0 0 0 MA 38 47.50 42 52.5 80 51.3 Ed. Specialist 7 46.7 8 53.3 15 9.63 Doctorate 34 55.7 27 44.3 61 39.1 Totals 79 77 156 25
  • 26.
    A better report Ofthe total superintendents surveyed (N = 156), 61 had obtained a doctorate degree, and about half of this group were servant leaders (n = 34). Eighty superintendents had obtained a master’s degree as their highest level of formal education; about half of this group, too, were servant leaders (n = 38). Table 10 presents a visual summary of the data from SASL response data. 26
  • 27.
    A better table Servant leaders Nonservant leaders Total Highest degree obtained n % n % N % MA 38 47.5 42 52.5 80 51.3 Ed. Specialist 7 46.7 8 53.3 15 9.6 Doctorate 34 55.7 27 44.3 61 39.1 Totals 79 77 156 27
  • 28.
    Tip # 3:Define your terms • Reporting results often requires technical language. To make sure that your readers comprehend your information, define your terms, acronyms, and symbols. - Unfamiliar terms (“opportunity cost,” standardized mortality ratio,” SES, LBW, PSA, etc.) - Terms that have more than one meaning (significant, considerable, appreciable, big, etc.) • How do you know what to define? – Carpenter analogy 28
  • 29.
    Tip # 4:Avoid regressive material • Your readers don’t need a detailed description of how you approached writing up p = .08, the steps to calculate a mean, why you right-justified the numbers in your table, or why you chose a stacked bar chart rather than a pie chart. • Make those decisions, do those calculations, and create your charts and tables, but don’t write about how or why you did so. Instead, present the fruits of those labors, following the examples from your favorite article or published Walden dissertation. 29
  • 30.
    Tip # 5:Accept the need for revision • Embrace the fact that writing your results will be an iterative process. - Draft tables and charts with a pencil and paper before creating a computerized version. - Outline key findings before you describe a complex pattern. 30
  • 31.
  • 32.
    Overall Goal forChapter 5 • Analysis of results in the context of the literature described in Chapter 2. • Implications for further research, practice, and social change. 32
  • 33.
    Introduction • The chapterbegins with a brief overview of why and how the study was done, reviewing the questions or issues being addressed and a brief summary of the findings. 33
  • 34.
    Interpretations of theFindings • Includes conclusions that address all of the research questions. • Contains references to outcomes in Ch. 4. • Covers all the data. • Is bounded by the evidence collected. • Relates the findings to a larger body of literature on the topic, including the conceptual/theoretical framework. 34
  • 35.
    Implications for SocialChange • The Implications for Social Change are clearly grounded in the significance section of Chapter 1 and outcomes presented in Chapter 4. The implications are expressed in terms of tangible improvements to individuals, communities, organizations, institutions, cultures, or societies. 35
  • 36.
    Recommendations • Action – Should flow logically from the conclusions and contain steps to useful action. – State who needs to pay attention to the results. – Indicate how the results might be disseminated. • Further Study – Point to topics that need closer examination and may generate a new round of questions. 36
  • 37.
    Qualitative Studies • Includesa reflection on the researcher's experience with the research process in which the researcher discusses possible personal biases or preconceived ideas and values, the possible effects of the researcher on the participants or the situation, and her/his changes in thinking as a result of the study. 37
  • 38.
    Conclusion • The workcloses with a strong concluding statement making the “take-home message” clear to the reader. 38
  • 39.
    5 Writing Tipsfor Chapter 5 39
  • 40.
    Tip # 6:Avoid generalizations • Generalizations encourage blanket or sweeping statements. – Ex: “All” “Every” “None” “Never” 40
  • 41.
    Tip # 7:Address counterargument • Pretending there are not two sides does not make one side true. – “After I interviewed the teachers at Alpha School, I discovered that all teachers hate the No Child Left Behind Act” (Pezalla, 2010, p. 9). • Tackle the best points of the other side. • Look for intersections. • This is not a cage match; it is research. 41
  • 42.
    Tip # 8:Avoid Logical Fallacies • Slippery slope fallacy: – If we commit to Action A, it will invariably lead to dramatic and negative Outcome Z (A>Z). – If we do not work with at-risk middle school boys in reading, they will inevitably end up in jail. • Correlation vs. causation confusion: – “After the remedy, test scores improved” (Pezalla, 2010, p. 20). – The rooster crowing before dawn does not mean that his noise made the sun rise. 42
  • 43.
    Tip # 9:Be humble • Avoid praising yourself too much. – Ex: The methods outlined in chapter 3 represent a major breakthrough in the design of distributed systems…” 43
  • 44.
    Tip # 10:Acknowledge your good work • Avoid criticizing yourself too much. – Ex: “Although the technique employed in the current study was not earthshaking…” 44
  • 45.
    Rubric Writing QualityIndicator • Writing Style and Composition: – Written in scholarly language (accurate, balanced, objective, tentative). The writing is clear, precise, and avoids redundancy. Statements are specific and topical sentences are established for paragraphs. The flow of words is smooth and comprehensible. Bridges are established between ideas. – Scored on a Likert scale, ranging from 1 (must be revised and resubmitted) to 5 (approved with commendation) 45
  • 46.
    Rubric Writing QualityIndicator • Organization and Form: – Is logically and comprehensive organized, using subheadings where appropriate – Has a professional, scholarly appearance – Is written with correct grammar, punctuation, and spelling – Includes citations for the following: Direct quotes, paraphrasing, facts, and references to research studies – Includes in-text citations in the reference list. Scored on a Likert scale, ranging from 1 (must be revised and resubmitted) to 5 (approved with commendation) 46

Editor's Notes

  • #21 The Role of Statistics in Research Walden University Ph.D. Residency - Minneapolis, MN July 2008 For in-depth analysis of specific numeric values, use a detailed table. To show a general pattern, use a figure. A picture (or figure) can be worth a thousand words: It can capture vast amounts of information more succinctly than prose, and illustrate the size of a difference or the direction of a trend more powerfully than a table.
  • #24 The Role of Statistics in Research Walden University Ph.D. Residency - Minneapolis, MN July 2008 The numbers you present, whether in text, tables, or charts, are meant to provide evidence about some issue or question. However, if you merely provide a table or chart, you leave it to your readers to figure out for themselves what that evidence says. Instead, digest the patterns to help readers see the general relationship in the table or chart.
  • #25 The Role of Statistics in Research Walden University Ph.D. Residency - Minneapolis, MN July 2008 Note the overly detailed content of this report. Every number in the corresponding table (next slide) is explained in this narrative.
  • #29 The Role of Statistics in Research Walden University Ph.D. Residency - Minneapolis, MN July 2008
  • #30 The Role of Statistics in Research Walden University Ph.D. Residency - Minneapolis, MN July 2008
  • #31 The Role of Statistics in Research Walden University Ph.D. Residency - Minneapolis, MN July 2008
  • #41 The Role of Statistics in Research Walden University Ph.D. Residency - Minneapolis, MN July 2008 This slide addresses the myth that dissertations aren’t supposed to be persuasive. They ARE. But students often think that, to be persuasive, they need to make BOLD claims. This is a dangerous stance, since bold claims often mean making either/or choices. When it comes time to emphasize the significance of your findings, be careful that you don’t get yourself trapped in a simplistic argument. If you’re doing a study on teacher perspectives on NCLB and you discover that teachers are frustrated with the legislation, avoid making claims that NCLB is inherently bad. Don’t exclude the possible counterarguments of the argument. And when it comes time to articulate how your findings might be applicable to others, be careful of making generalizations that aren’t supported by your data. You should remind readers, and yourself, of the exact boundaries of generalization. If you have random sample data on Arizona city managers, you don’t want to generalize to American city managers unless you’ve demonstrated that those in Arizona are similar in important respects to national averages for city managers.
  • #42 The Role of Statistics in Research Walden University Ph.D. Residency - Minneapolis, MN July 2008 When students try to be persuasive, they often ignore the published findings that argue AGAINST their own claims. Don’t do this. It’s important to recognize both sides of the issue. Your work will be stronger if you acknowledge the other side of things.
  • #43 The Role of Statistics in Research Walden University Ph.D. Residency - Minneapolis, MN July 2008 If we eliminate NCLB from our schools, student achievement will increase. How will we assess student achievement across schools? How will we know what teachers are teaching? How will we know how to help schools that are struggling?
  • #44 The Role of Statistics in Research Walden University Ph.D. Residency - Minneapolis, MN July 2008 Err on the side of humility, but don’t forget to acknowledge what you’ve done. You’ve made a contribution!
  • #45 The Role of Statistics in Research Walden University Ph.D. Residency - Minneapolis, MN July 2008 Err on the side of humility, but don’t forget to acknowledge what you’ve done. You’ve made a contribution!
  • #46 The Role of Statistics in Research Walden University Ph.D. Residency - Minneapolis, MN July 2008
  • #47 The Role of Statistics in Research Walden University Ph.D. Residency - Minneapolis, MN July 2008