Downloaded 81 times


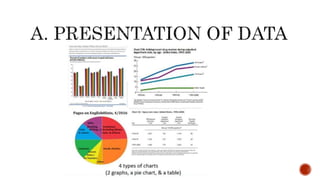


1) The document discusses the presentation, analysis, and interpretation of data. It describes different methods of presenting data visually through tables, charts, graphs and scatter plots to show relationships between data sets. 2) Analyzing data involves converting raw data into useful information for decision making. Both qualitative and quantitative techniques are discussed. Qualitative analysis explores non-numerical data through content and discourse analysis while quantitative analysis uses mathematical tools to manipulate numerical data. 3) Interpreting data involves reviewing it using various methods to arrive at relevant conclusions and answer critical questions. The goal of interpretation depends on the type of data and business needs.