WHAT IS
RECTANGULAR
COORDINATE
SYSTEM?
The rectangularcoordinate system is a set of two
intersecting and perpendicular axes forming an xy-plane.
The rectangular coordinate system is likewise known as the Cartesian
coordinate system named after Rene Descartes, a French Philosopher and
mathematician who popularized its use in analytic geometry.
3.
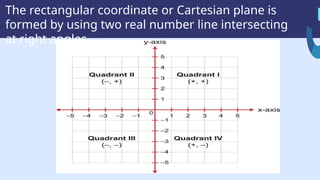
The rectangular coordinateor Cartesian plane is
formed by using two real number line intersecting
at right angles.
4.
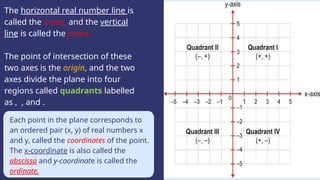
The horizontal realnumber line is
called the x-axis, and the vertical
line is called the y-axis.
The point of intersection of these
two axes is the origin, and the two
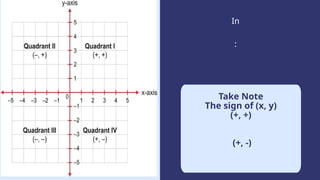
axes divide the plane into four
regions called quadrants labelled
as , , and .
Each point in the plane corresponds to
an ordered pair (x, y) of real numbers x
and y, called the coordinates of the point.
The x-coordinate is also called the
abscissa and y-coordinate is called the
ordinate.
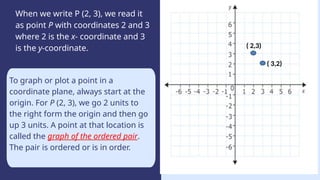
When we writeP (2, 3), we read it
as point P with coordinates 2 and 3
where 2 is the x- coordinate and 3
is the y-coordinate.
To graph or plot a point in a
coordinate plane, always start at the
origin. For P (2, 3), we go 2 units to
the right form the origin and then go
up 3 units. A point at that location is
called the graph of the ordered pair.
The pair is ordered or is in order.
( 2,3)
( 3,2)
7.
Let’s explore different
wayswe can represent
data!
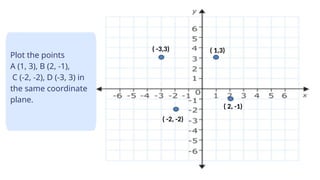
Plot the points
A (1, 3), B (2, -1),
C (-2, -2), D (-3, 3) in
the same coordinate
plane.
( 1,3)
( 2, -1)
( -2, -2)
( -3,3)
8.
Let’s explore different
wayswe can represent
data!
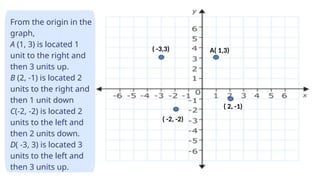
From the origin in the
graph,
A (1, 3) is located 1
unit to the right and
then 3 units up.
B (2, -1) is located 2
units to the right and
then 1 unit down
C(-2, -2) is located 2
units to the left and
then 2 units down.
D( -3, 3) is located 3
units to the left and
then 3 units up.
A( 1,3)
( 2, -1)
( -2, -2)
( -3,3)
9.
Let’s explore different
wayswe can represent
data!
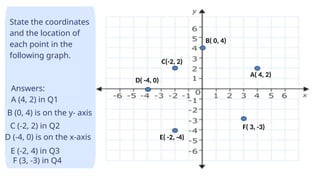
State the coordinates
and the location of
each point in the
following graph.
B( 0, 4)
A( 4, 2)
E( -2, -4)
C(-2, 2)
Answers:
A (4, 2) in Q1
F( 3, -3)
D( -4, 0)
B (0, 4) is on the y- axis
C (-2, 2) in Q2
D (-4, 0) is on the x-axis
E (-2, 4) in Q3
F (3, -3) in Q4
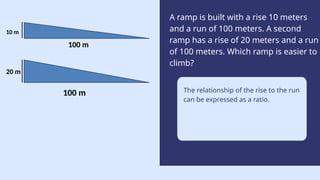
A ramp isbuilt with a rise 10 meters
and a run of 100 meters. A second
ramp has a rise of 20 meters and a run
of 100 meters. Which ramp is easier to
climb?
The relationship of the rise to the run
can be expressed as a ratio.
100 m
20 m
10 m
100 m
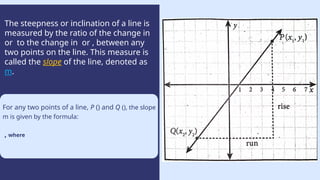
12.
The steepness orinclination of a line is
measured by the ratio of the change in
or to the change in or , between any
two points on the line. This measure is
called the slope of the line, denoted as
m.
Use a histogram when you
have data in different ranges,
like measuring the heights of
people in your class.
Height (centimetres)
For any two points of a line, P () and Q (), the slope
m is given by the formula:
, where
13.
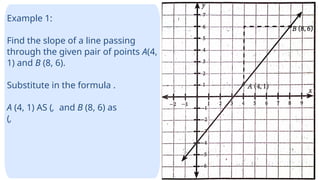
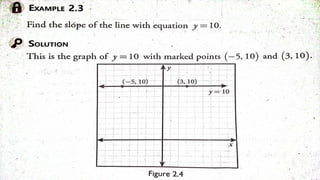
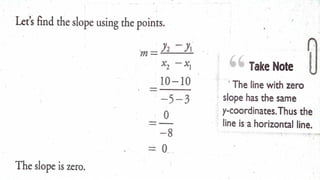
Example 1:
Find theslope of a line passing
through the given pair of points A(4,
1) and B (8, 6).
Substitute in the formula .
A (4, 1) AS (, and B (8, 6) as
(,
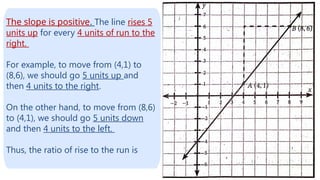
14.
The slope ispositive. The line rises 5
units up for every 4 units of run to the
right.
For example, to move from (4,1) to
(8,6), we should go 5 units up and
then 4 units to the right.
On the other hand, to move from (8,6)
to (4,1), we should go 5 units down
and then 4 units to the left.
Thus, the ratio of rise to the run is
15.
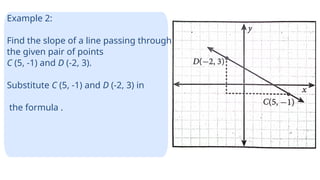
Example 2:
Find theslope of a line passing through
the given pair of points
C (5, -1) and D (-2, 3).
Substitute C (5, -1) and D (-2, 3) in
the formula .
16.
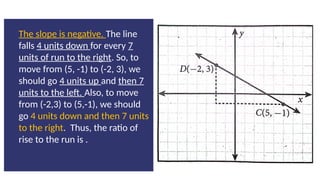
The slope isnegative. The line
falls 4 units down for every 7
units of run to the right. So, to
move from (5, -1) to (-2, 3), we
should go 4 units up and then 7
units to the left. Also, to move
from (-2,3) to (5,-1), we should
go 4 units down and then 7 units
to the right. Thus, the ratio of
rise to the run is .