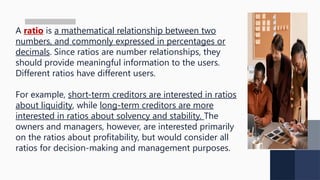
A ratio isa mathematical relationship between two
numbers, and commonly expressed in percentages or
decimals. Since ratios are number relationships, they
should provide meaningful information to the users.
Different ratios have different users.
For example, short-term creditors are interested in ratios
about liquidity, while long-term creditors are more
interested in ratios about solvency and stability. The
owners and managers, however, are interested primarily
on the ratios about profitability, but would consider all
ratios for decision-making and management purposes.
Liquidity Ratios
1. CurrentRatio
The current ratio (also known as
working capital ratio) is one way to
assess the overall liquidity of a
company by comparing current
assets to current liabilities as
follows:
5.
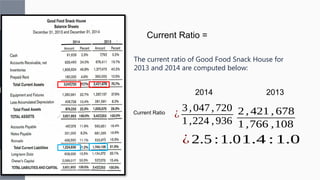
Current Ratio =
Thecurrent ratio of Good Food Snack House for
2013 and 2014 are computed below:
2014 2013
Current Ratio
¿
3,047,720
1,224 ,936
¿ 2.5 :1.0
2 , 421 , 678
1 ,766 ,108
1.4 : 1.0
6.
Liquidity Ratios
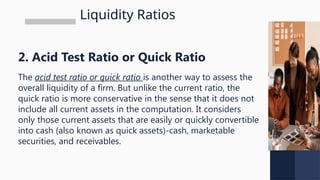
2. AcidTest Ratio or Quick Ratio
The acid test ratio or quick ratio is another way to assess the
overall liquidity of a firm. But unlike the current ratio, the
quick ratio is more conservative in the sense that it does not
include all current assets in the computation. It considers
only those current assets that are easily or quickly convertible
into cash (also known as quick assets)-cash, marketable
securities, and receivables.
7.
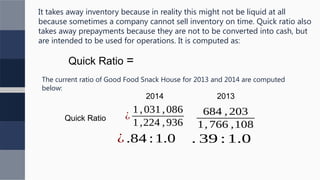
Quick Ratio =
Thecurrent ratio of Good Food Snack House for 2013 and 2014 are computed
below:
2014 2013
Quick Ratio ¿
1,031,086
1,224 ,936
¿ .84 :1.0
684 , 203
1, 766 ,108
. 39 : 1.0
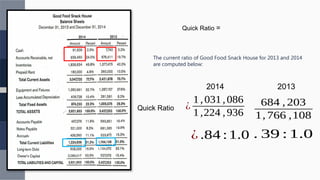
It takes away inventory because in reality this might not be liquid at all
because sometimes a company cannot sell inventory on time. Quick ratio also
takes away prepayments because they are not to be converted into cash, but
are intended to be used for operations. It is computed as:
8.
Quick Ratio =
Thecurrent ratio of Good Food Snack House for 2013 and 2014
are computed below:
2014 2013
Quick Ratio ¿
1,031,086
1,224 ,936
¿ .84 :1.0
684 , 203
1, 766 ,108
. 39 : 1.0
9.
Liquidity Ratios
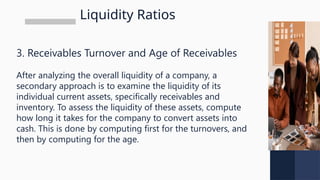
3. ReceivablesTurnover and Age of Receivables
After analyzing the overall liquidity of a company, a
secondary approach is to examine the liquidity of its
individual current assets, specifically receivables and
inventory. To assess the liquidity of these assets, compute
how long it takes for the company to convert assets into
cash. This is done by computing first for the turnovers, and
then by computing for the age.
10.
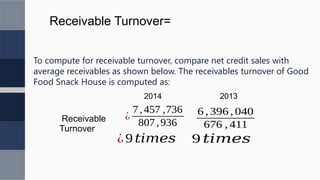
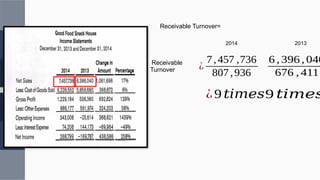
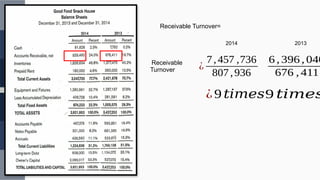
Receivable Turnover=
To computefor receivable turnover, compare net credit sales with
average receivables as shown below. The receivables turnover of Good
Food Snack House is computed as:
2014 2013
Receivable
Turnover
¿
7,457 ,736
807,936
¿9 𝑡𝑖𝑚𝑒𝑠
6 , 396 , 040
676 , 411
9 𝑡𝑖𝑚𝑒𝑠
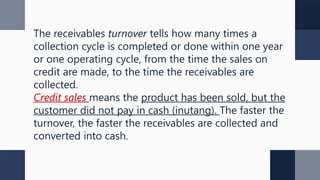
The receivables turnovertells how many times a
collection cycle is completed or done within one year
or one operating cycle, from the time the sales on
credit are made, to the time the receivables are
collected.
Credit sales means the product has been sold, but the
customer did not pay in cash (inutang). The faster the
turnover, the faster the receivables are collected and
converted into cash.
14.
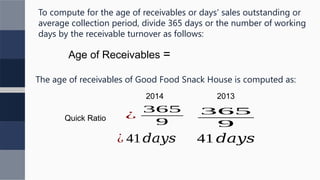
Age of Receivables=
The age of receivables of Good Food Snack House is computed as:
2014 2013
Quick Ratio ¿
365
9
¿ 41𝑑𝑎𝑦𝑠
365
9
To compute for the age of receivables or days' sales outstanding or
average collection period, divide 365 days or the number of working
days by the receivable turnover as follows:
41 𝑑𝑎𝑦𝑠
15.
The average ageof receivables (days' sales in credit)
indicates the average number of days it takes for a
company to collect its receivables from credit sales. The
shorter the number of collection days, the faster it takes
for a company to convert its receivables into cash.
16.
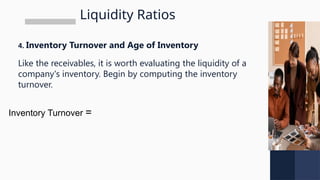
Liquidity Ratios
4. InventoryTurnover and Age of Inventory
Like the receivables, it is worth evaluating the liquidity of a
company's inventory. Begin by computing the inventory
turnover.
Inventory Turnover =
17.
2014 2013
Inventory
Turnover ¿
6,228,552
1,607 ,054
¿ 4𝑡𝑖𝑚𝑒𝑠
5 ,859 , 680
1, 377 , 475
The inventory turnover of Good Food
Snack House is computed as:
4 𝑡𝑖𝑚𝑒𝑠
18.
2014 2013
Inventory
Turnover ¿
6,228,552
1,607 ,054
¿ 4𝑡𝑖𝑚𝑒𝑠
5 ,859 , 680
1, 377 , 475
The inventory turnover of Good Food
Snack House is computed as:
4 𝑡𝑖𝑚𝑒𝑠
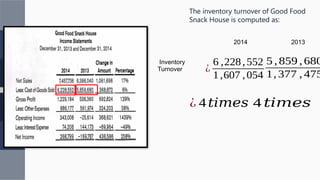
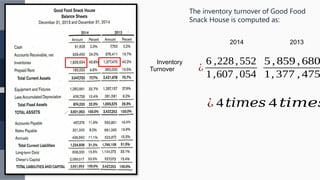
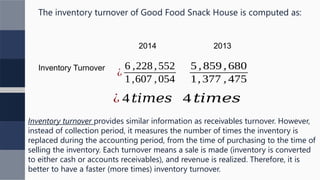
19.
2014 2013
Inventory Turnover
¿
6,228,552
1,607 ,054
¿ 4𝑡𝑖𝑚𝑒𝑠
5 ,859 , 680
1, 377 , 475
The inventory turnover of Good Food Snack House is computed as:
4 𝑡𝑖𝑚𝑒𝑠
Inventory turnover provides similar information as receivables turnover. However,
instead of collection period, it measures the number of times the inventory is
replaced during the accounting period, from the time of purchasing to the time of
selling the inventory. Each turnover means a sale is made (inventory is converted
to either cash or accounts receivables), and revenue is realized. Therefore, it is
better to have a faster (more times) inventory turnover.
20.
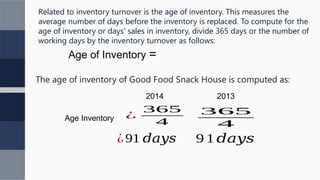
Age of Inventory=
The age of inventory of Good Food Snack House is computed as:
2014 2013
Age Inventory ¿
365
4
¿91 𝑑𝑎𝑦𝑠
365
4
Related to inventory turnover is the age of inventory. This measures the
average number of days before the inventory is replaced. To compute for the
age of inventory or days' sales in inventory, divide 365 days or the number of
working days by the inventory turnover as follows:
9 1 𝑑𝑎𝑦𝑠
22.
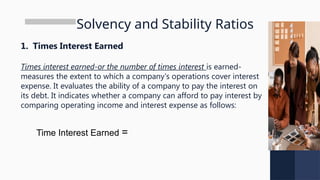
Solvency and StabilityRatios
1. Times Interest Earned
Times interest earned-or the number of times interest is earned-
measures the extent to which a company's operations cover interest
expense. It evaluates the ability of a company to pay the interest on
its debt. It indicates whether a company can afford to pay interest by
comparing operating income and interest expense as follows:
Time Interest Earned =
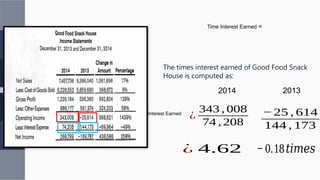
23.
The times interestearned of Good Food Snack
House is computed as:
2014 2013
Time Interest Earned
¿
343 , 008
74 , 208
¿ 4.62
−25 , 614
144 , 173
−0.18𝑡𝑖𝑚𝑒𝑠
Time Interest Earned =
24.
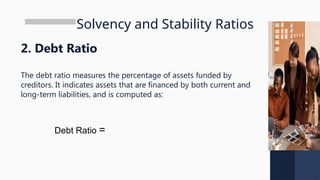
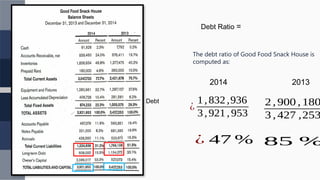
Solvency and StabilityRatios
2. Debt Ratio
The debt ratio measures the percentage of assets funded by
creditors. It indicates assets that are financed by both current and
long-term liabilities, and is computed as:
Debt Ratio =
25.
The debt ratioof Good Food Snack House is
computed as:
2014 2013
Debt
Ratio ¿
1,832,936
3,921,953
¿ 47 %
2 ,900 , 180
3 ,427 ,253
85 %
Debt Ratio =
26.
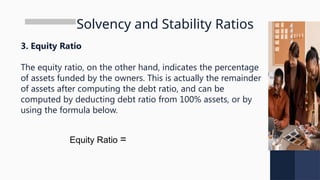
Solvency and StabilityRatios
3. Equity Ratio
The equity ratio, on the other hand, indicates the percentage
of assets funded by the owners. This is actually the remainder
of assets after computing the debt ratio, and can be
computed by deducting debt ratio from 100% assets, or by
using the formula below.
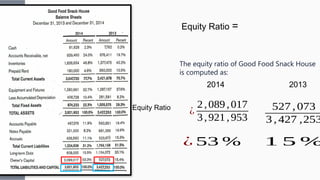
Equity Ratio =
27.
The equity ratioof Good Food Snack House
is computed as:
2014 2013
Equity Ratio
¿
2,089,017
3,921,953
¿ 53 %
527 , 073
3 ,427 ,253
1 5 %
Equity Ratio =
28.
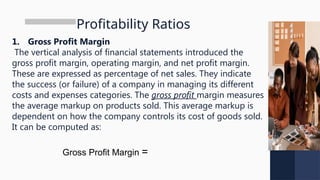
Profitability Ratios
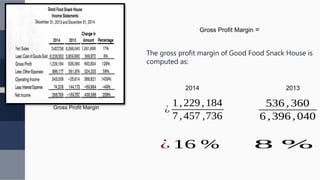
1. GrossProfit Margin
The vertical analysis of financial statements introduced the
gross profit margin, operating margin, and net profit margin.
These are expressed as percentage of net sales. They indicate
the success (or failure) of a company in managing its different
costs and expenses categories. The gross profit margin measures
the average markup on products sold. This average markup is
dependent on how the company controls its cost of goods sold.
It can be computed as:
Gross Profit Margin =
29.
The gross profitmargin of Good Food Snack House is
computed as:
2014 2013
Gross Profit Margin
¿
1,229,184
7,457 ,736
¿ 16 %
536 ,360
6,396 ,040
8 %
Gross Profit Margin =
30.
Profitability Ratios
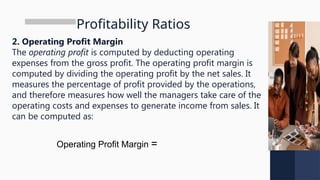
2. OperatingProfit Margin
The operating profit is computed by deducting operating
expenses from the gross profit. The operating profit margin is
computed by dividing the operating profit by the net sales. It
measures the percentage of profit provided by the operations,
and therefore measures how well the managers take care of the
operating costs and expenses to generate income from sales. It
can be computed as:
Operating Profit Margin =
31.
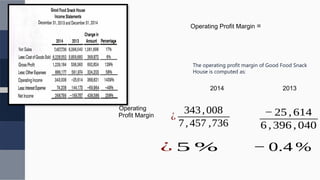
The operating profitmargin of Good Food Snack
House is computed as:
2014 2013
Operating
Profit Margin ¿
343,008
7,457 ,736
¿ 5 %
− 25 , 614
6 ,396 , 040
− 0.4 %
Operating Profit Margin =
32.
Profitability Ratios
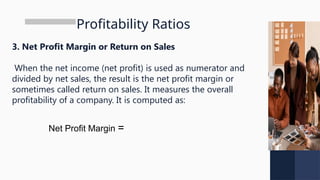
3. NetProfit Margin or Return on Sales
When the net income (net profit) is used as numerator and
divided by net sales, the result is the net profit margin or
sometimes called return on sales. It measures the overall
profitability of a company. It is computed as:
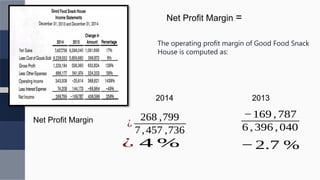
Net Profit Margin =
33.
The operating profitmargin of Good Food Snack
House is computed as:
2014 2013
Net Profit Margin
¿
268 ,799
7,457 ,736
¿ 4 %
−169 ,787
6 , 396 , 040
−2.7 %
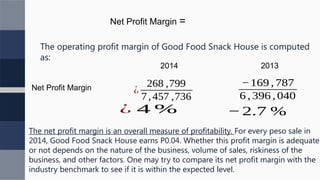
Net Profit Margin =
34.
The operating profitmargin of Good Food Snack House is computed
as:
2014 2013
Net Profit Margin ¿
268 ,799
7,457 ,736
¿ 4 %
−169 ,787
6 , 396 , 040
−2.7 %
Net Profit Margin =
The net profit margin is an overall measure of profitability. For every peso sale in
2014, Good Food Snack House earns P0.04. Whether this profit margin is adequate
or not depends on the nature of the business, volume of sales, riskiness of the
business, and other factors. One may try to compare its net profit margin with the
industry benchmark to see if it is within the expected level.