Download as PDF, PPTX
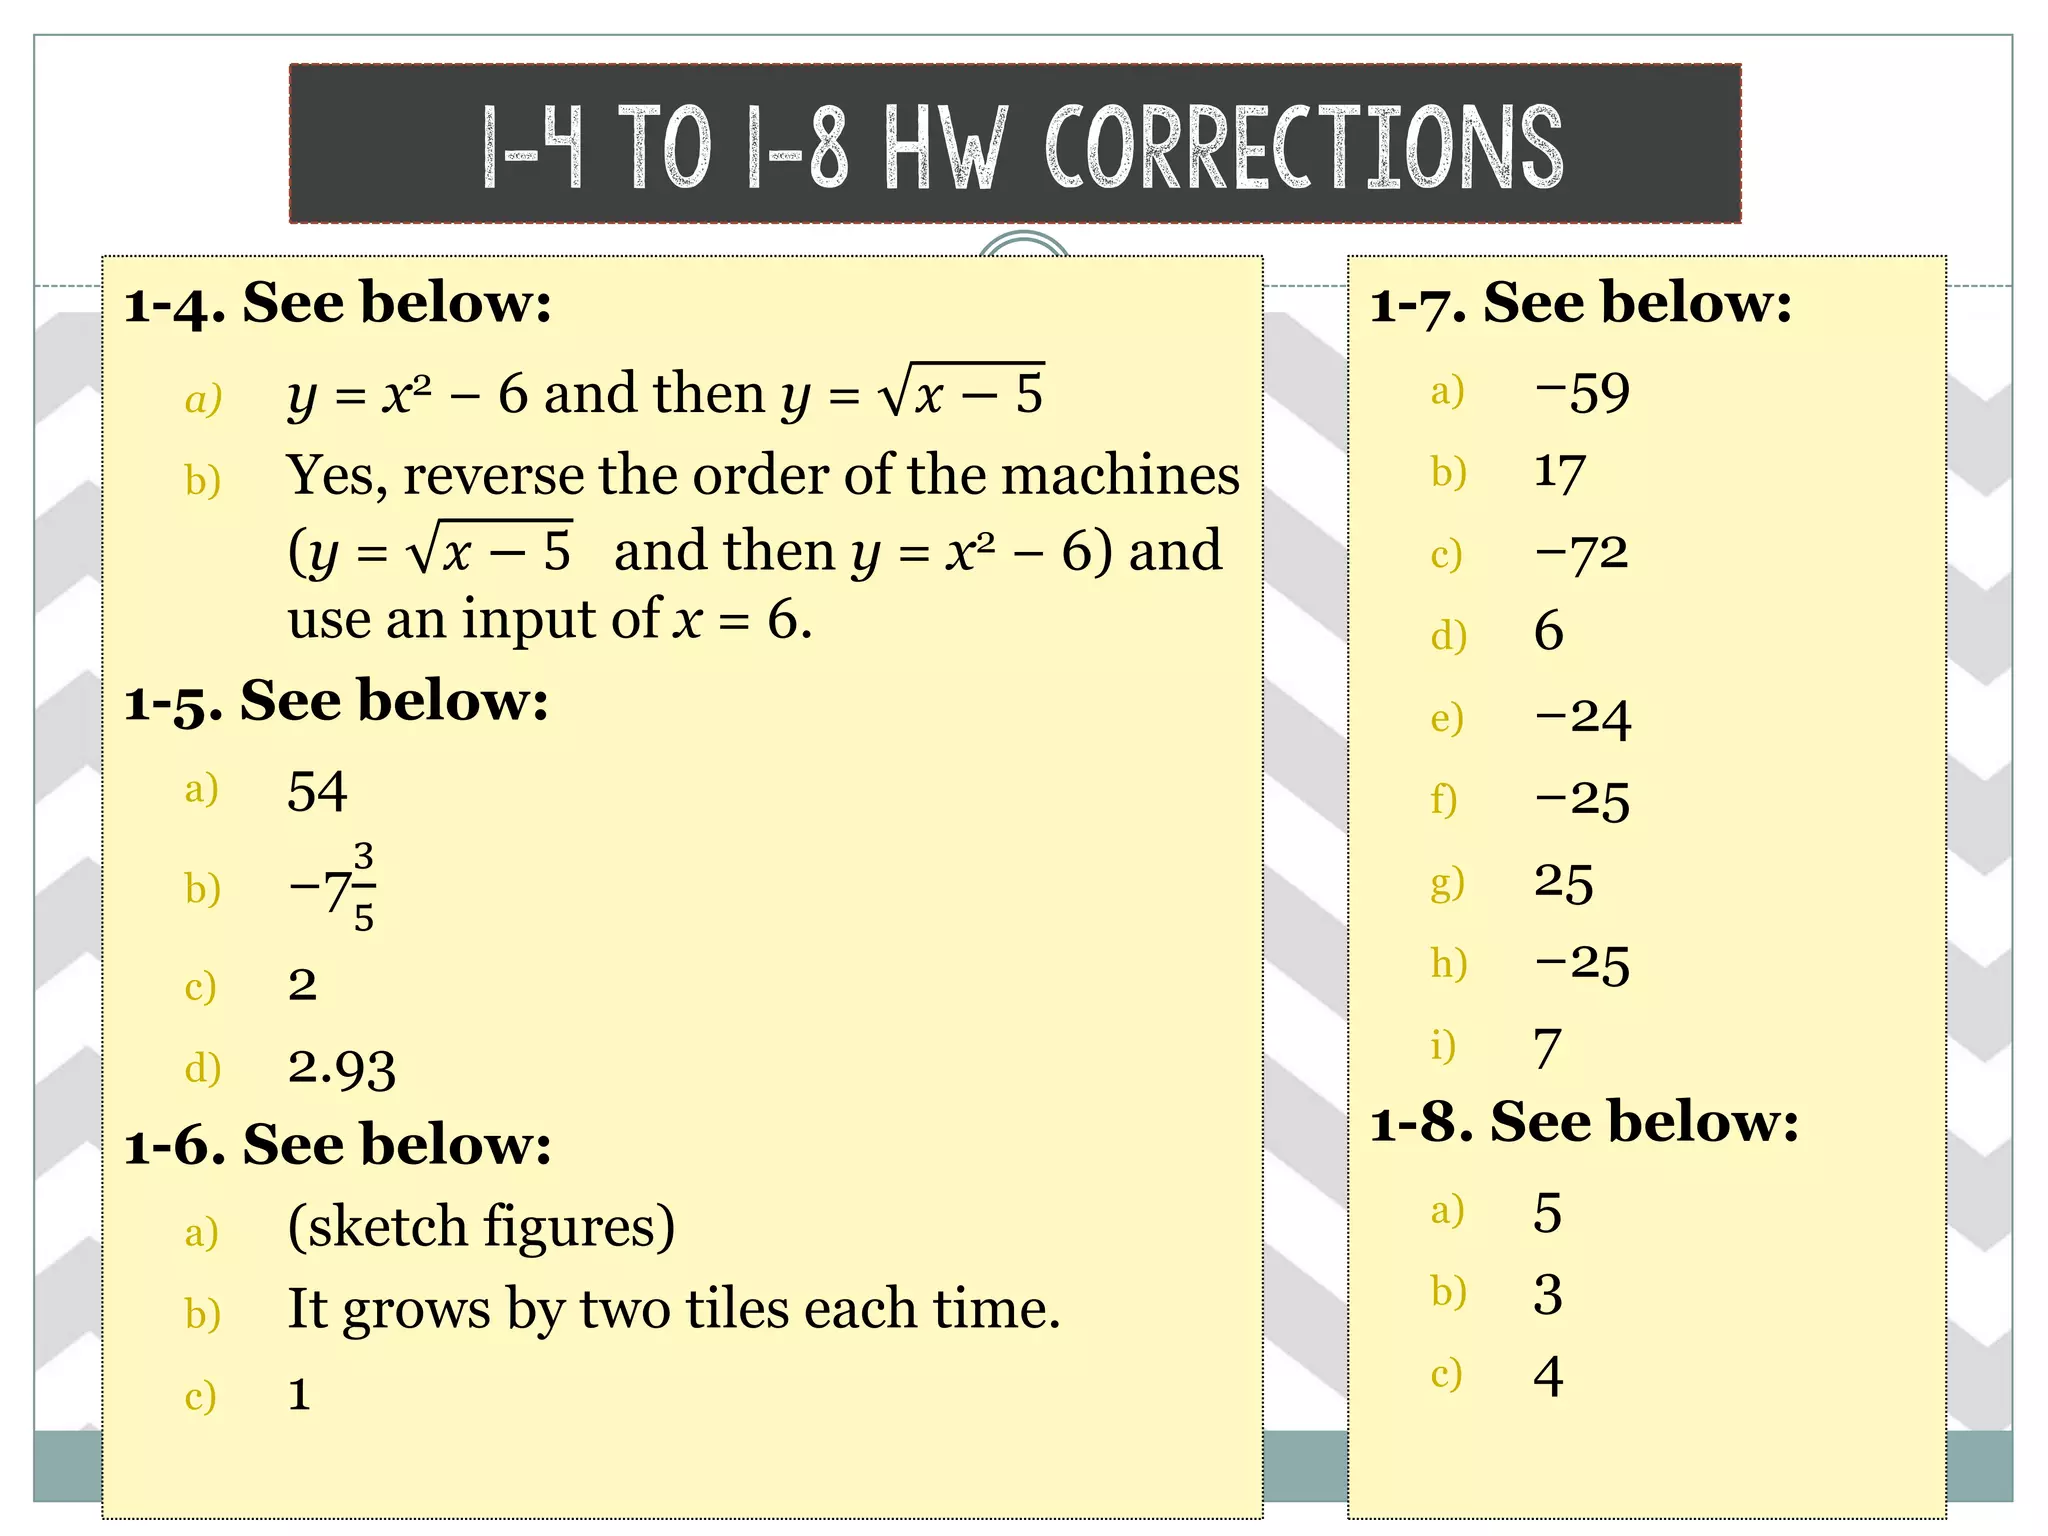
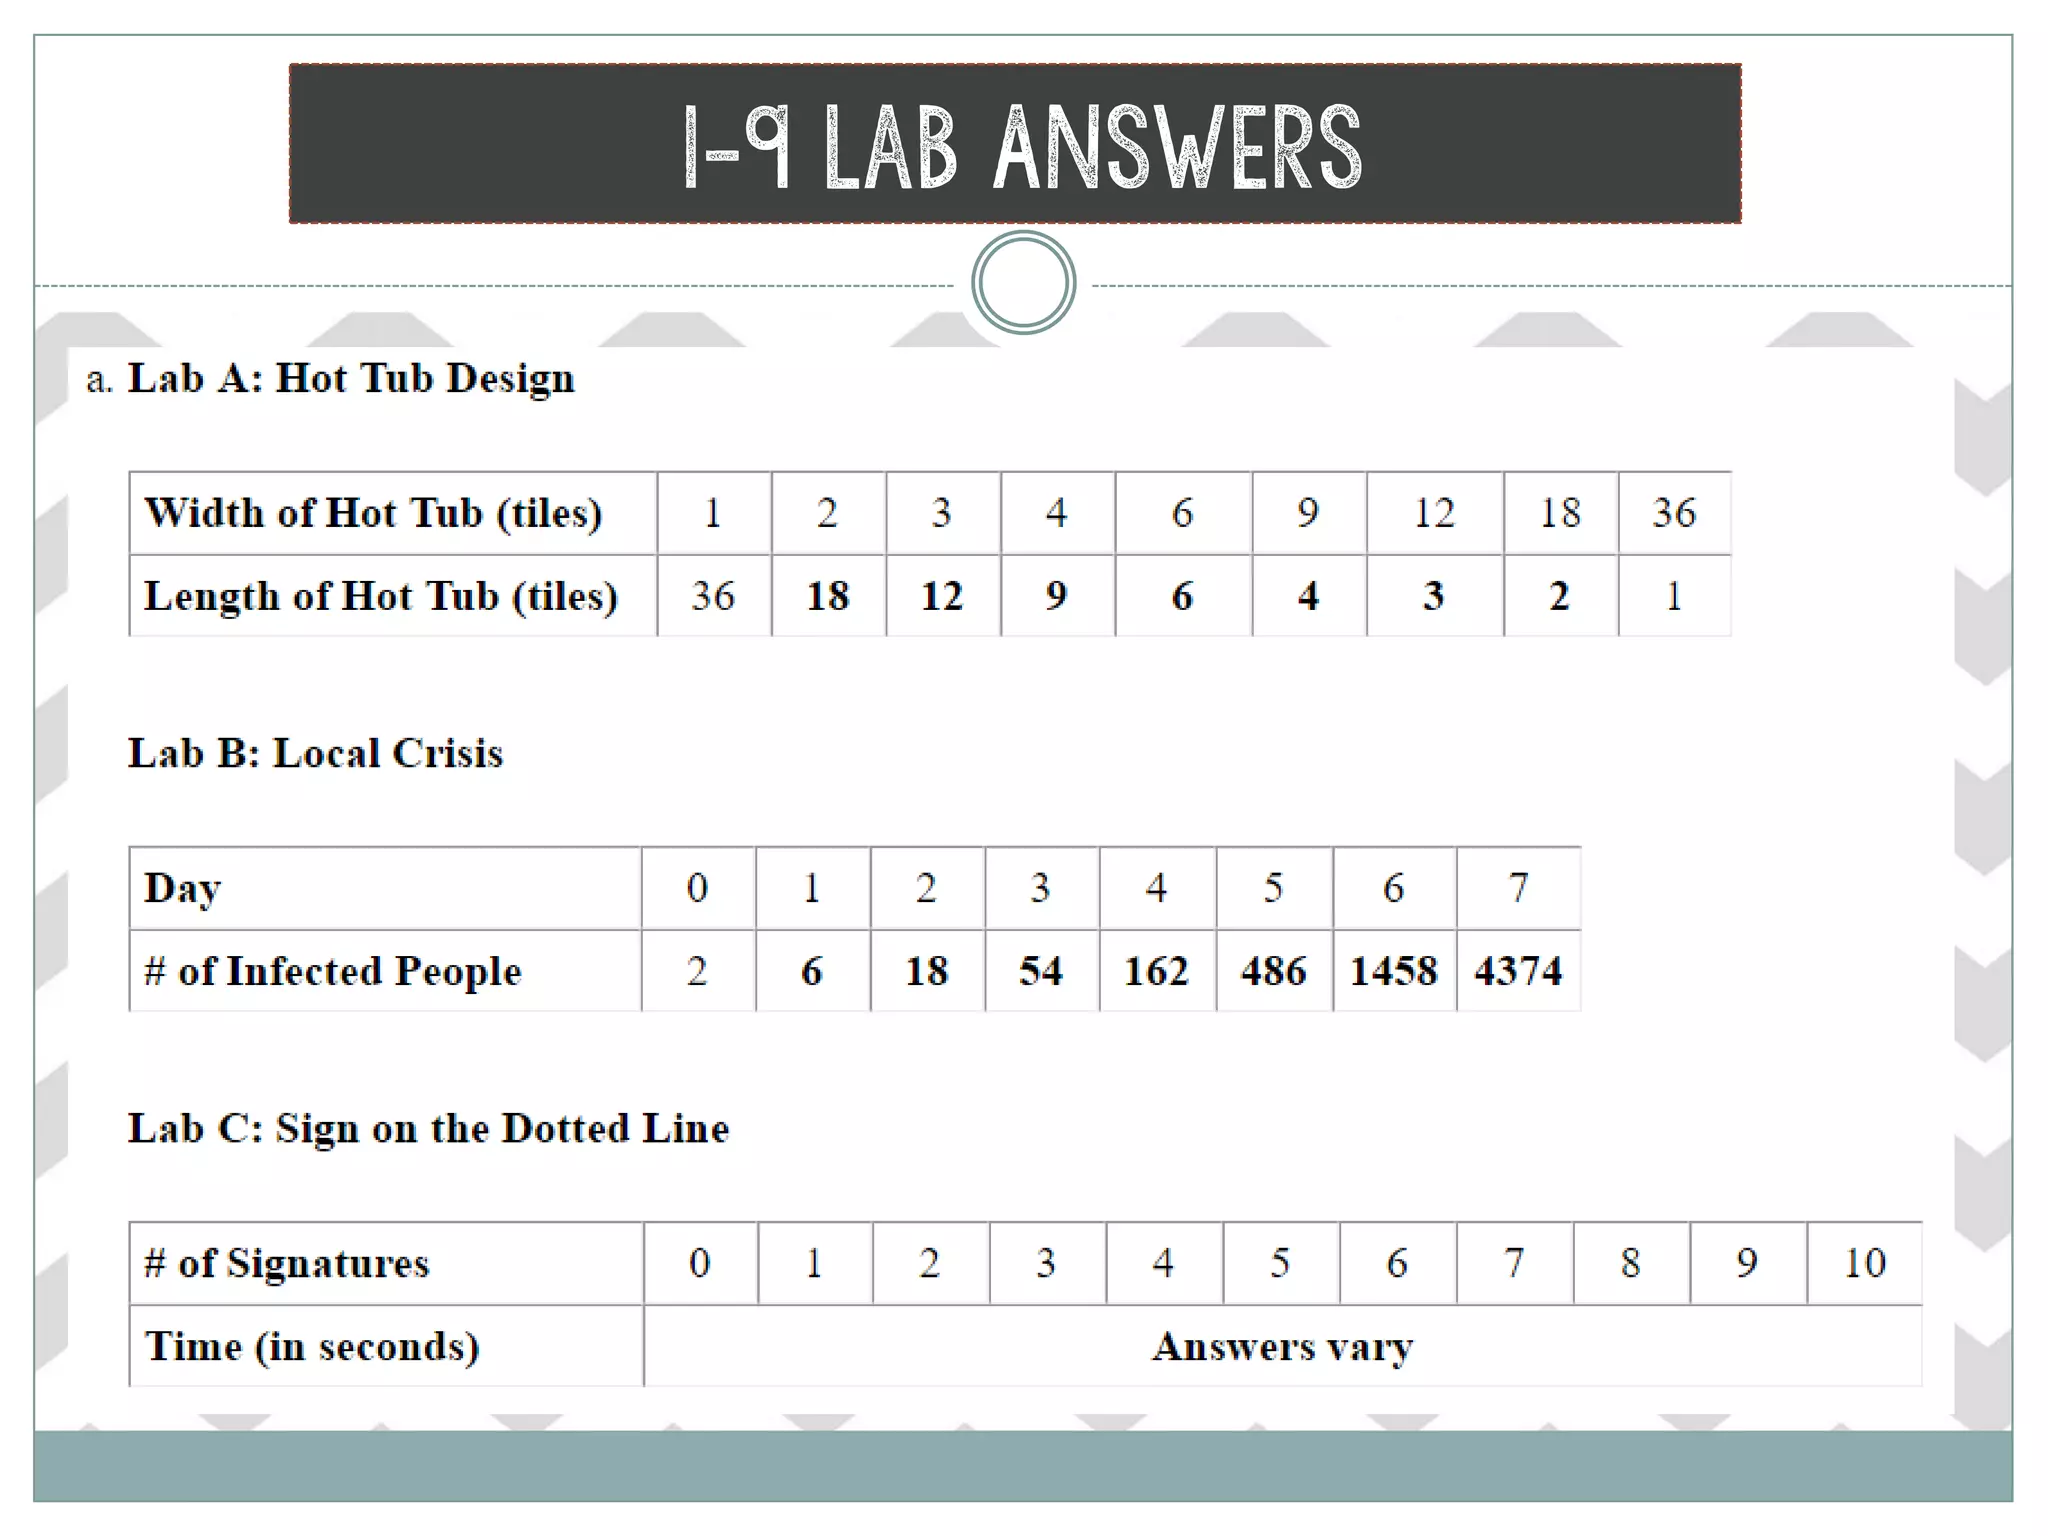
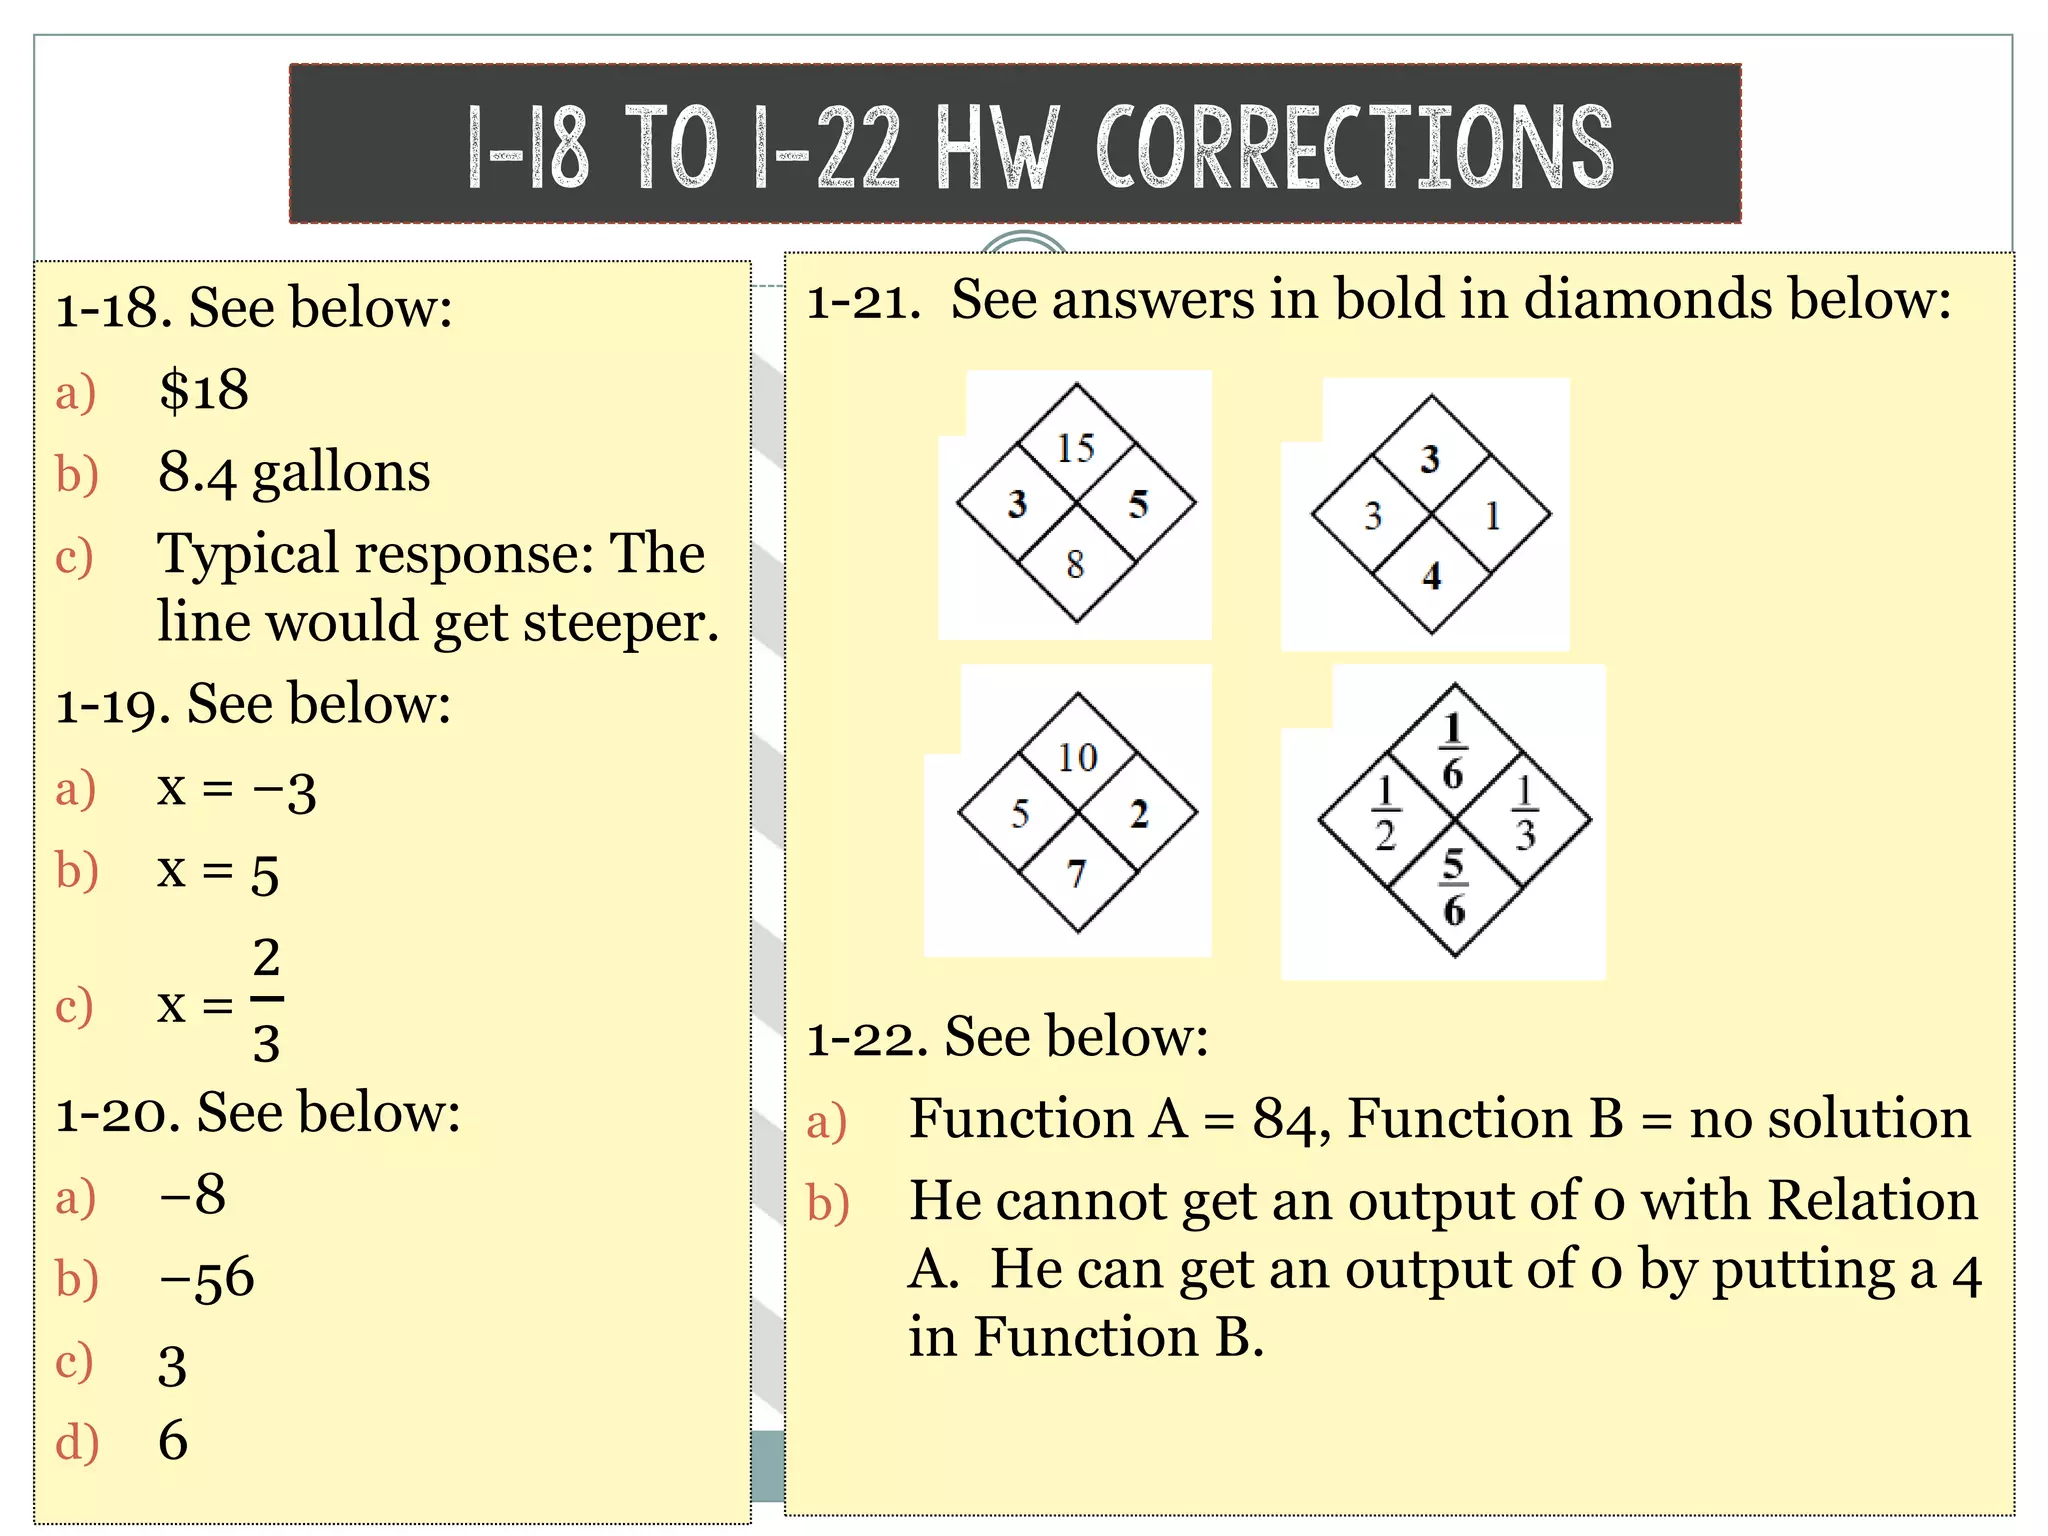
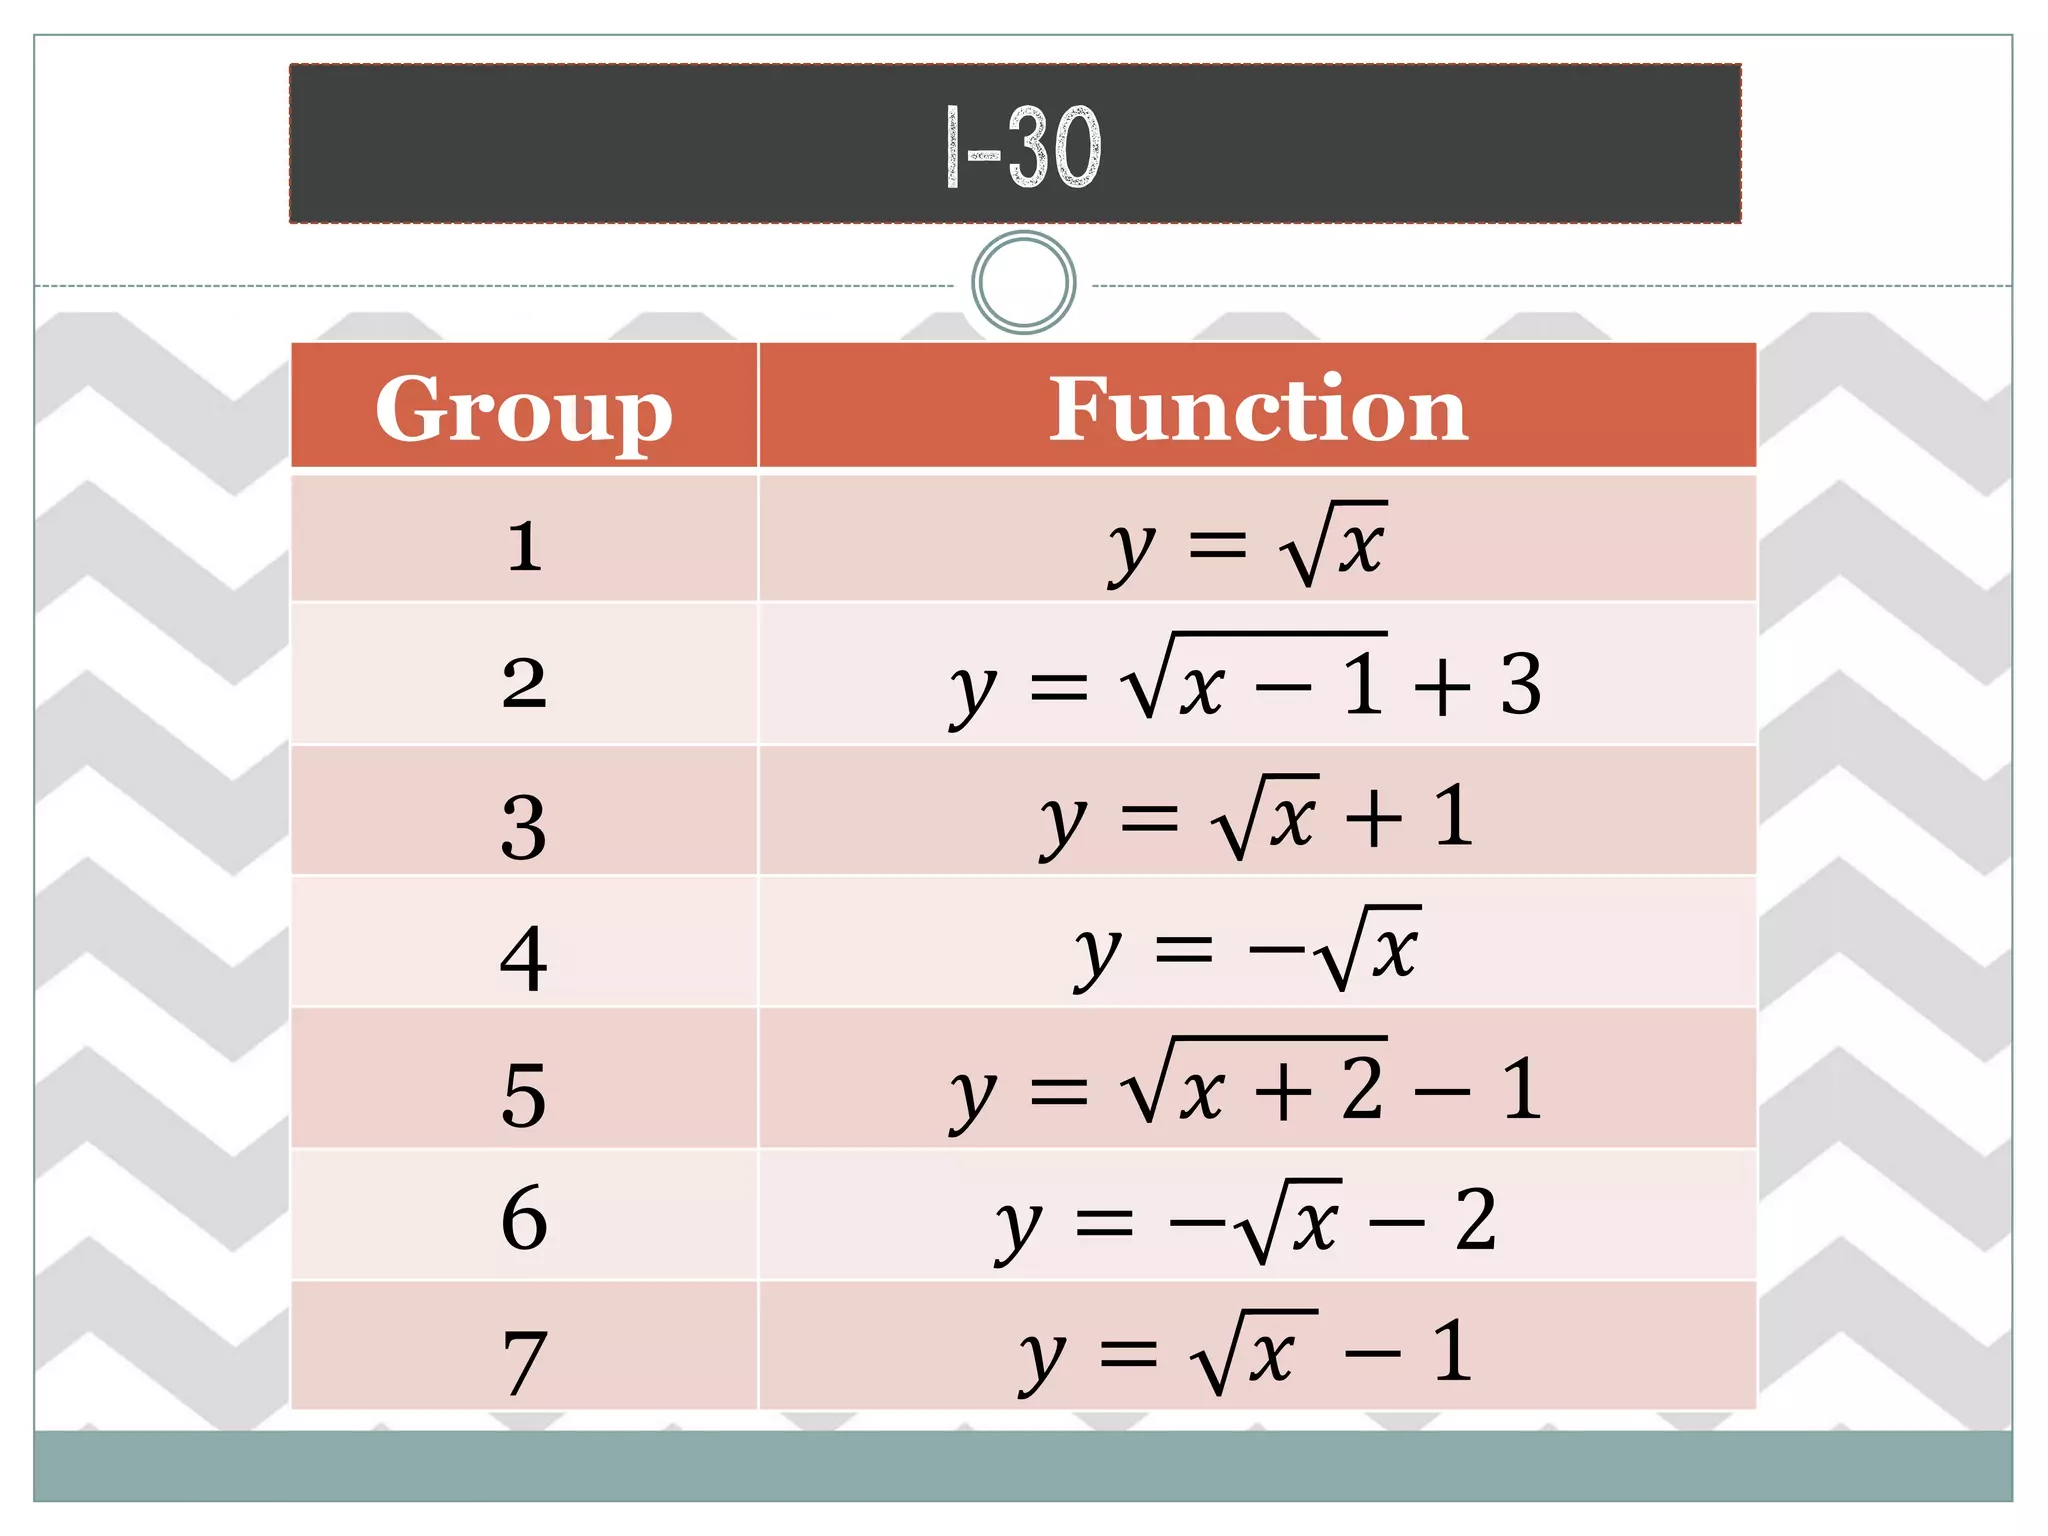
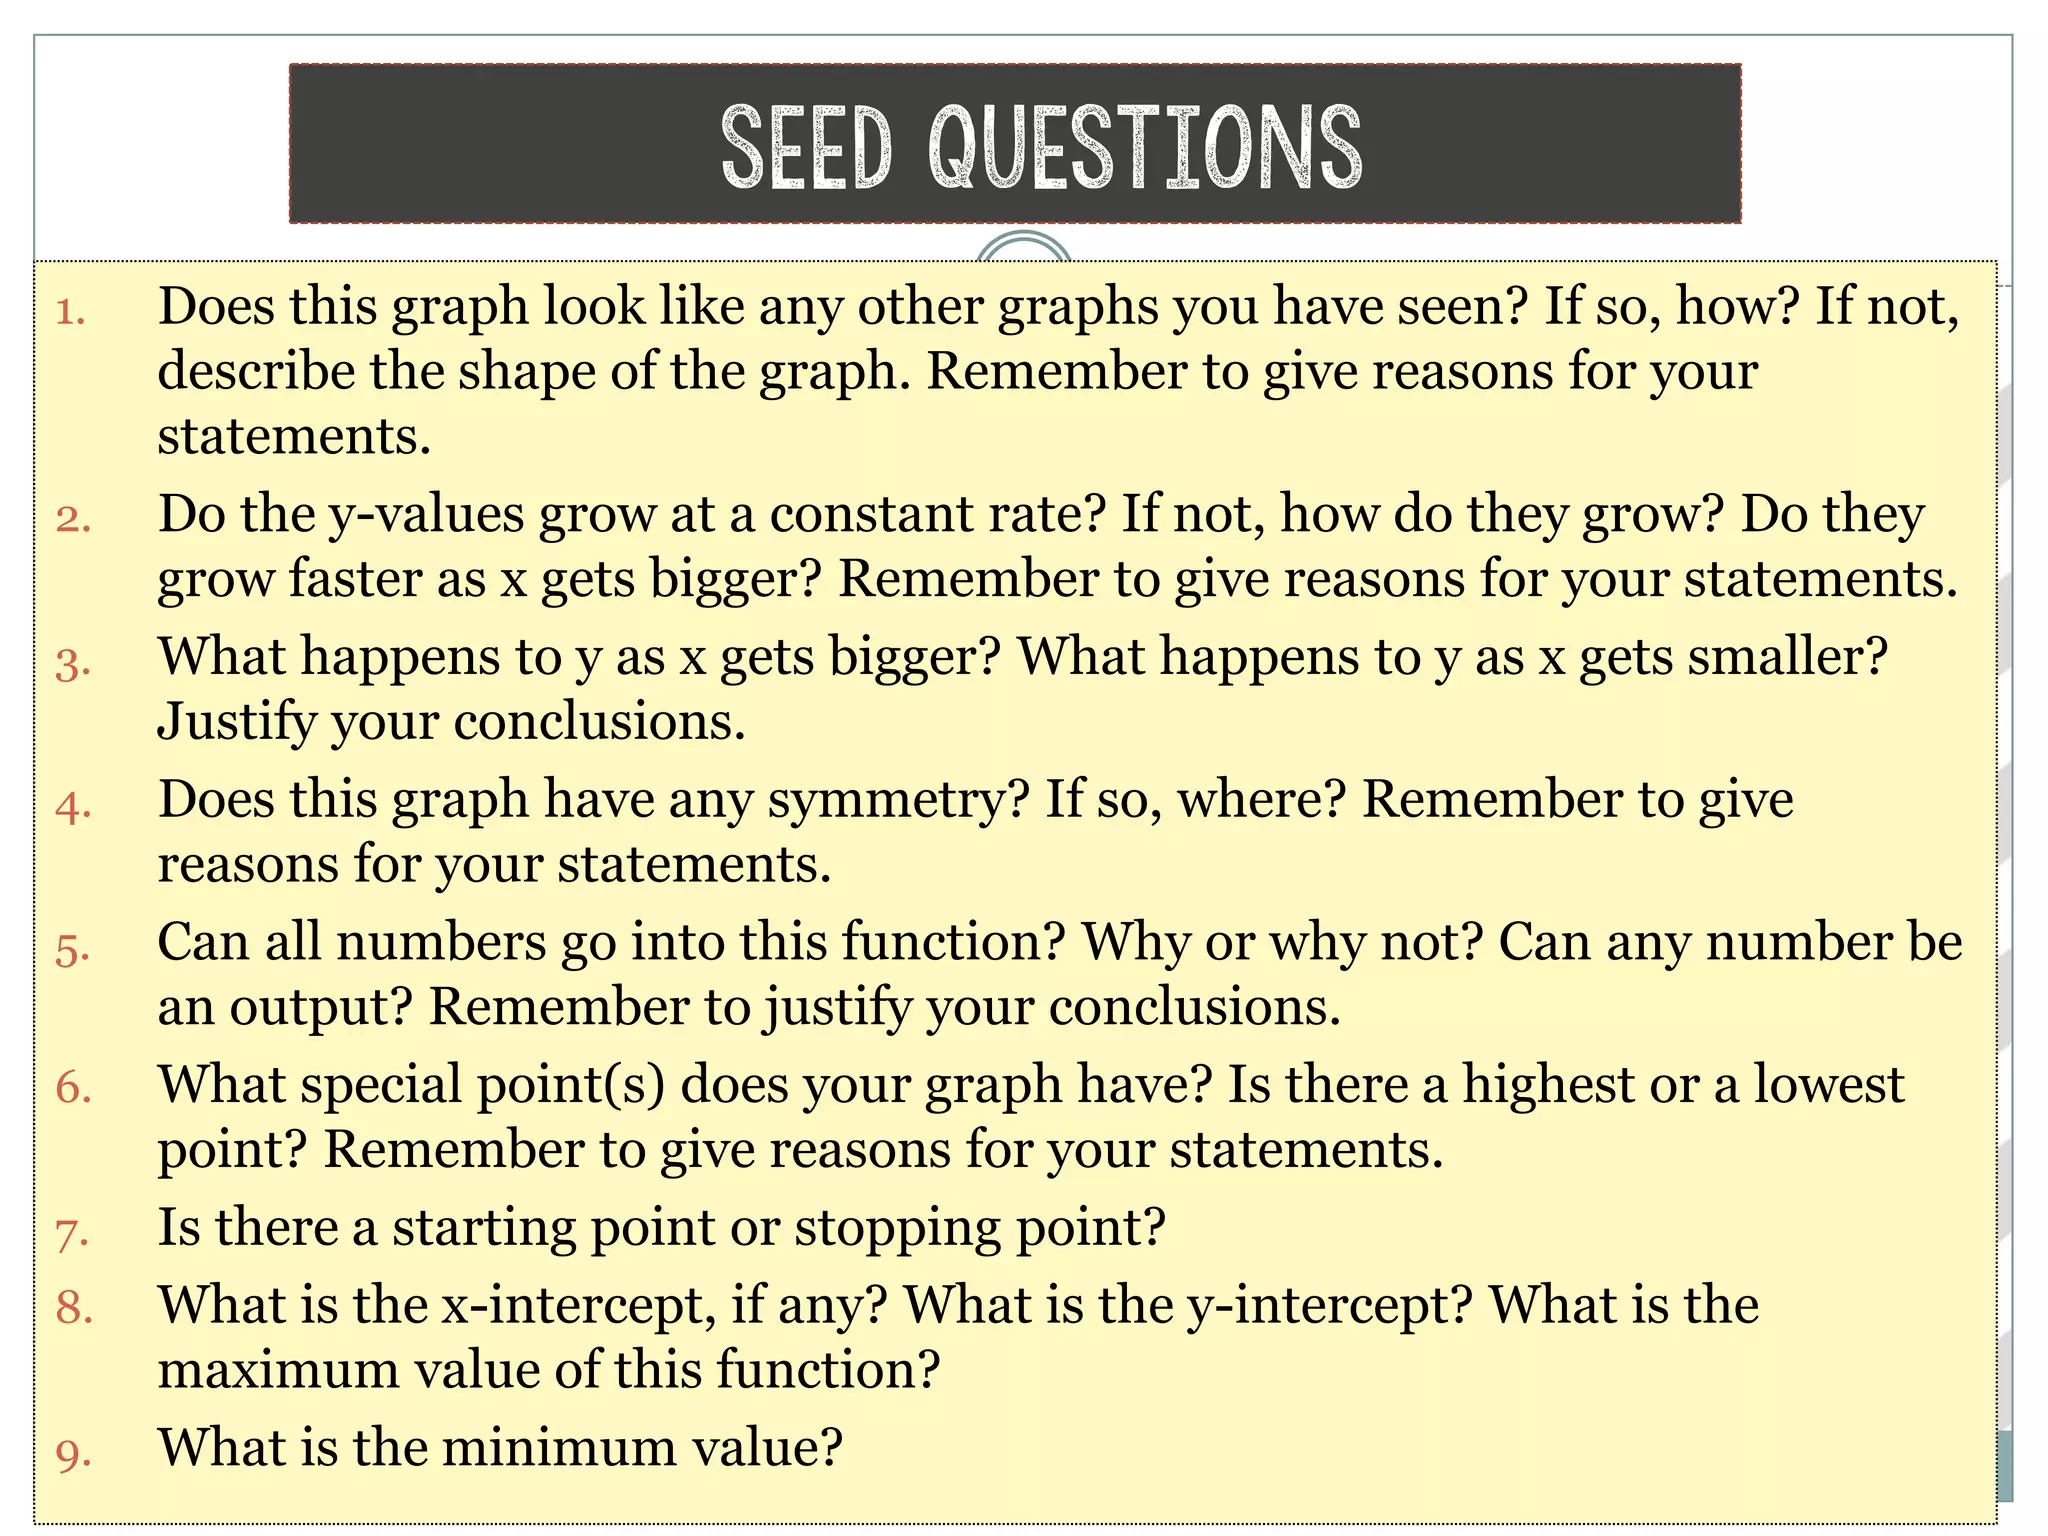
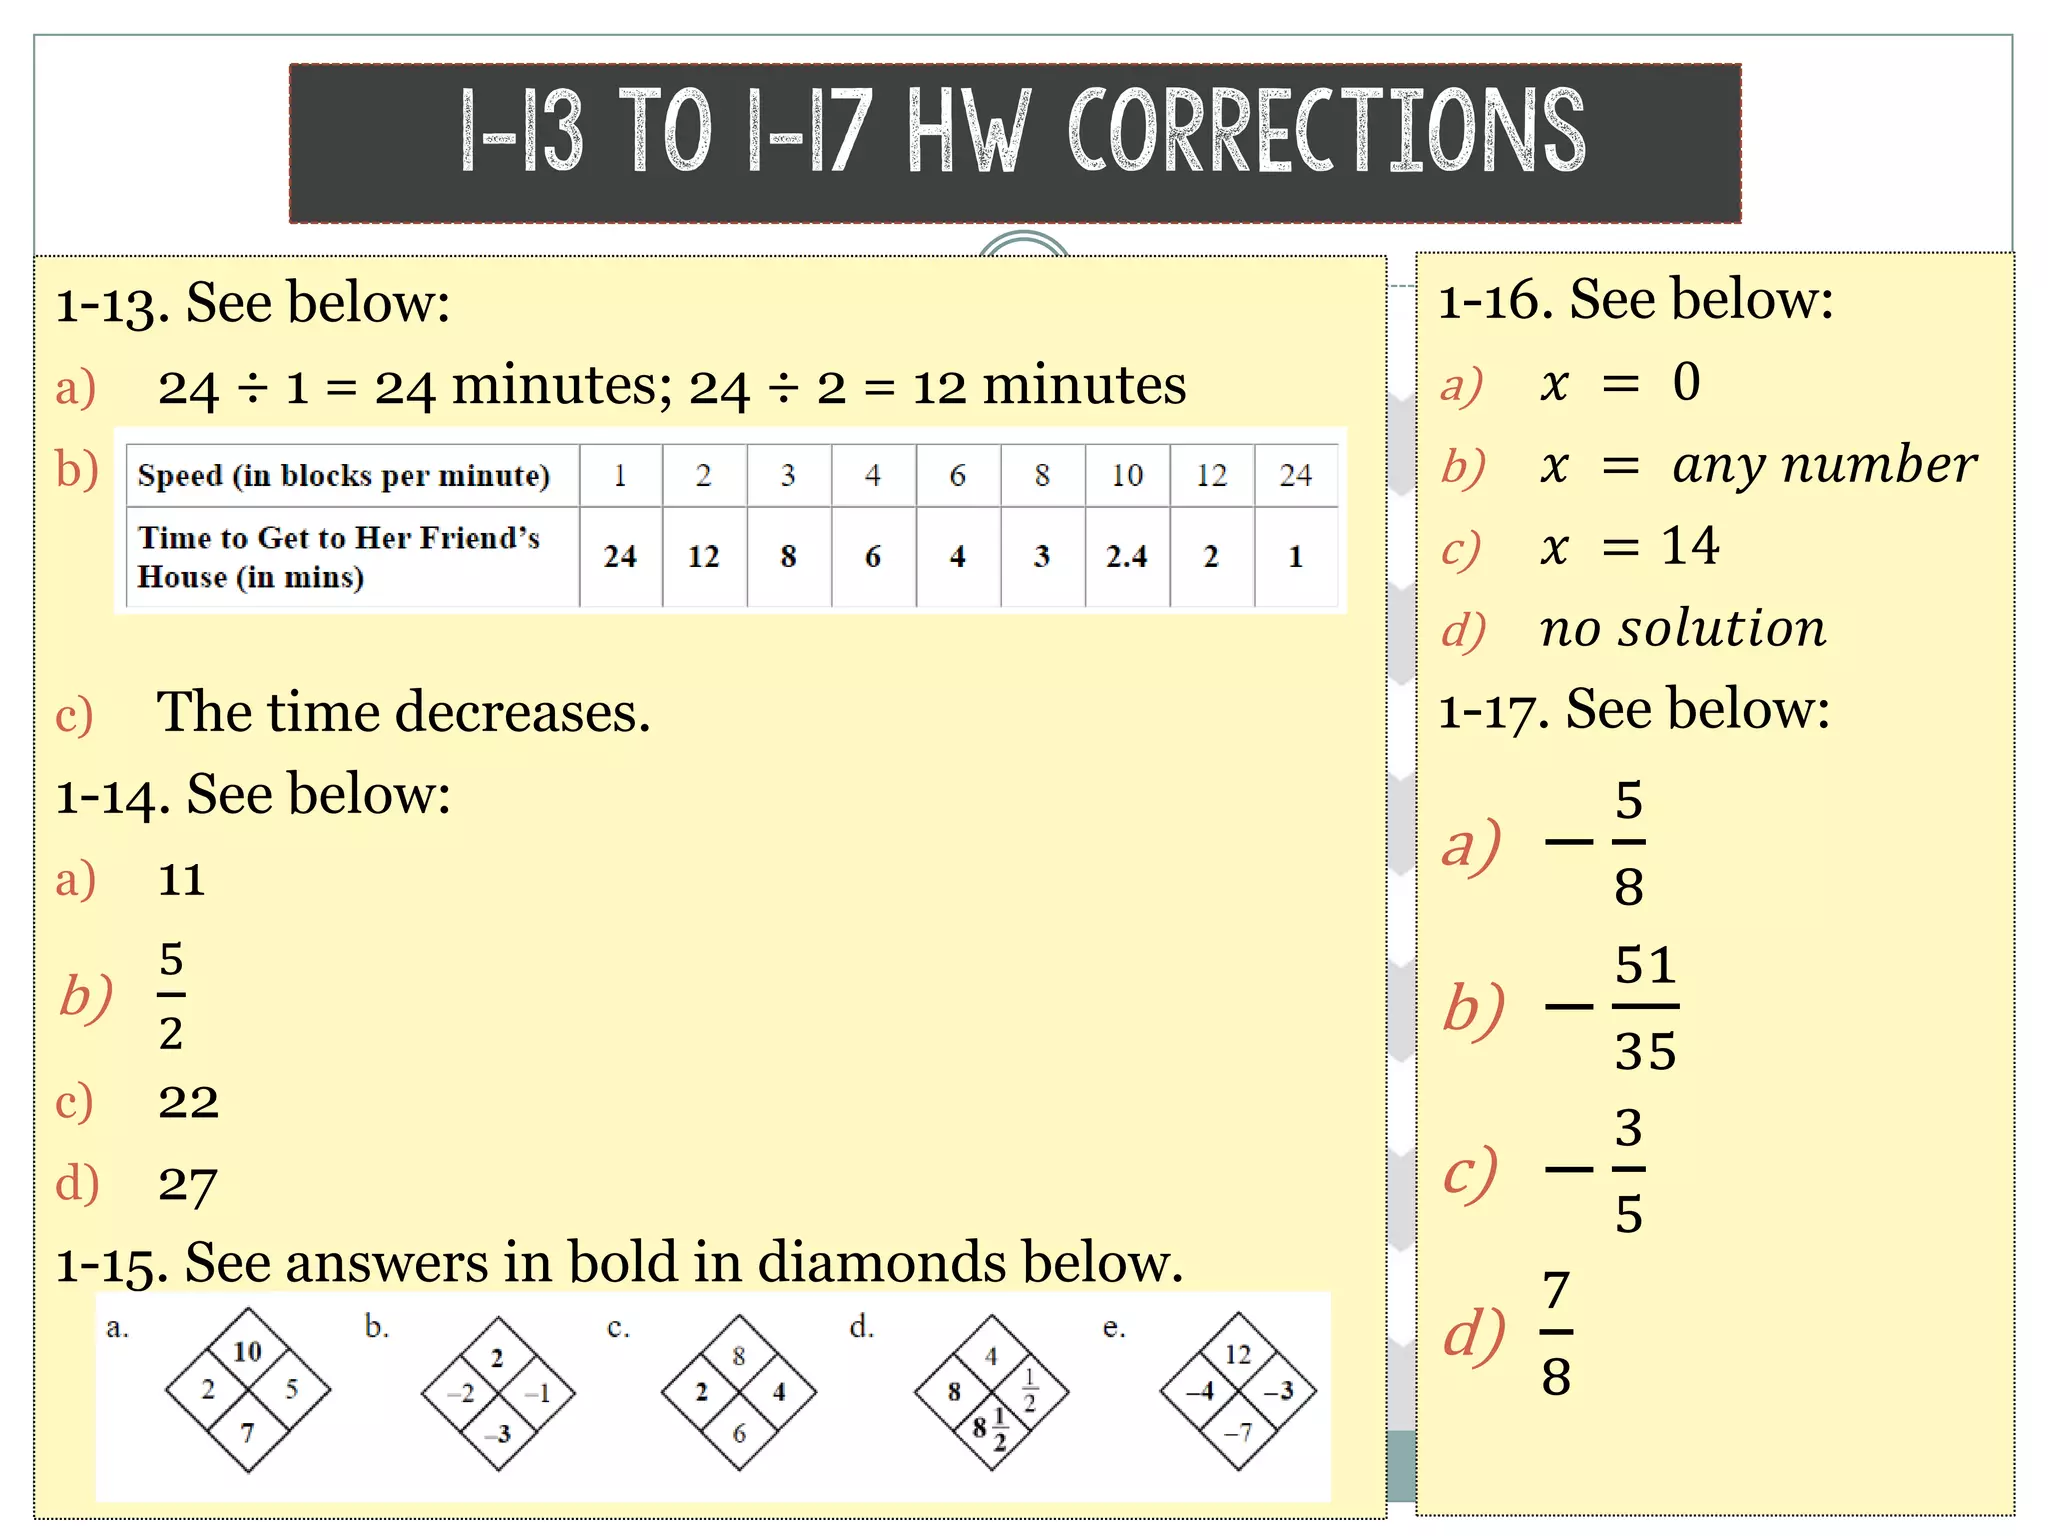
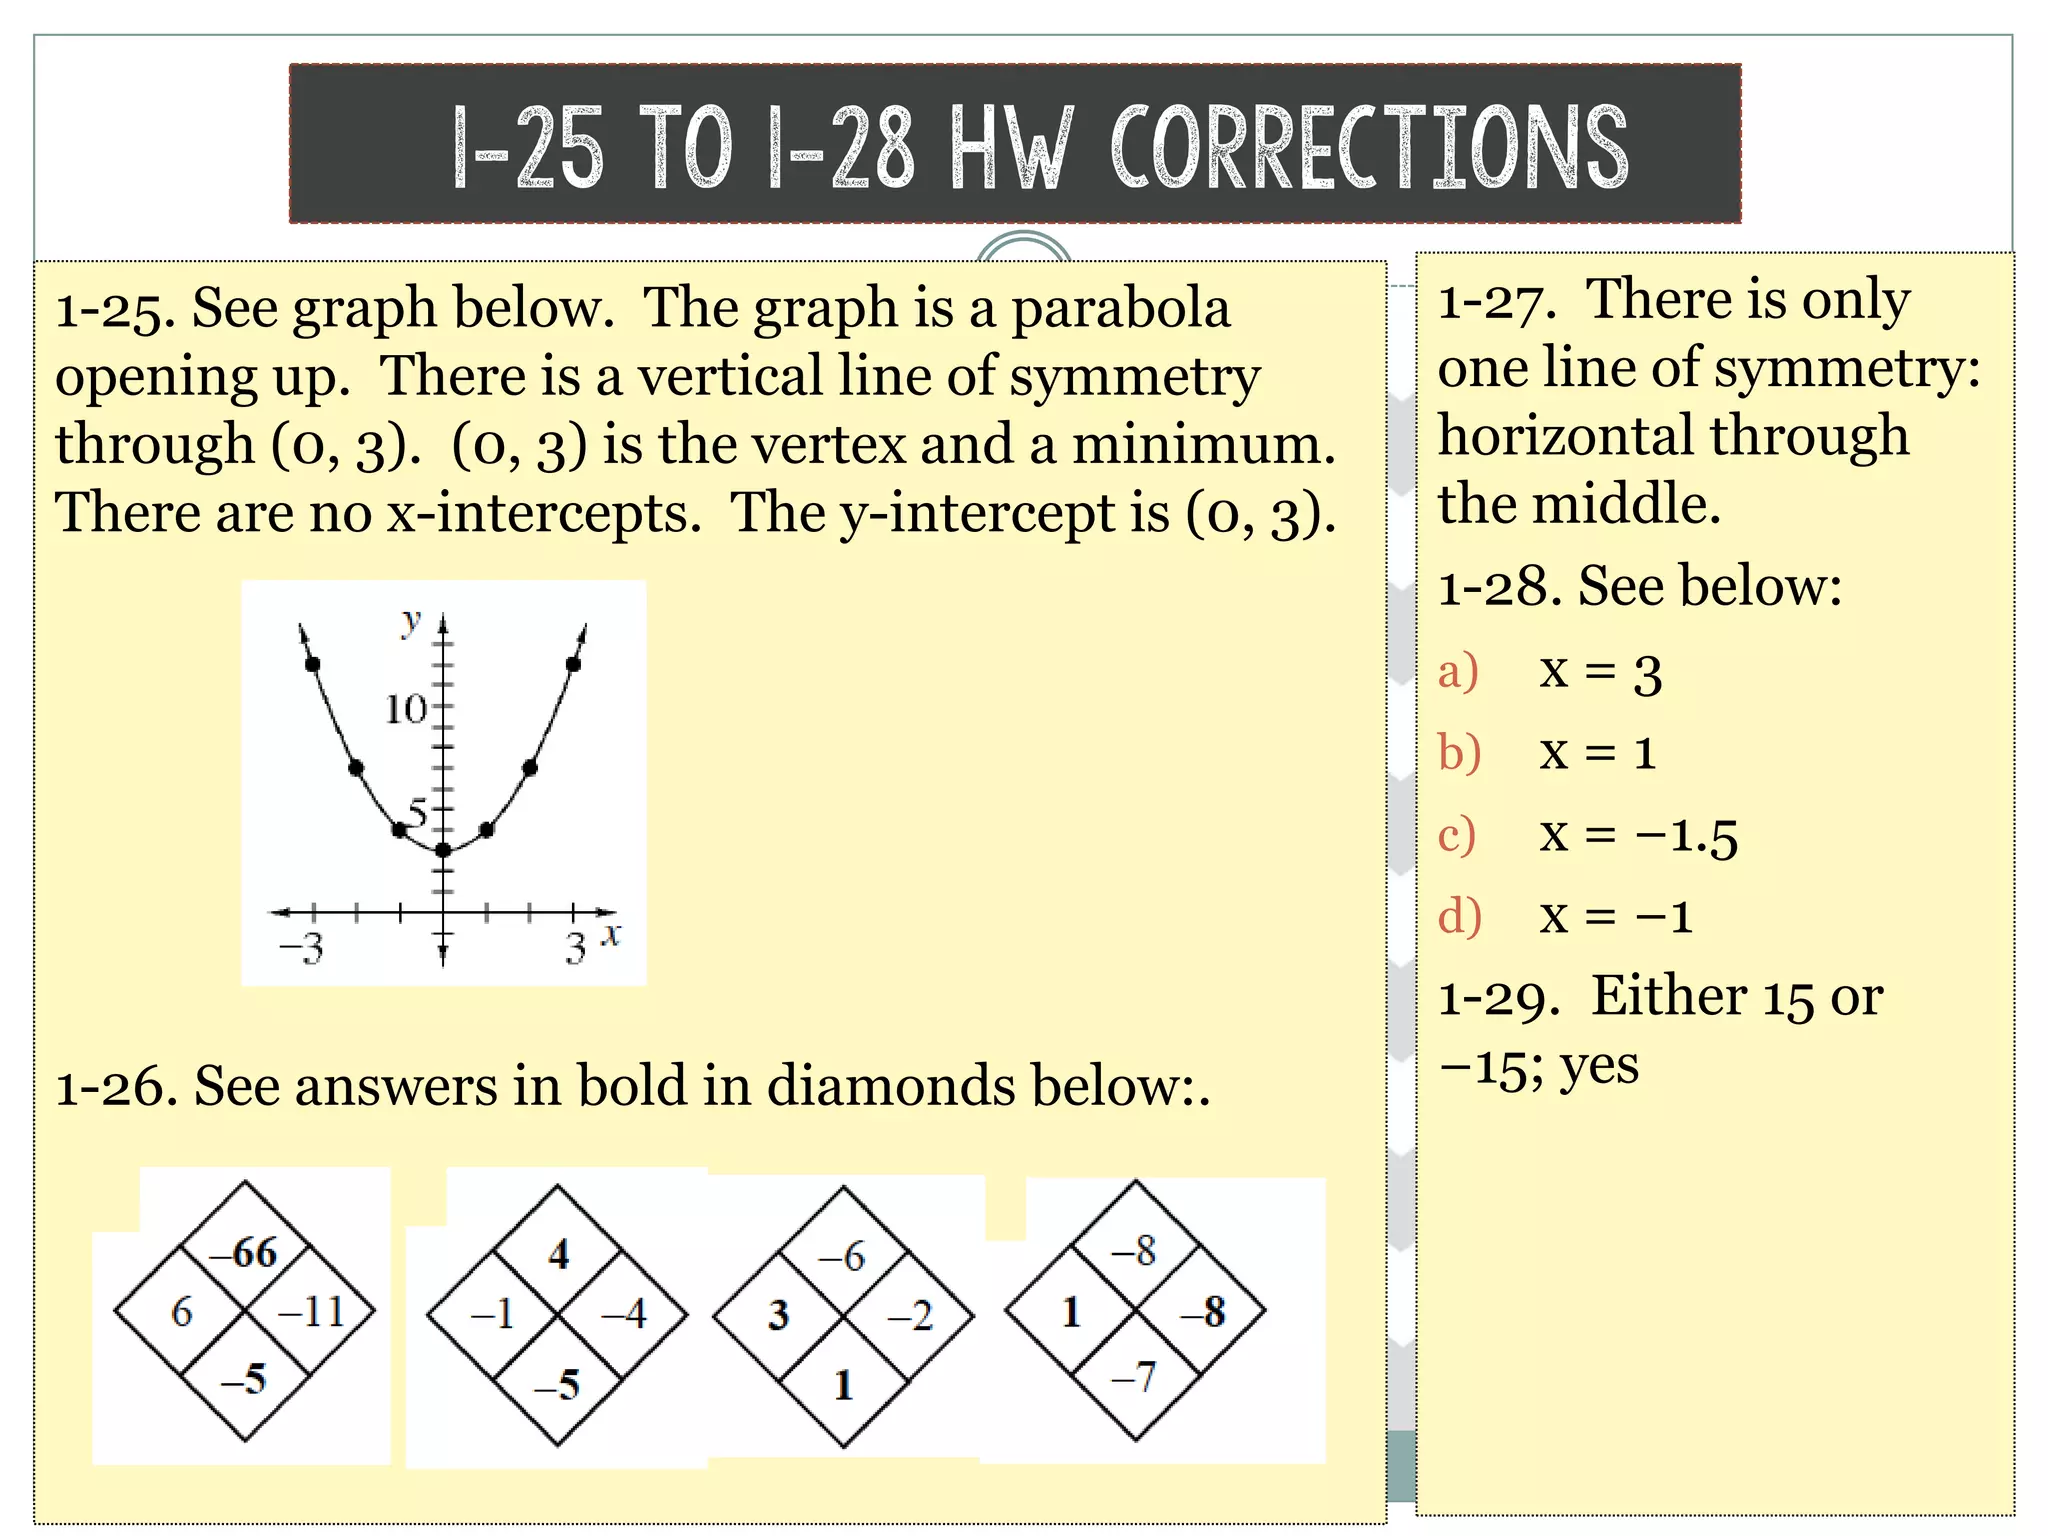
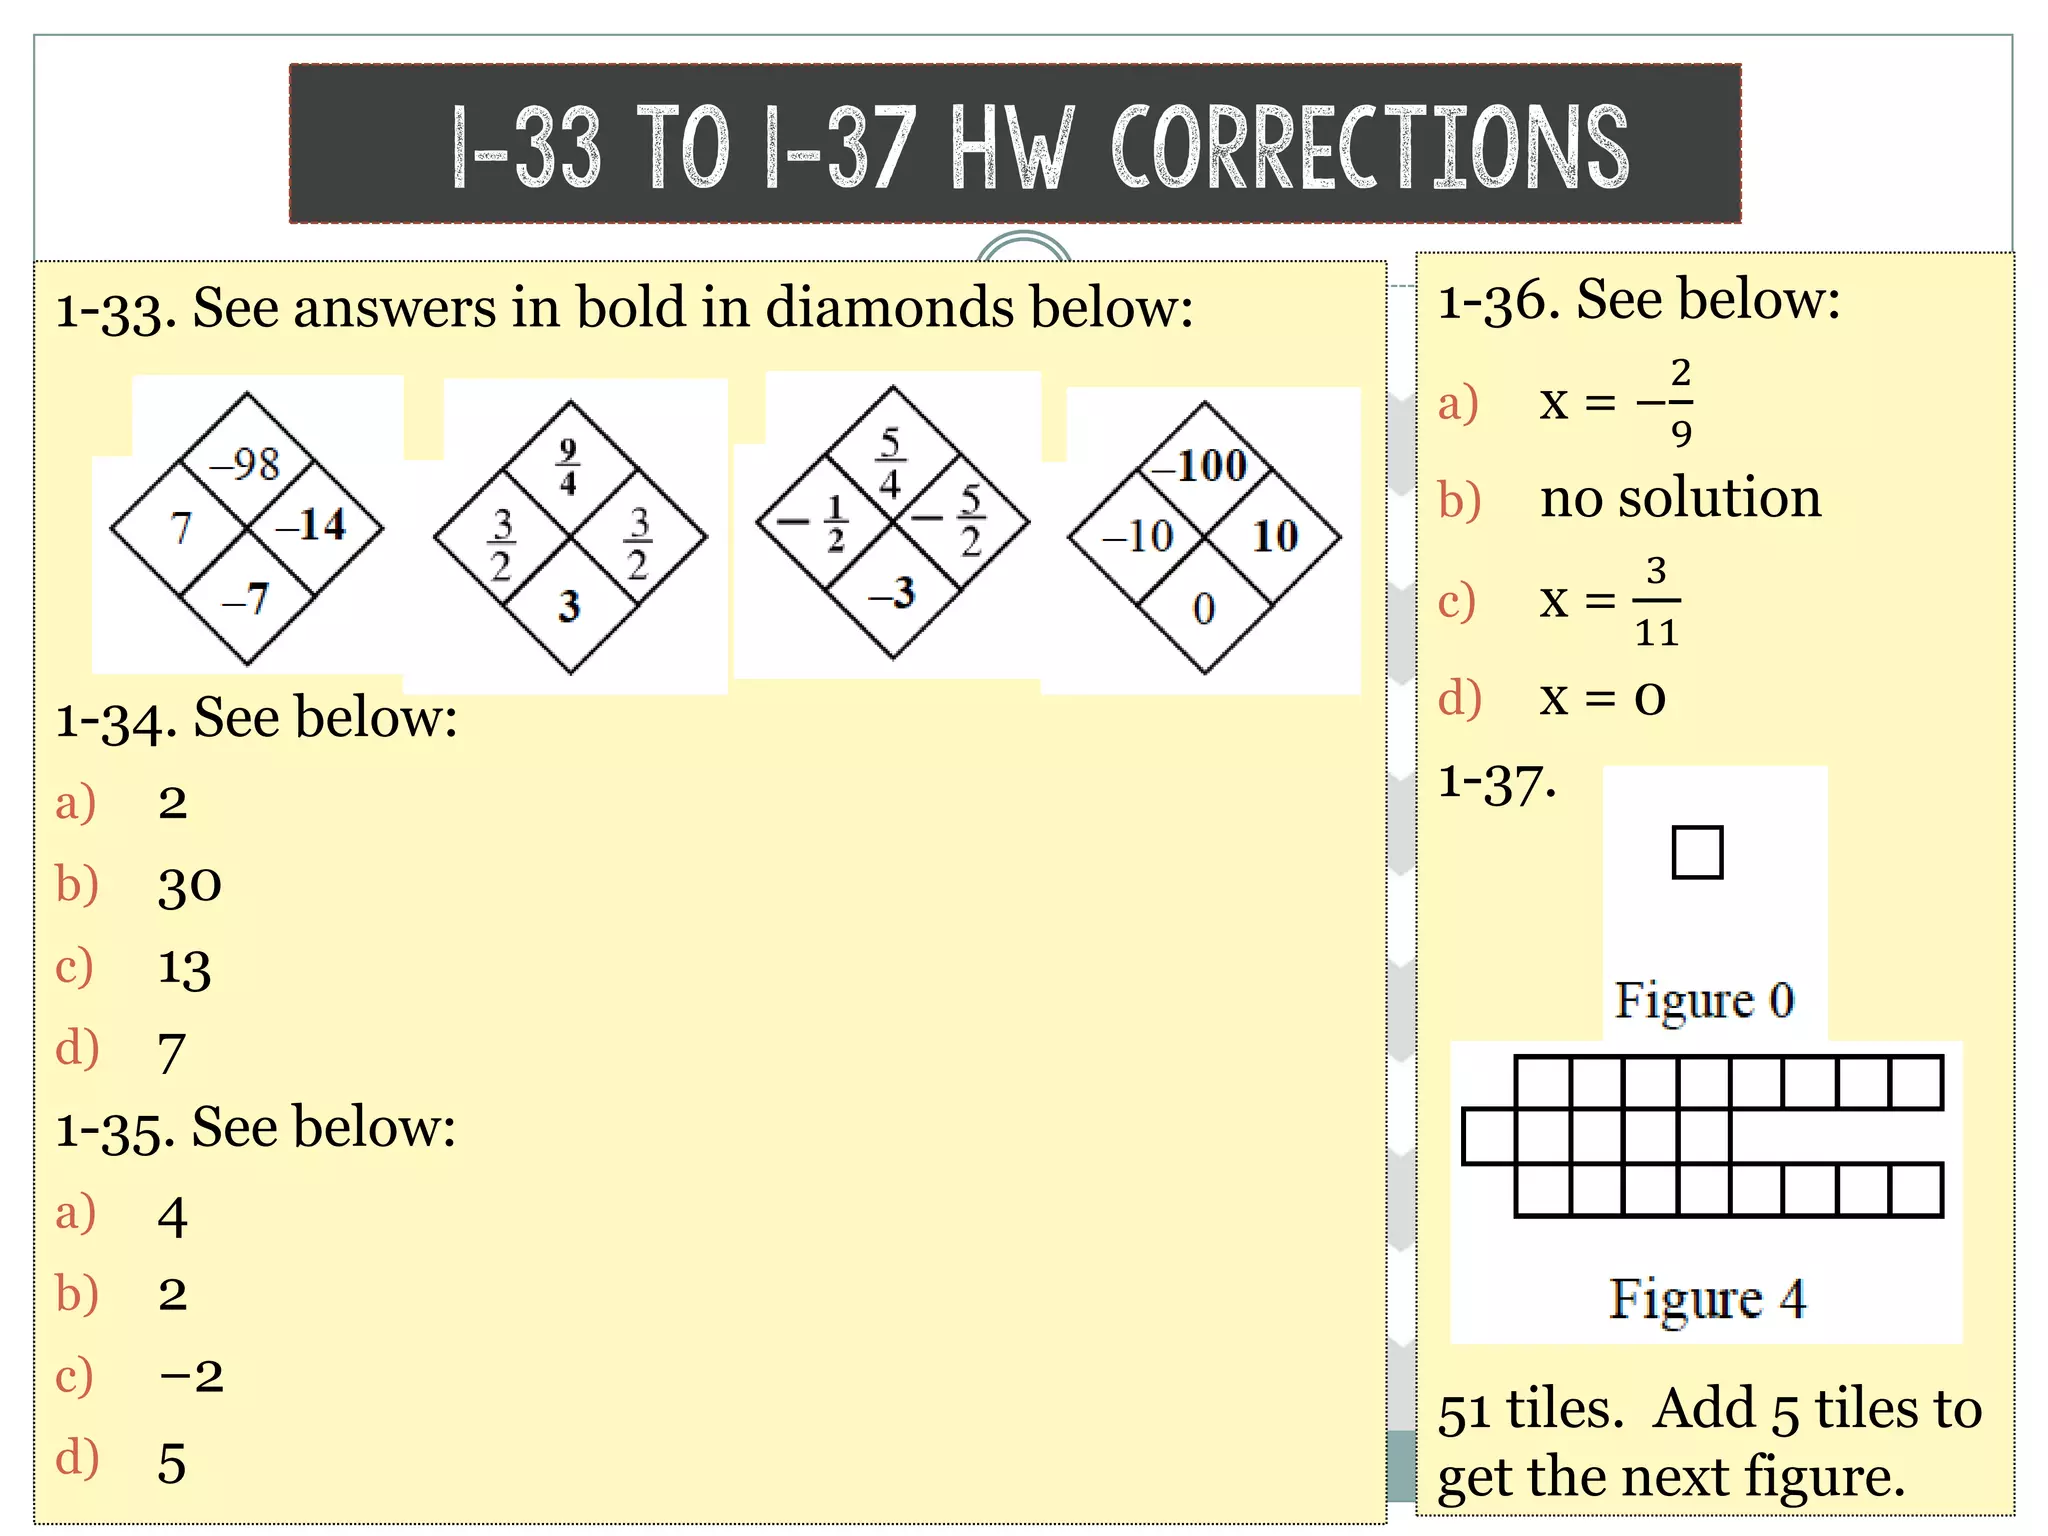
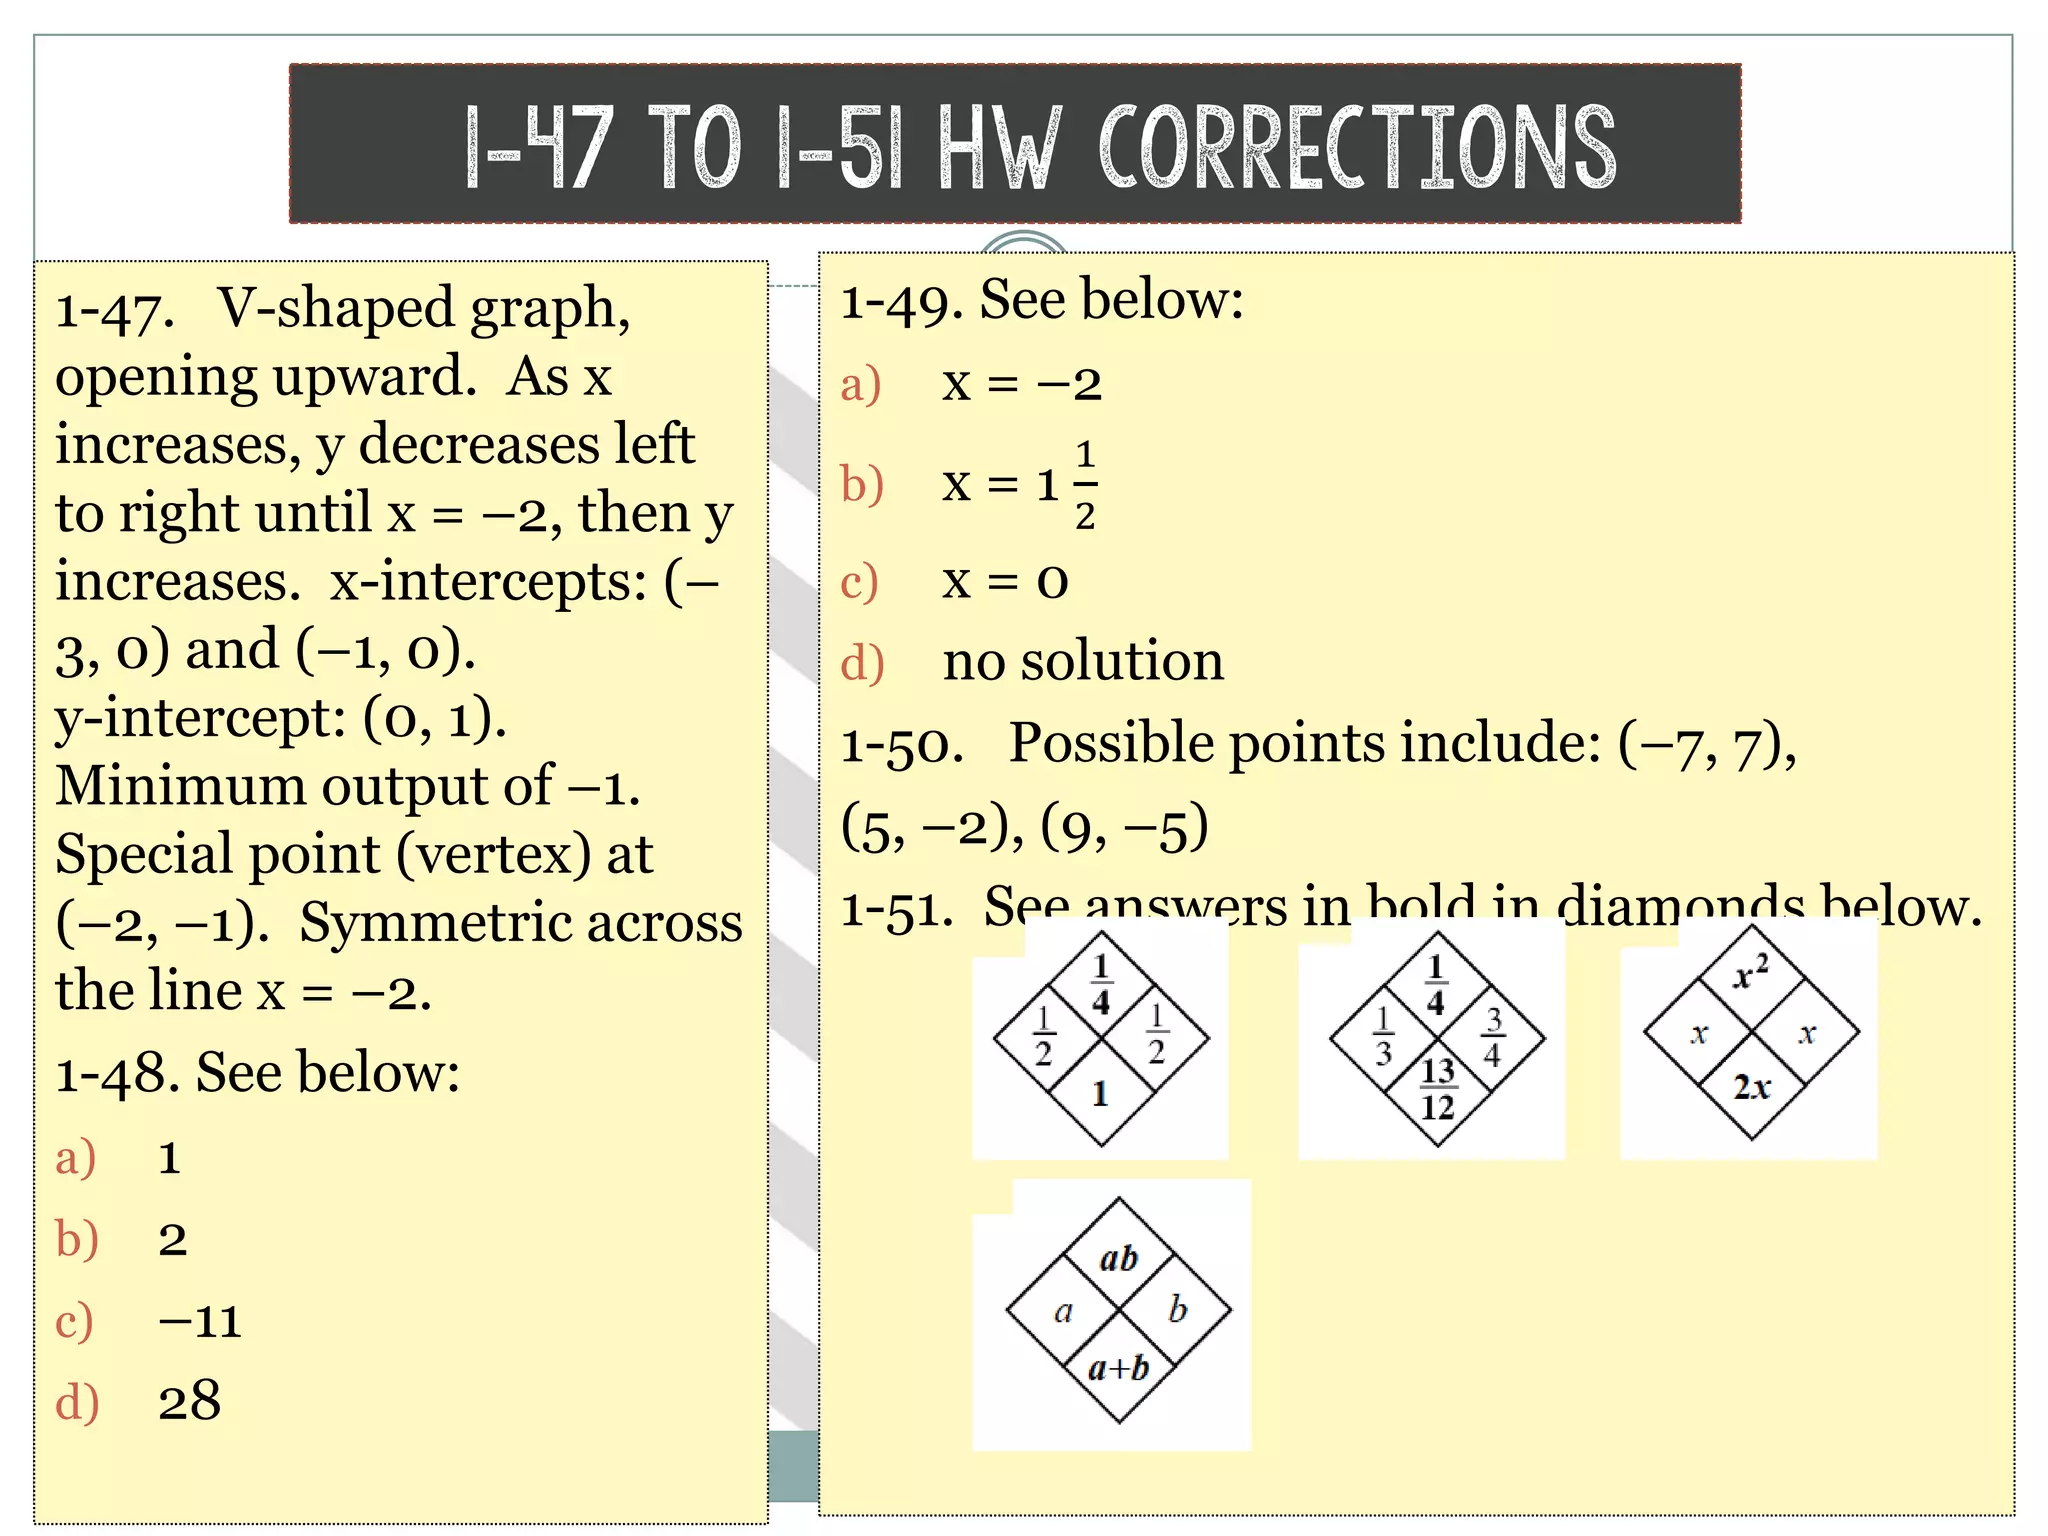
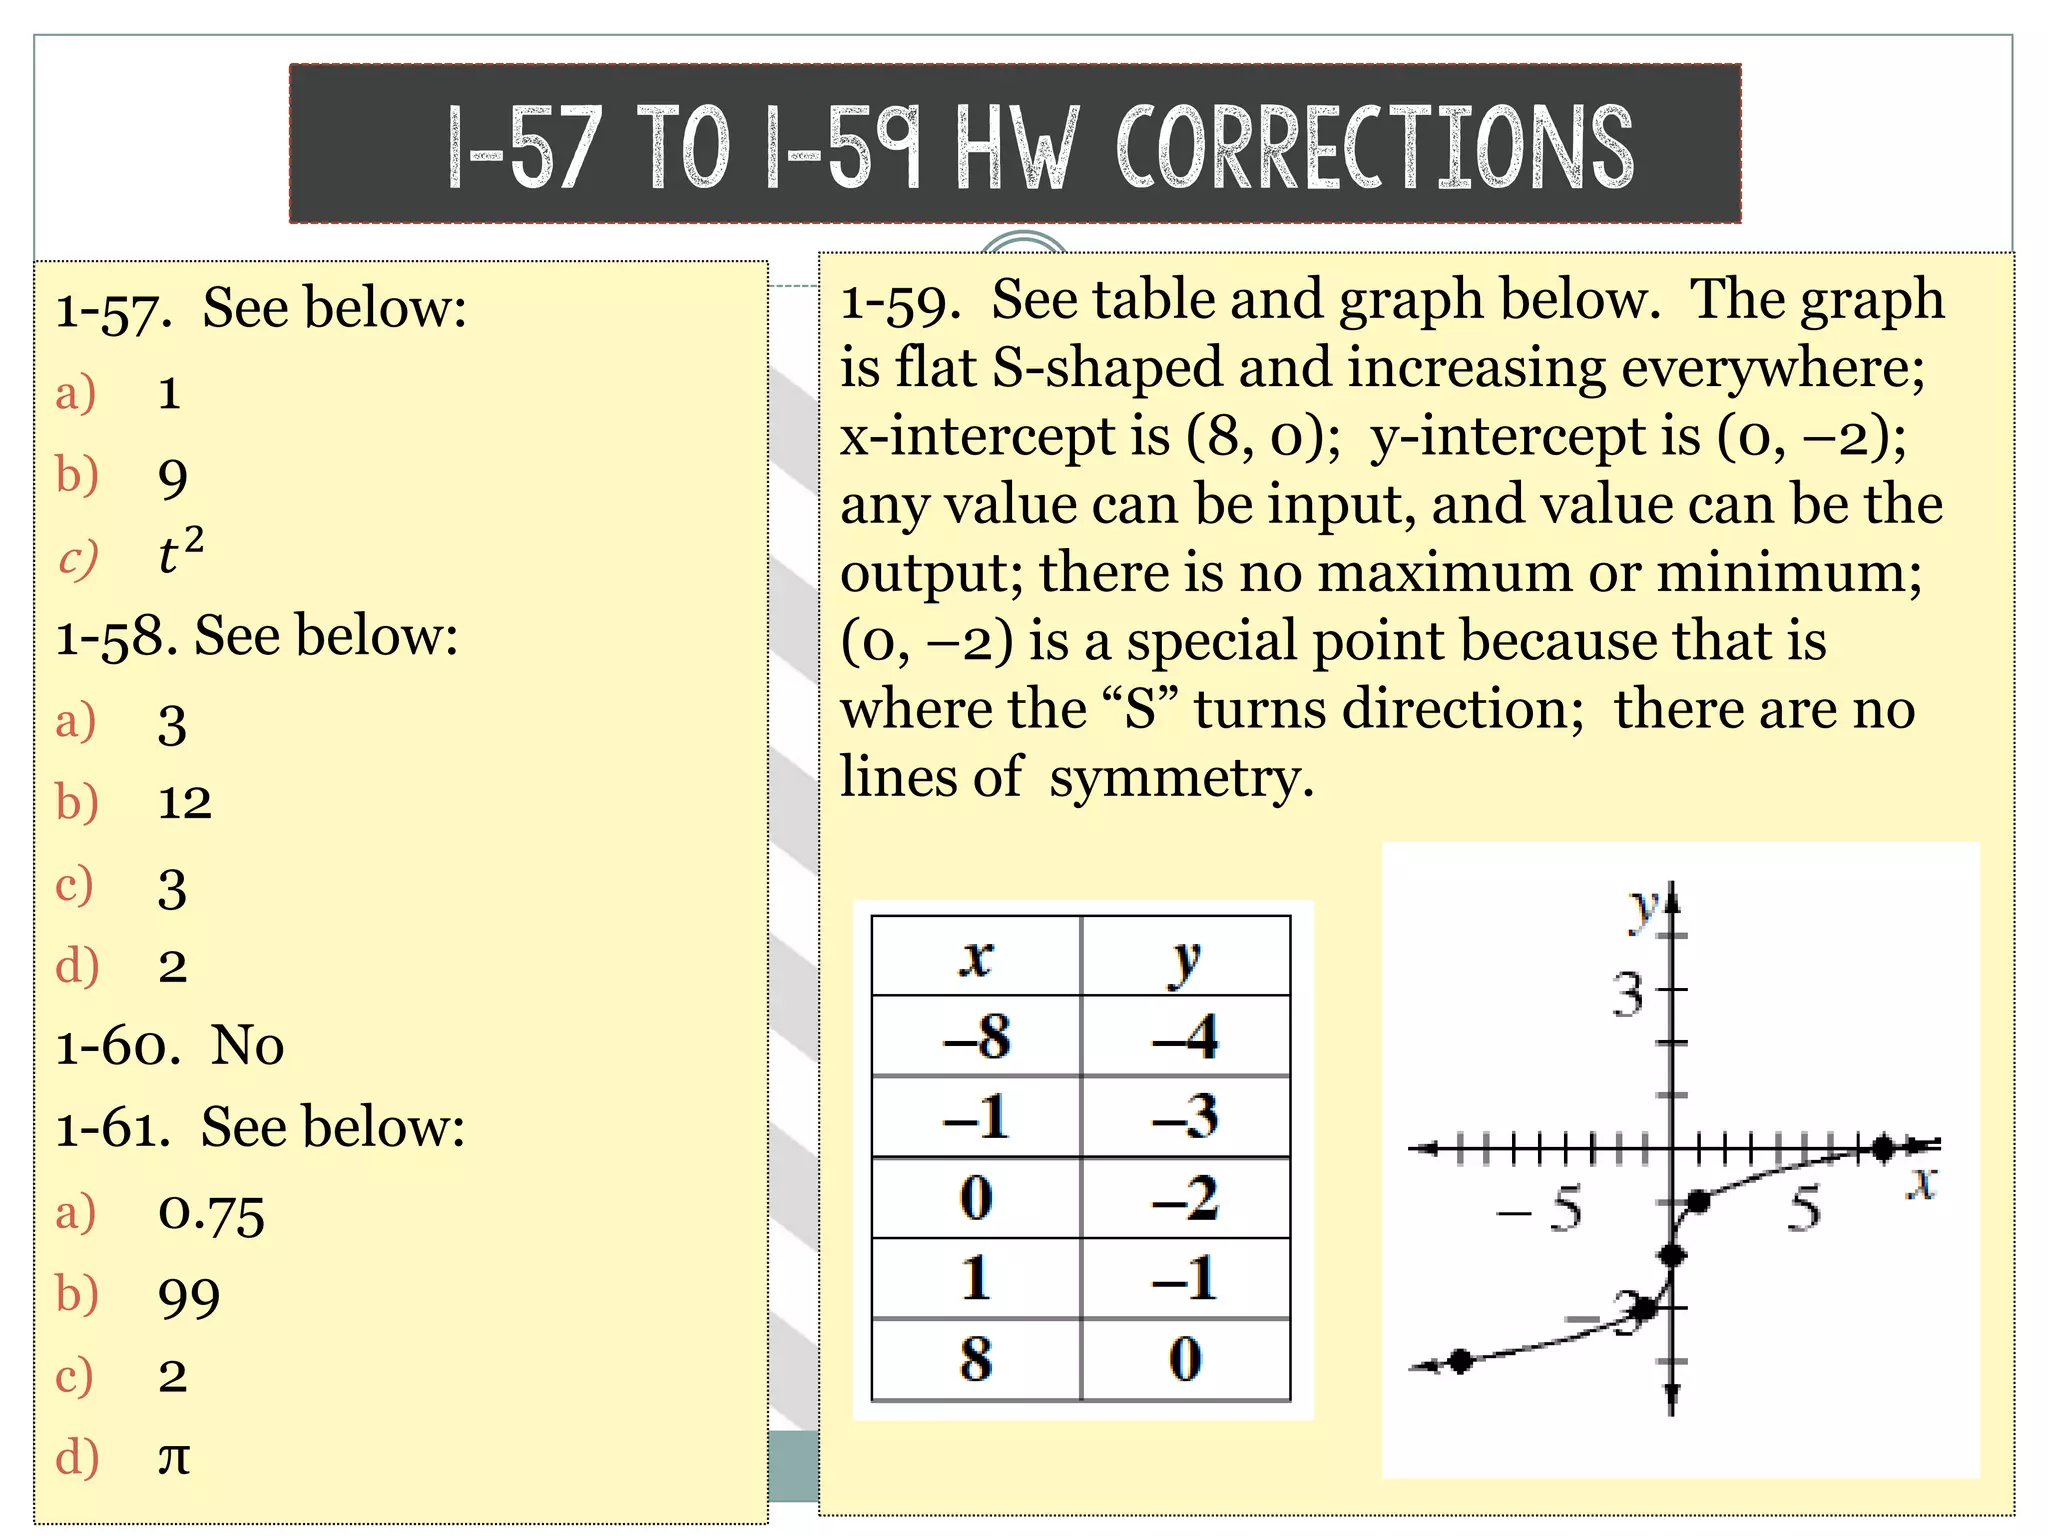
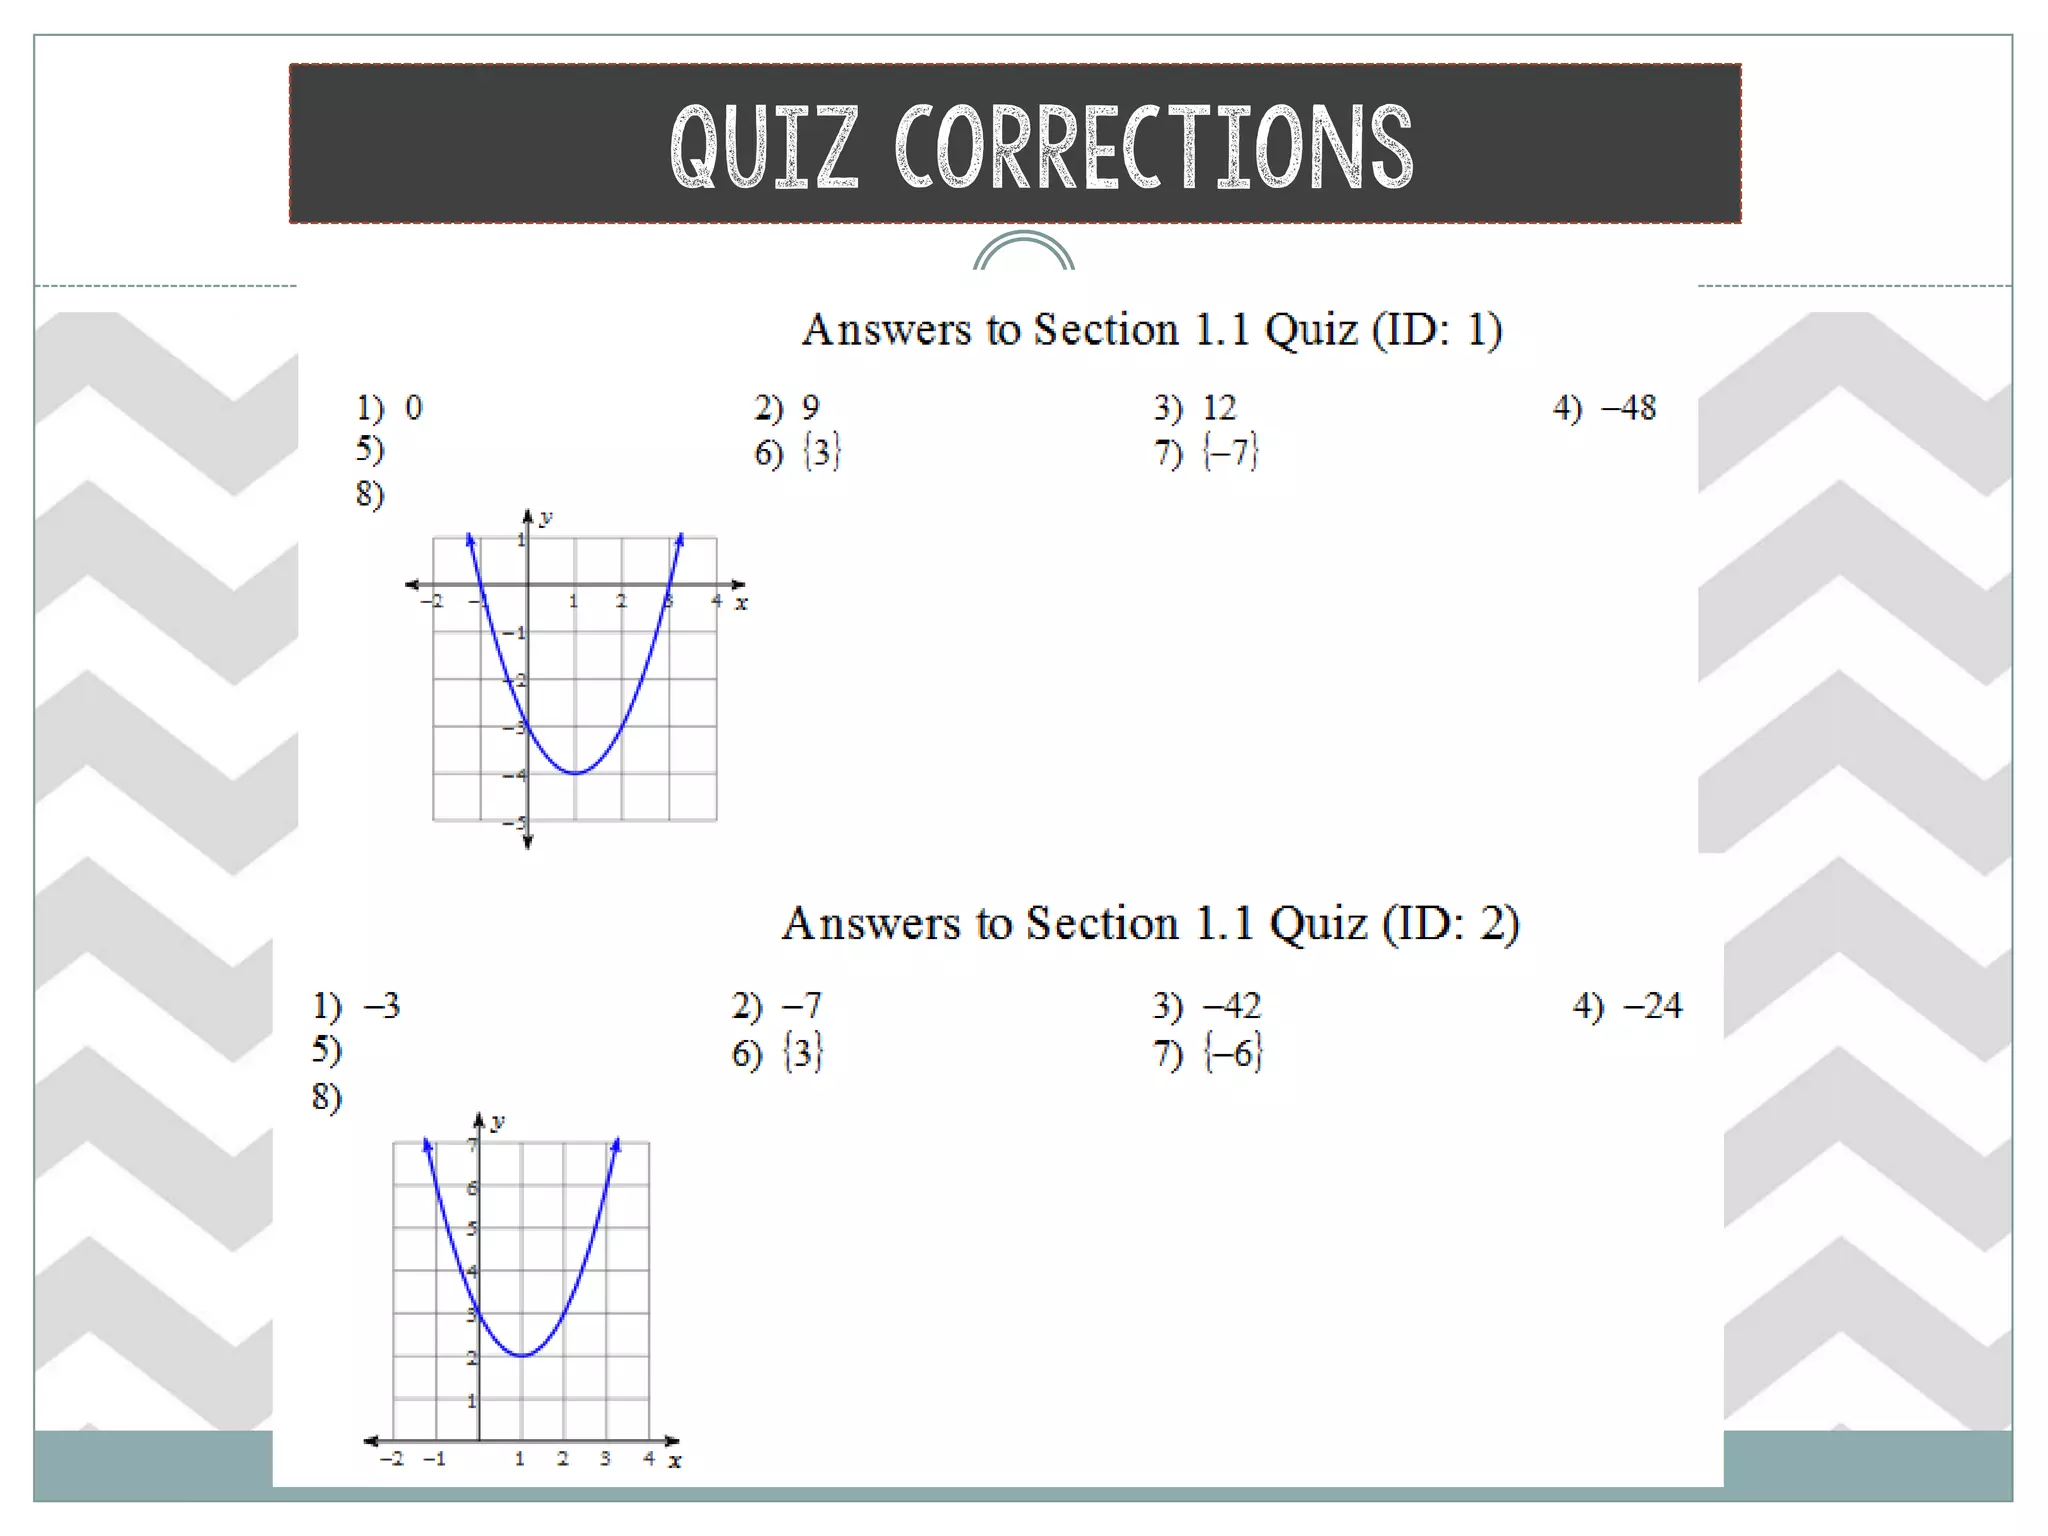
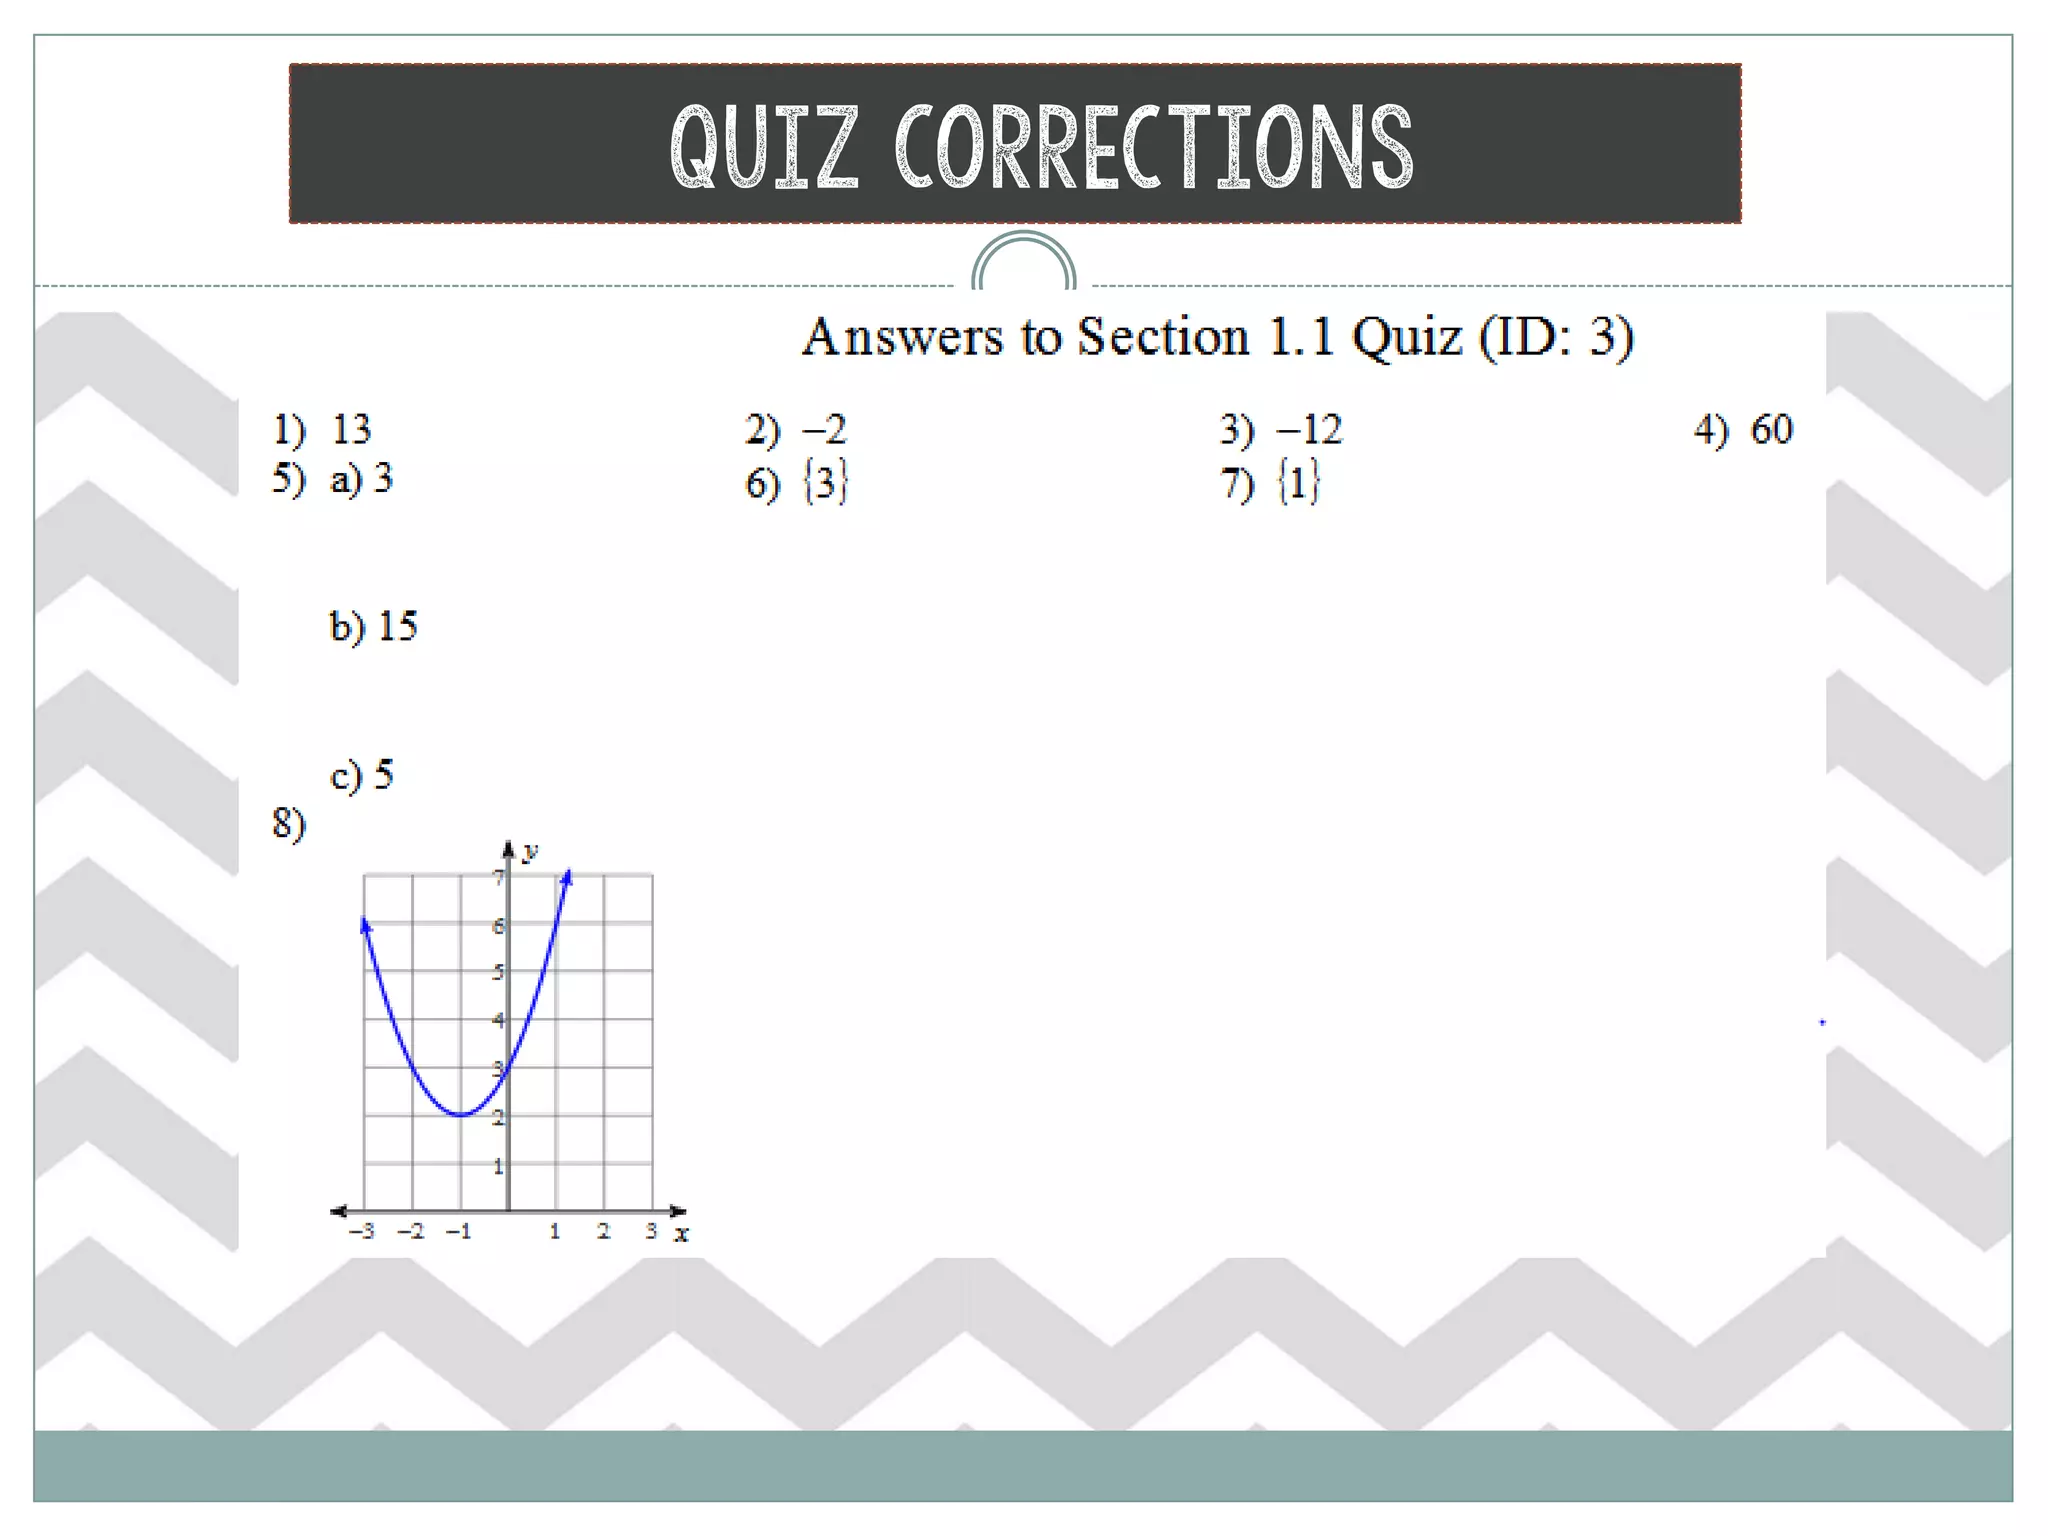
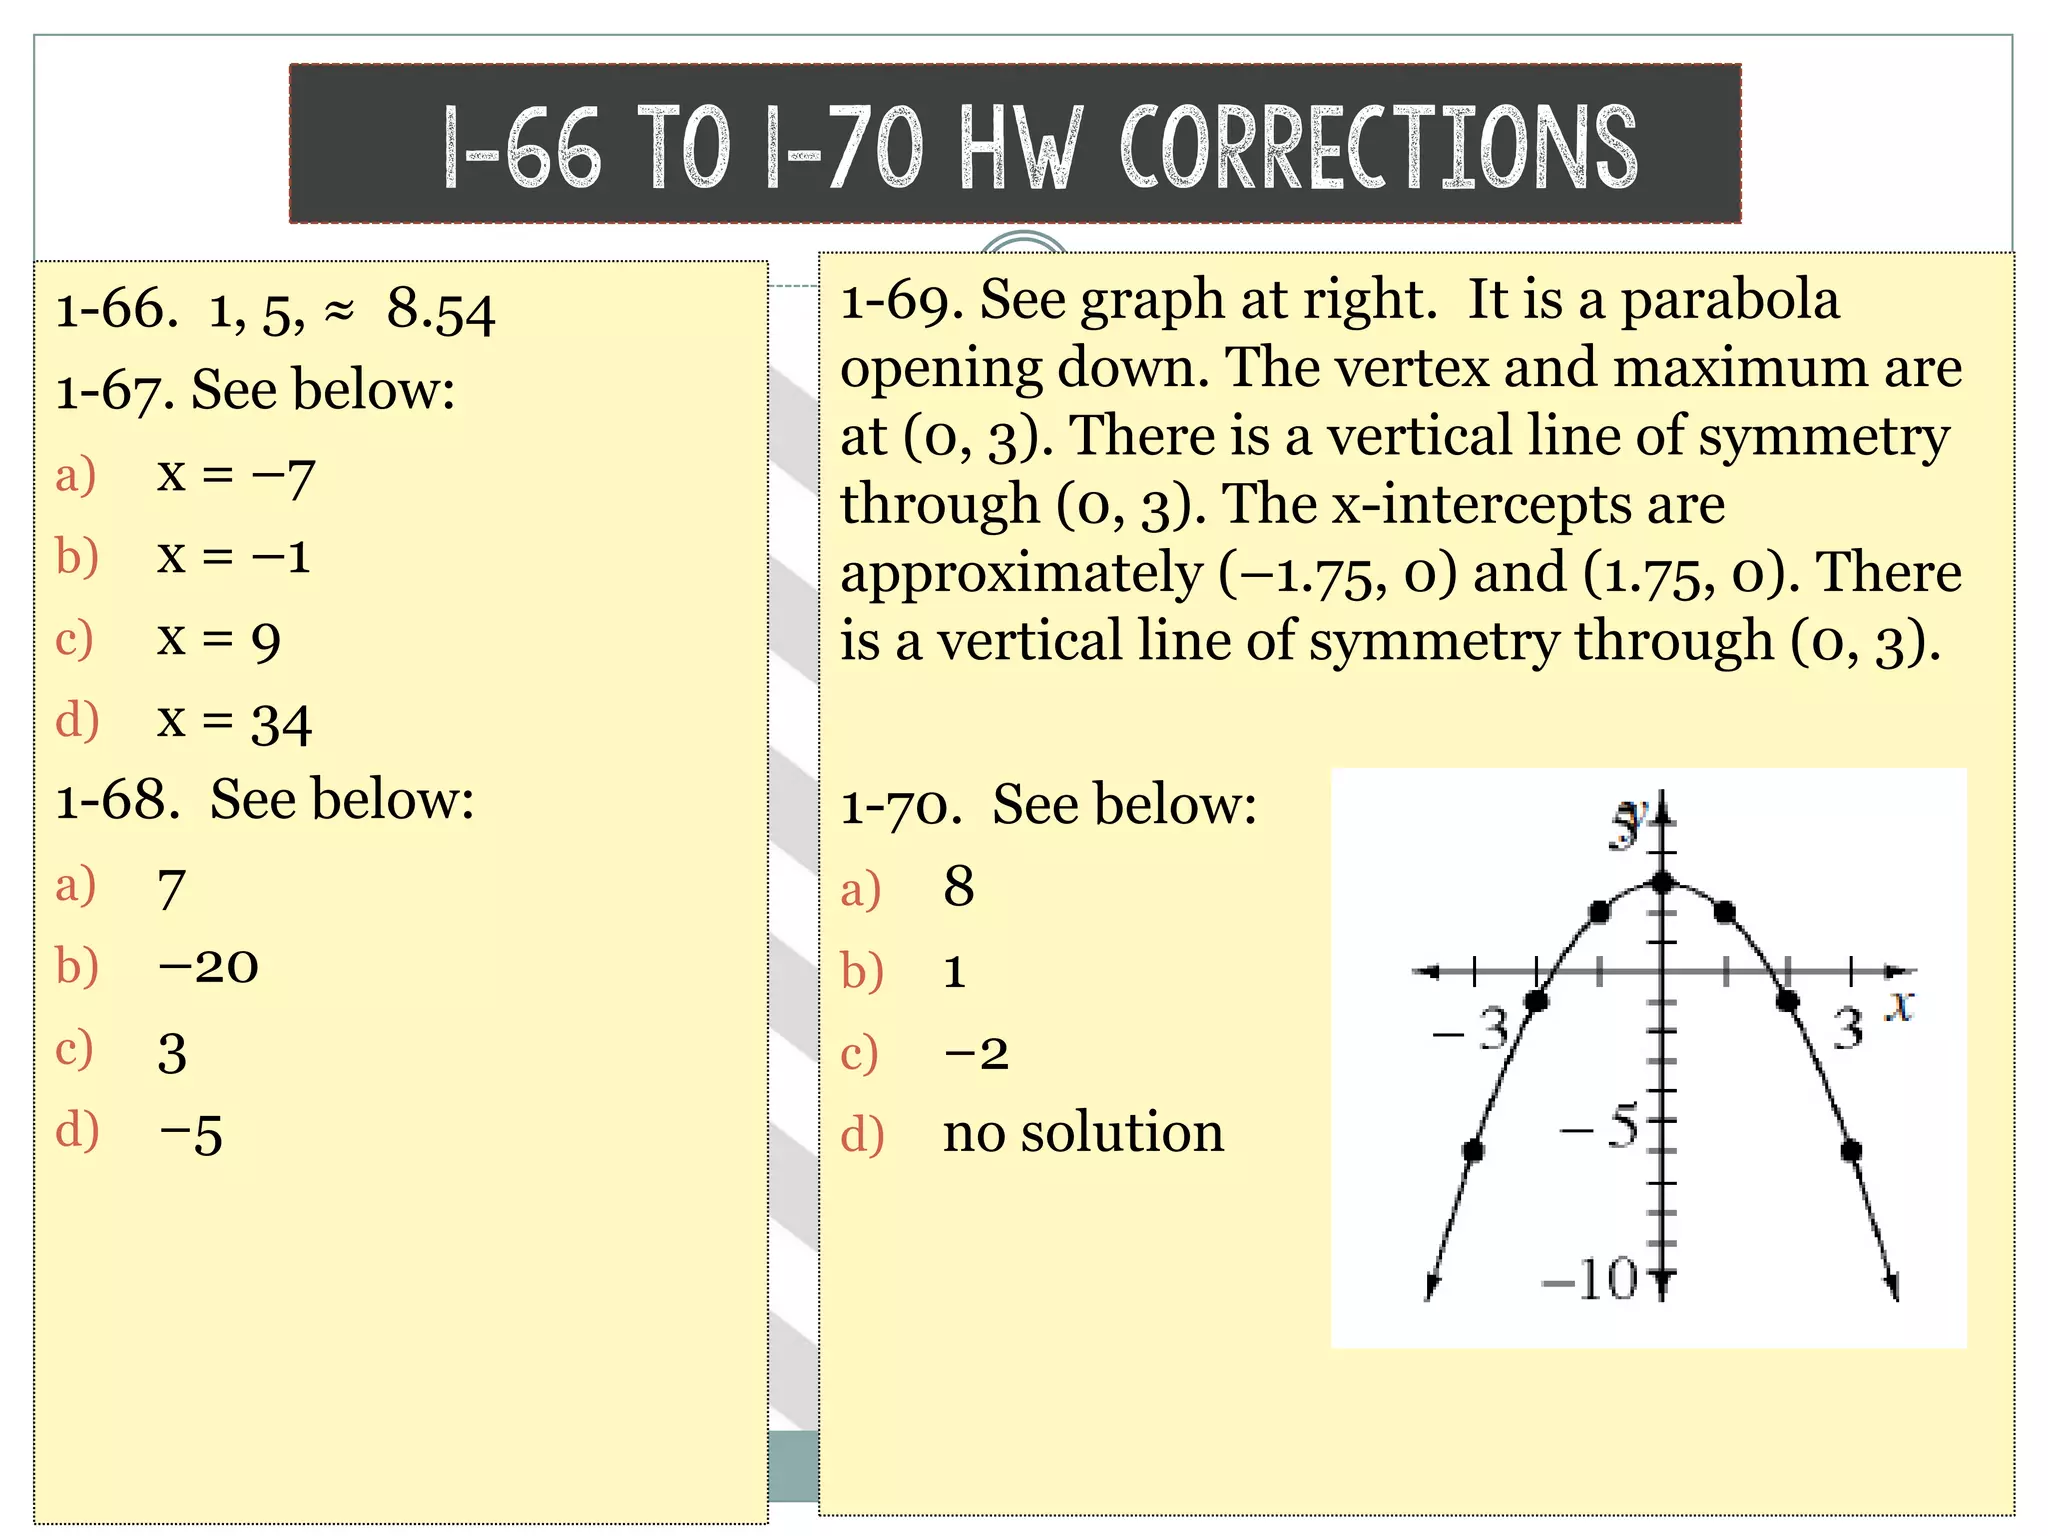
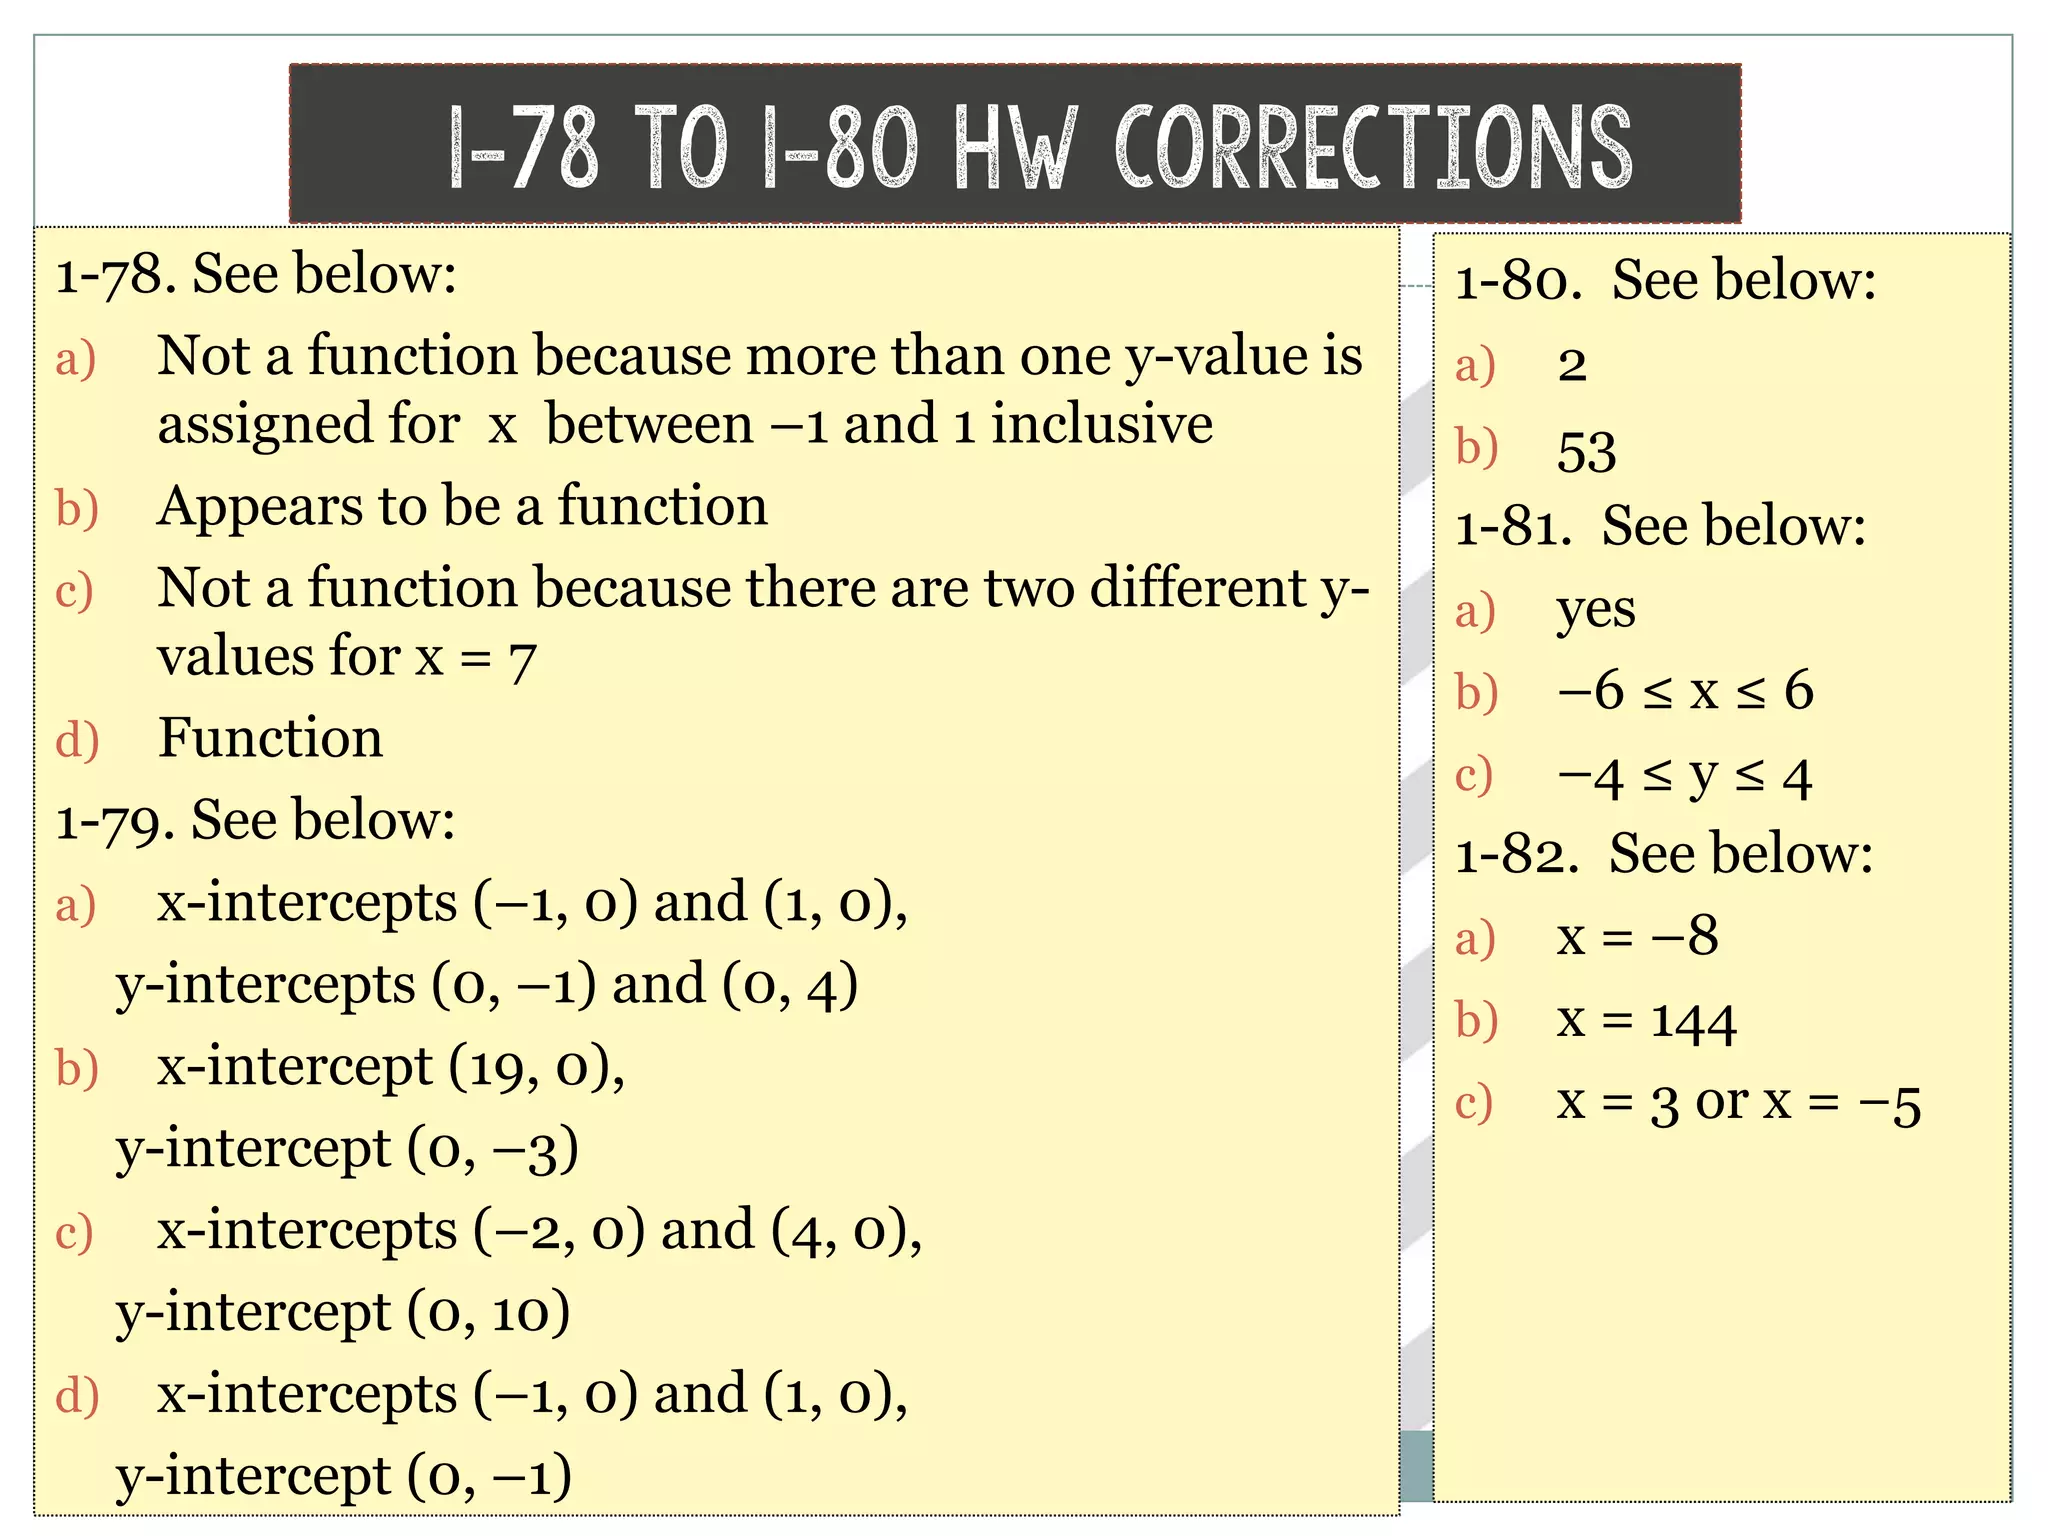
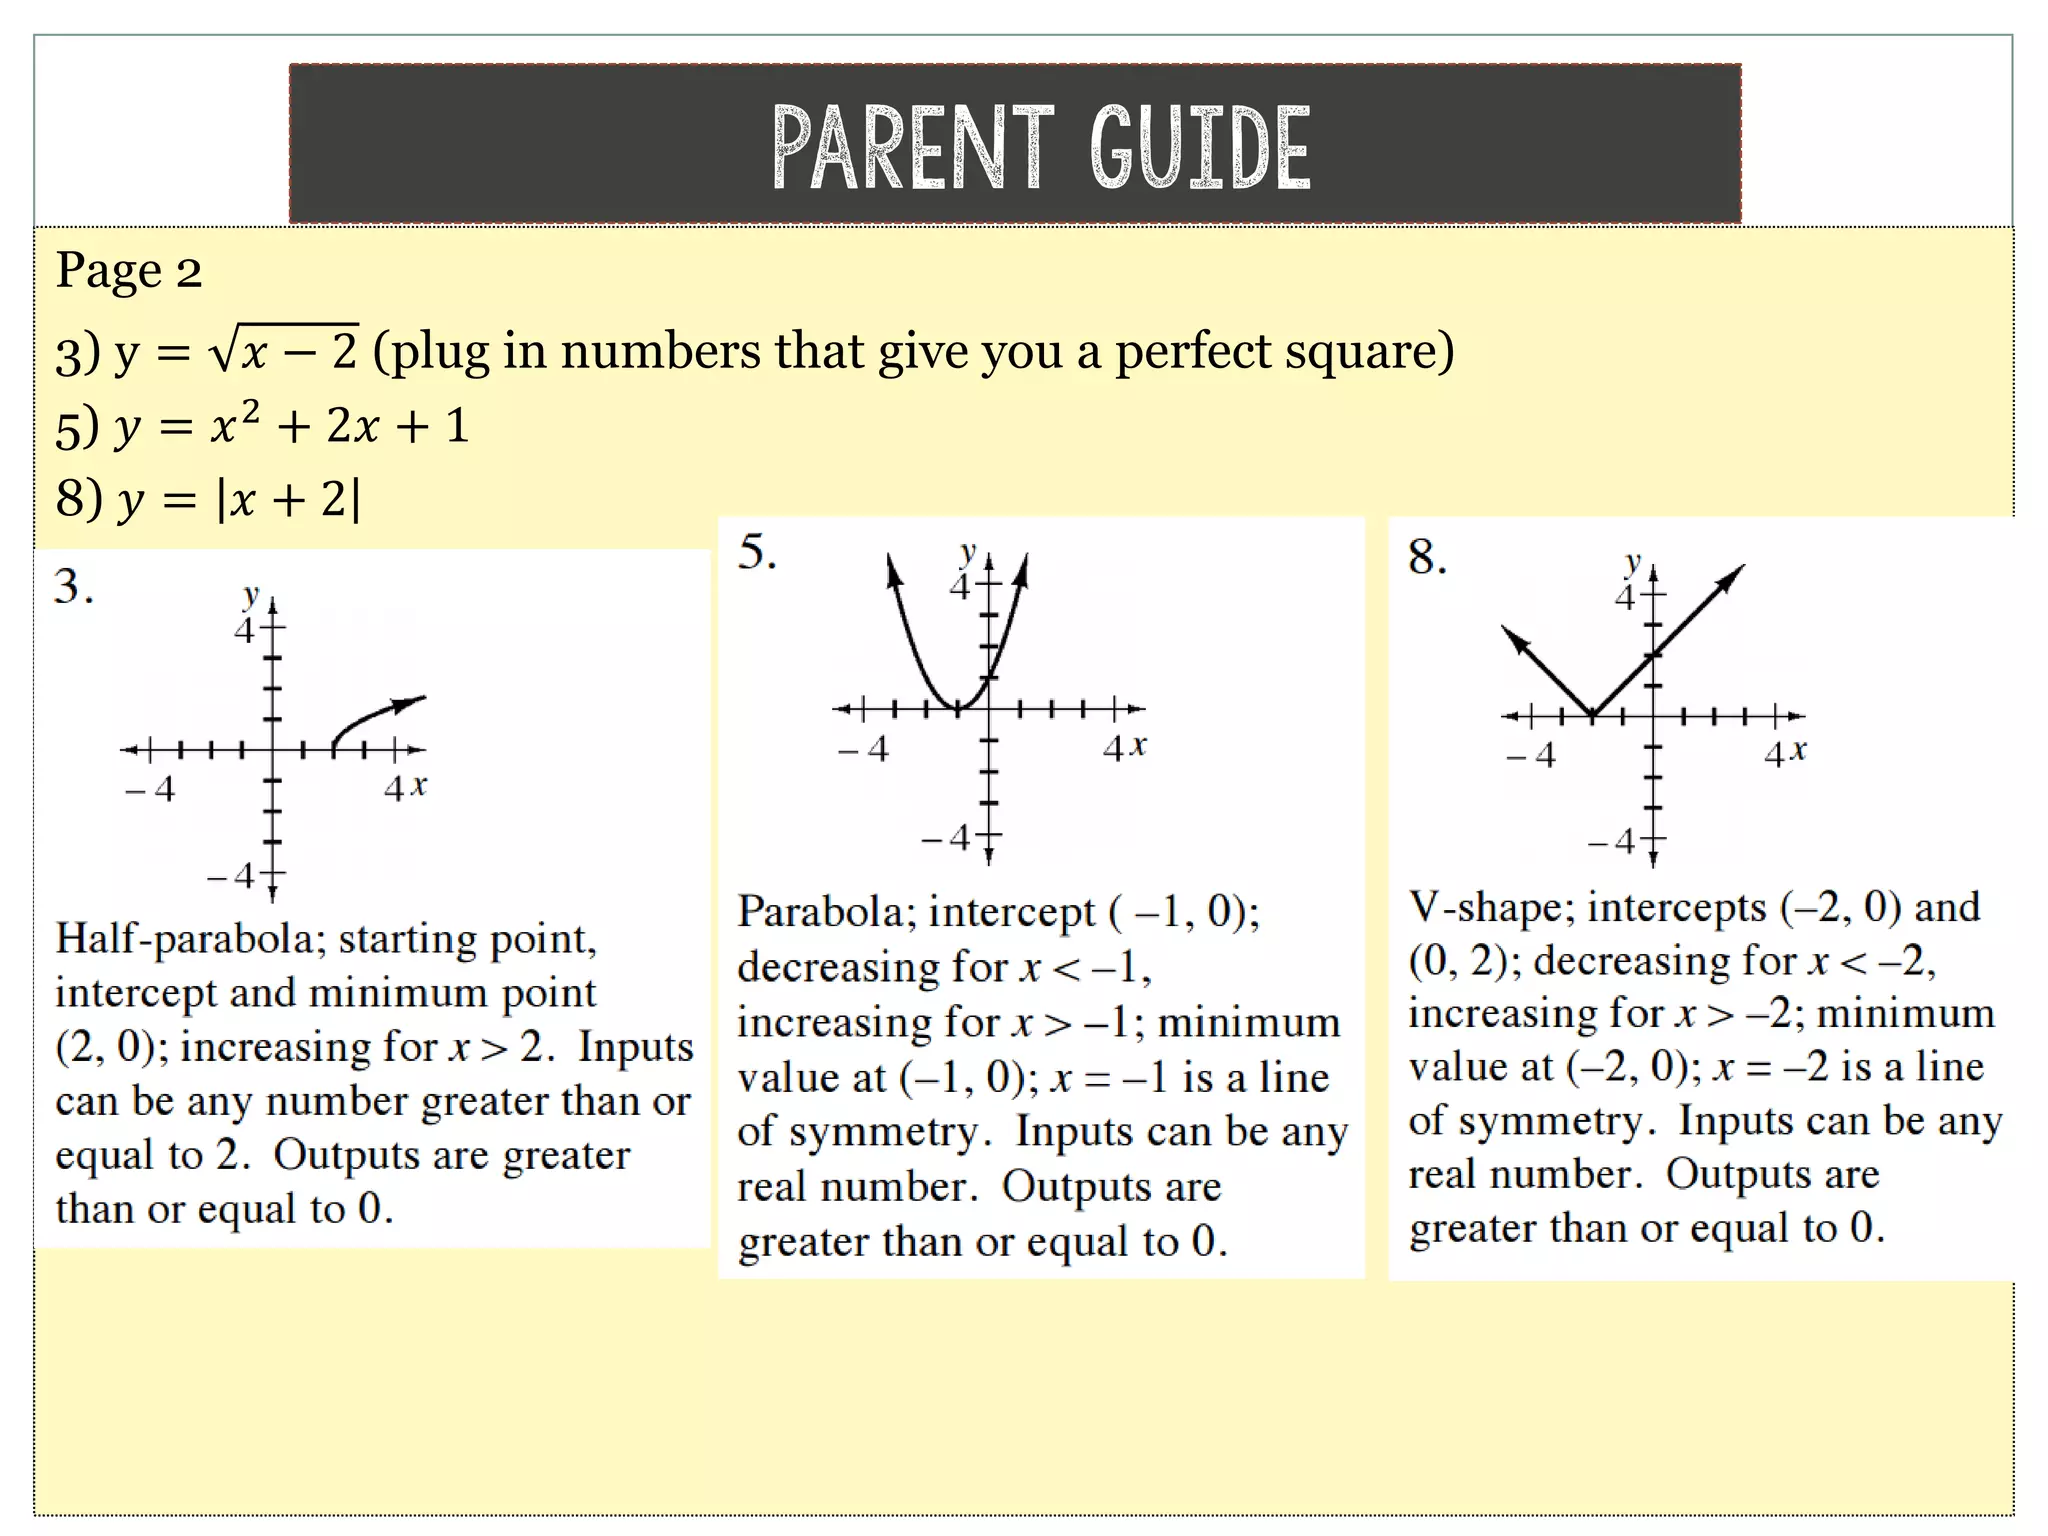
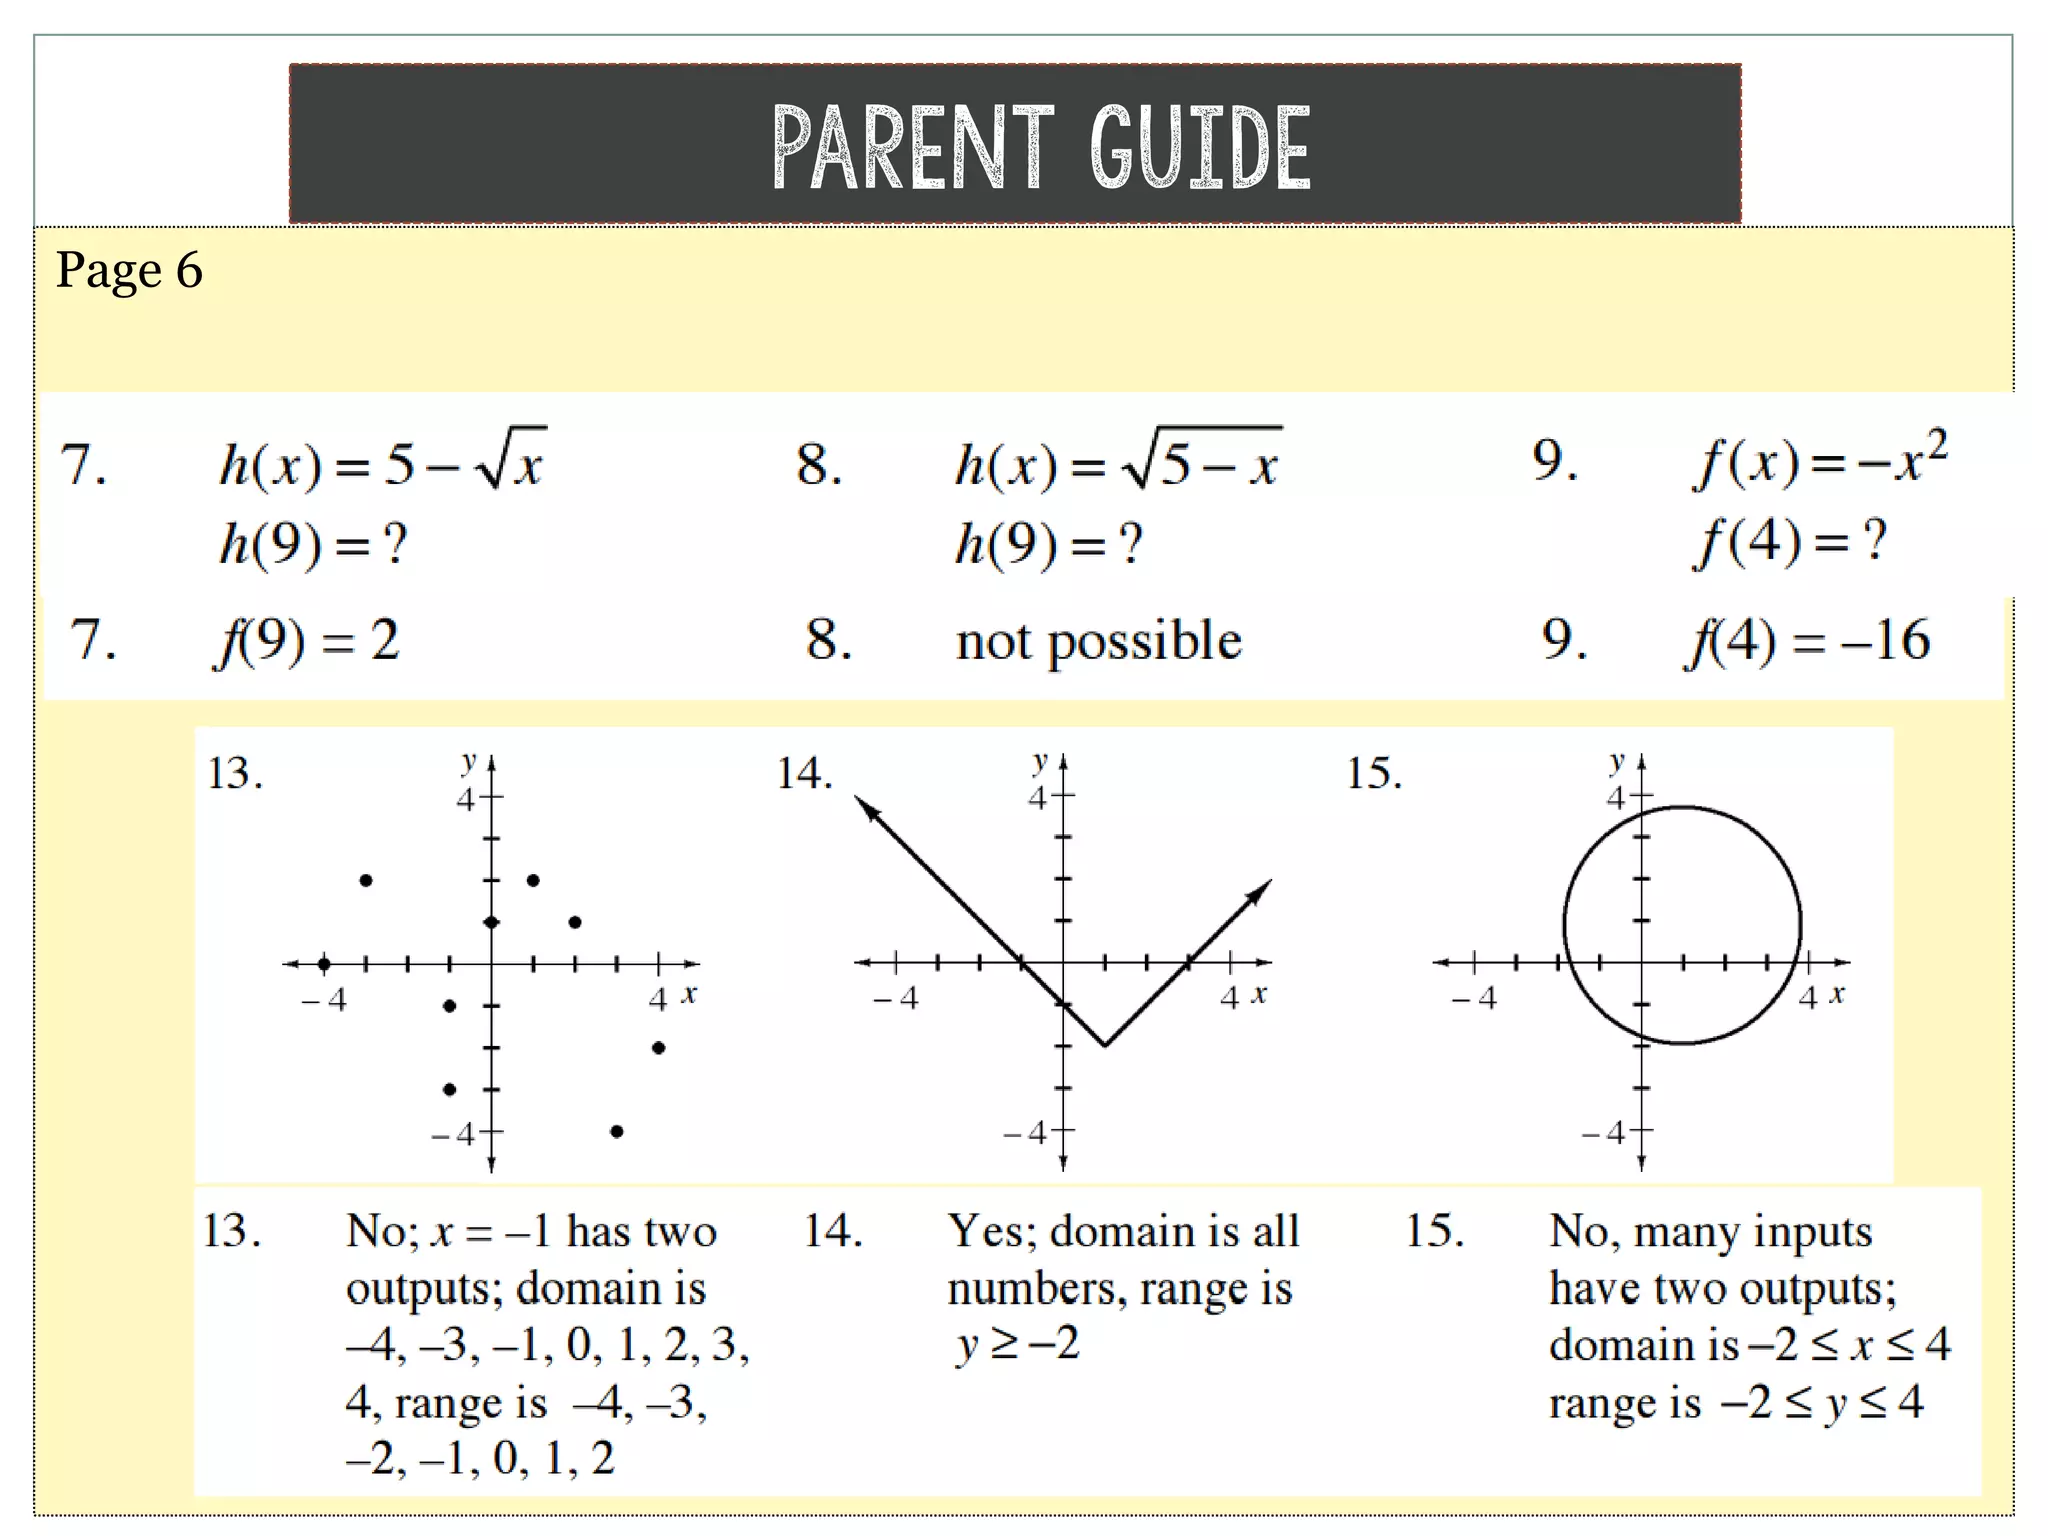

The document provides homework corrections and answers for various algebra problems from Chapter 1 on functions from Orcutt Academy High School's algebra 1 course, including corrections to homework problems, lab answers, and additional practice problems with worked out solutions shown.