Download as PDF, PPTX

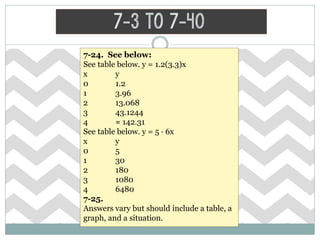


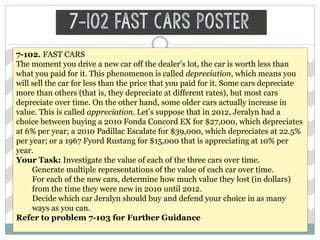
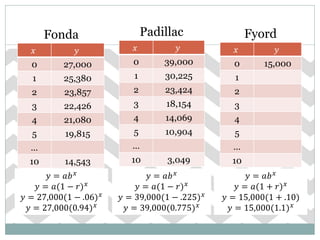
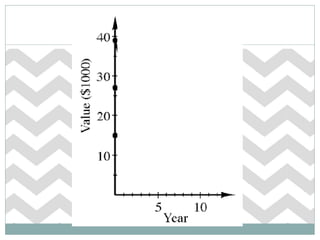


The document discusses depreciation rates for three cars: a 2010 Fonda Concord EX depreciating at 6% per year, a 2010 Padillac Escalate depreciating at 22.5% per year, and a 1967 Fyord Rustang appreciating at 10% per year. It tasks the reader with generating representations of the value of each car over time and determining which car Jeralyn should buy based on value retention from 2010 to 2012.