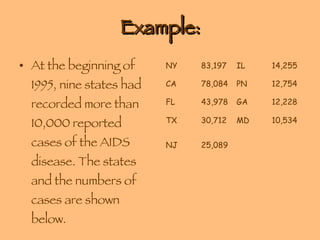
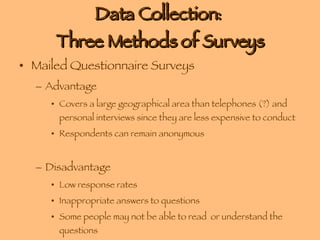
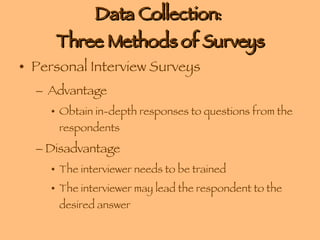
Chapter 1: The Nature of Probability & Statistics
Definitions Statistics is the science of conducting studies to collect, organize, summarize, analyze, and draw conclusions from data. A variable is a characteristic or attribute that can assume different values. Data are the values (measurements or observations) that the variables can assume.
Two Main Branches of Statistics Descriptive Statistics  consists of the collection, organization, summarization, and presentation of data.
Two Main Branches of Statistics A  population  consists of all subjects (human or otherwise) that are being studied. A  sample  is a group of subjects selected from a population.
Examples: Population vs. Sample Determine if the described data set is a population or a sample. If it is a sample, describe the population. A survey of every 4th customer leaving a grocery store to determine how many times per week they shop at a grocery store. The time it takes each mail carrier in zip code 91210 to complete a Saturday route. The ages at the time of their first marriage of 25 residents in an assisted living facility that houses 100 residents. The number of years of employment of all registered nurses in a maternity ward at a local hospital.
Example A grocery store wants to estimate the weight of cabbages that they receive from on of their produce suppliers. To accomplish this, they select and weigh 36 cabbages from a shipment of 150 cabbages. Identify the population of interest. Identify the sample.
Two Main Branches of Statistics Inferential statistics  consists of generalizing from samples to populations, performing estimations and hypothesis tests, determining relationships among variables and making predictions.
Example: At the beginning of 1995, nine states had recorded more than 10,000 reported cases of the AIDS disease. The states and the numbers of cases are shown below. NY 83,197 IL 14,255 CA 78,084 PN 12,754 FL 43,978 GA 12,228 TX 30,712 MD 10,534 NJ 25,089
Variables and Types of Data Variables can be classified as qualitative or quantitative. Qualitative variables are variables that can be placed into distinct categories according to some characteristic or attribute. Quantitative variables are numerical and can be ordered or ranked. Discrete variables assume values that can be counted.  Continuous variables can assume an infinite number of values between any two specific values. They are obtained by measuring. The often include fractions and decimals.
Examples: The amount of water consumed daily by a teenager. The number of freshmen enrolled at a university at Fall 2006. The type of beverage selected on a lunch pre-order. Birth month of students in a kindergarten class. Zip codes in Richland and Lexington Counties.
Levels of Measurement The nominal level of measurement classifies data into mutually exclusive (nonoverlapping), exhausting categories in which no order or ranking can be imposed on the data.
Level of Measurement The ordinal level of measurement classifies data into categories that can be ranked; however, precise differences between the ranks do not exist.
Level of Measurement The interval level of measurement ranks data, and precise differences between units of measure do exist. However, there is no meaningful zero.
Level of Measurement The ratio level of measurement possesses all the characteristics of interval measurement, and there exists a true zero. In addition, true ratios exist when the same variable is measured on two different members of the population.
Data Collection:  Three Methods of Surveys Telephone Surveys Advantage Less costly than personal interviews People are more candid since they are not face-to-face Disadvantage Some people don’t have telephones Some people will not be home when the calls are made; leading to bias
Data Collection:  Three Methods of Surveys Mailed Questionnaire Surveys  Advantage Covers a large geographical area than telephones (?) and personal interviews since they are less expensive to conduct Respondents can remain anonymous Disadvantage Low response rates Inappropriate answers to questions Some people may not be able to read  or understand the questions
Data Collection:  Three Methods of Surveys Personal Interview Surveys Advantage Obtain in-depth responses to questions from the respondents Disadvantage The interviewer needs to be trained The interviewer may lead the respondent to the desired answer
Other Methods of Data Collection Surveying records Direct Observation
Why Use a Sample? Saves time and money The population is often too large to observe/interview
Five Basic Methods of Sampling A  random sample  is selected by using chance methods or random numbers. We can use computers and calculators to generate random numbers. A  systematic sample  is obtained by numbering each subject of the population and then selecting every k th  subject.
Five Basic Methods of Sampling A  stratified sample  is obtained by dividing the population into groups (called strata) according to some characteristic, then sampling from each group. A  cluster sample  is obtained by using intact groups called clusters. A  convenience sample  is obtained by using subjects that are readily available.
Example: Sampling Methods For the following scenarios, determine which sampling technique was used. Also list any biases that may be present. Average weight of newborn baby boys: Twelve hospitals are selected at random, and the weight of each baby boy born in January is recorded. Percentage of 18 – 25 year-olds who used drugs during the past 30 days: At a shopping mall, people who appear to be in the proper age group are stopped and asked for their age and whether they have used drugs in the past 30 days.
Example: Sampling Methods Average length (in days) of a sexual harassment trial: The records of a law firm are analyzed, and the lengths of all of their sexual harassment trials are recorded. Effectiveness of a pain reliever against migraine headaches: Patients who have a history of migraines are divided into three groups, using random numbers. The three groups are given a placebo, a half-dose and a full-dose of the medication. The patients are then asked to rate the effectiveness of the medication on a scale of 1 to 10.
Types of Statistical Studies In an  observational study , the researcher merely observes what is happening or what has happened in the past and tries to draw conclusions based on these observations. Advantages Occurs in a natural setting Can be done in situations where it would be unethical to conduct an experiment (Tuskegee experiment) Can be done using variables that cannot be manipulated (gender, dominant hand, race)
Types of Statistical Studies Observational Study Disadvantages Can’t establish cause and effect since the variables are not controlled. Can be expensive and time consuming Researcher may have to rely on measurements collected or reported by others  People  forget and fudge the truth
Types of Statistical Studies In an  experimental study  the researcher manipulates one of the variables and tries to determine how the manipulation influences other variables. The  independent variable  (explanatory variable) in the experimental study is the one that is being manipulated. The  dependent variable  is called the outcome variable. It is the variable that is studied to see if it has changed significantly due to the manipulation of the independent variable.
Types of Statistical Studies Experimental Study The treatment group receives a special “treatment” while the control group does not. Advantages Researcher can decide how to select subjects and how to assign them to groups The researcher controls the independent variable Disadvantages Occurs in an unnatural setting (disposable baby bottles) Hawthorne effect – subject behavior changes because they know that they are being observed.
Types of Statistical Studies A  case-control  study  is an  observational  study that resembles an  experiment  because the sample naturally divides into two (or more) groups. The participants who engage in the behavior under study form the cases, like a treatment group in an experiment. The participants who do not engage in the behavior are the controls, like a control group in the experiment
Example: Types of  Statistical Studies For the following questions, what type of statistical study (observational study or experiment) is most likely to lead to an answer? Why? If an an observational study, state whether it should be a case control study. If an experiment, state whether it should be single- or double-blind.  What is the mean income of stock brokers?   
Example: Types of  Statistical Studies Do seatbelts save lives?     Can lifting weights improve runners’ times in a 10-kilometer (10K) race?  Does skin contact with a particular glue cause a rash?     Can a new herbal remedy reduce the severity of colds?   
Uses and Misuses of Statistics Some people use statistics like a drunken man uses a lamp post – for support rather than illumination.
Seventy-two percent of Americans squeeze the toothpaste tube from the top. This and other not-so-serious findings are presented in  The First Really Important Survey of American Habits.  Those results are based on 7000 respondents from the 25,000 questionnaires that were mailed. What is wrong with this survey?
The New England Chronicles reports that women who eat lobster on a regular basis during their pregnancy tend to have healthier babies. A report sponsored by the Florida Citrus Commission concluded that cholesterol levels could be lowered by eating citrus products. Why might the conclusion be suspect?
Glamour  magazine published this survey result: "Seventy-nine percent of those who responded to our August survey say that they believe America has become too lawsuit-happy." The survey question was published in the magazine and readers could respond by mail, fax, or e-mail (Tellus@Galamour. com). How valid is the 79% result?
In a study on college campus crimes committed by students high on alcohol or drugs, a mail survey of 1875 students was conducted. A  USA  Today article noted, "Eight percent of the students responding anonymously say they've committed a campus crime. And 62% of that group say they did so under the influence of alcohol or drugs." Assuming that the number of students responding anonymously is 1875, how many actually committed a campus crime while under the influence of alcohol or drugs?

Chapter 1

  • 1.
    Chapter 1: TheNature of Probability & Statistics
  • 2.
    Definitions Statistics isthe science of conducting studies to collect, organize, summarize, analyze, and draw conclusions from data. A variable is a characteristic or attribute that can assume different values. Data are the values (measurements or observations) that the variables can assume.
  • 3.
    Two Main Branchesof Statistics Descriptive Statistics consists of the collection, organization, summarization, and presentation of data.
  • 4.
    Two Main Branchesof Statistics A population consists of all subjects (human or otherwise) that are being studied. A sample is a group of subjects selected from a population.
  • 5.
    Examples: Population vs.Sample Determine if the described data set is a population or a sample. If it is a sample, describe the population. A survey of every 4th customer leaving a grocery store to determine how many times per week they shop at a grocery store. The time it takes each mail carrier in zip code 91210 to complete a Saturday route. The ages at the time of their first marriage of 25 residents in an assisted living facility that houses 100 residents. The number of years of employment of all registered nurses in a maternity ward at a local hospital.
  • 6.
    Example A grocerystore wants to estimate the weight of cabbages that they receive from on of their produce suppliers. To accomplish this, they select and weigh 36 cabbages from a shipment of 150 cabbages. Identify the population of interest. Identify the sample.
  • 7.
    Two Main Branchesof Statistics Inferential statistics consists of generalizing from samples to populations, performing estimations and hypothesis tests, determining relationships among variables and making predictions.
  • 8.
    Example: At thebeginning of 1995, nine states had recorded more than 10,000 reported cases of the AIDS disease. The states and the numbers of cases are shown below. NY 83,197 IL 14,255 CA 78,084 PN 12,754 FL 43,978 GA 12,228 TX 30,712 MD 10,534 NJ 25,089
  • 9.
    Variables and Typesof Data Variables can be classified as qualitative or quantitative. Qualitative variables are variables that can be placed into distinct categories according to some characteristic or attribute. Quantitative variables are numerical and can be ordered or ranked. Discrete variables assume values that can be counted. Continuous variables can assume an infinite number of values between any two specific values. They are obtained by measuring. The often include fractions and decimals.
  • 10.
    Examples: The amountof water consumed daily by a teenager. The number of freshmen enrolled at a university at Fall 2006. The type of beverage selected on a lunch pre-order. Birth month of students in a kindergarten class. Zip codes in Richland and Lexington Counties.
  • 11.
    Levels of MeasurementThe nominal level of measurement classifies data into mutually exclusive (nonoverlapping), exhausting categories in which no order or ranking can be imposed on the data.
  • 12.
    Level of MeasurementThe ordinal level of measurement classifies data into categories that can be ranked; however, precise differences between the ranks do not exist.
  • 13.
    Level of MeasurementThe interval level of measurement ranks data, and precise differences between units of measure do exist. However, there is no meaningful zero.
  • 14.
    Level of MeasurementThe ratio level of measurement possesses all the characteristics of interval measurement, and there exists a true zero. In addition, true ratios exist when the same variable is measured on two different members of the population.
  • 15.
    Data Collection: Three Methods of Surveys Telephone Surveys Advantage Less costly than personal interviews People are more candid since they are not face-to-face Disadvantage Some people don’t have telephones Some people will not be home when the calls are made; leading to bias
  • 16.
    Data Collection: Three Methods of Surveys Mailed Questionnaire Surveys Advantage Covers a large geographical area than telephones (?) and personal interviews since they are less expensive to conduct Respondents can remain anonymous Disadvantage Low response rates Inappropriate answers to questions Some people may not be able to read or understand the questions
  • 17.
    Data Collection: Three Methods of Surveys Personal Interview Surveys Advantage Obtain in-depth responses to questions from the respondents Disadvantage The interviewer needs to be trained The interviewer may lead the respondent to the desired answer
  • 18.
    Other Methods ofData Collection Surveying records Direct Observation
  • 19.
    Why Use aSample? Saves time and money The population is often too large to observe/interview
  • 20.
    Five Basic Methodsof Sampling A random sample is selected by using chance methods or random numbers. We can use computers and calculators to generate random numbers. A systematic sample is obtained by numbering each subject of the population and then selecting every k th subject.
  • 21.
    Five Basic Methodsof Sampling A stratified sample is obtained by dividing the population into groups (called strata) according to some characteristic, then sampling from each group. A cluster sample is obtained by using intact groups called clusters. A convenience sample is obtained by using subjects that are readily available.
  • 22.
    Example: Sampling MethodsFor the following scenarios, determine which sampling technique was used. Also list any biases that may be present. Average weight of newborn baby boys: Twelve hospitals are selected at random, and the weight of each baby boy born in January is recorded. Percentage of 18 – 25 year-olds who used drugs during the past 30 days: At a shopping mall, people who appear to be in the proper age group are stopped and asked for their age and whether they have used drugs in the past 30 days.
  • 23.
    Example: Sampling MethodsAverage length (in days) of a sexual harassment trial: The records of a law firm are analyzed, and the lengths of all of their sexual harassment trials are recorded. Effectiveness of a pain reliever against migraine headaches: Patients who have a history of migraines are divided into three groups, using random numbers. The three groups are given a placebo, a half-dose and a full-dose of the medication. The patients are then asked to rate the effectiveness of the medication on a scale of 1 to 10.
  • 24.
    Types of StatisticalStudies In an observational study , the researcher merely observes what is happening or what has happened in the past and tries to draw conclusions based on these observations. Advantages Occurs in a natural setting Can be done in situations where it would be unethical to conduct an experiment (Tuskegee experiment) Can be done using variables that cannot be manipulated (gender, dominant hand, race)
  • 25.
    Types of StatisticalStudies Observational Study Disadvantages Can’t establish cause and effect since the variables are not controlled. Can be expensive and time consuming Researcher may have to rely on measurements collected or reported by others People forget and fudge the truth
  • 26.
    Types of StatisticalStudies In an experimental study the researcher manipulates one of the variables and tries to determine how the manipulation influences other variables. The independent variable (explanatory variable) in the experimental study is the one that is being manipulated. The dependent variable is called the outcome variable. It is the variable that is studied to see if it has changed significantly due to the manipulation of the independent variable.
  • 27.
    Types of StatisticalStudies Experimental Study The treatment group receives a special “treatment” while the control group does not. Advantages Researcher can decide how to select subjects and how to assign them to groups The researcher controls the independent variable Disadvantages Occurs in an unnatural setting (disposable baby bottles) Hawthorne effect – subject behavior changes because they know that they are being observed.
  • 28.
    Types of StatisticalStudies A case-control study is an observational study that resembles an experiment because the sample naturally divides into two (or more) groups. The participants who engage in the behavior under study form the cases, like a treatment group in an experiment. The participants who do not engage in the behavior are the controls, like a control group in the experiment
  • 29.
    Example: Types of Statistical Studies For the following questions, what type of statistical study (observational study or experiment) is most likely to lead to an answer? Why? If an an observational study, state whether it should be a case control study. If an experiment, state whether it should be single- or double-blind. What is the mean income of stock brokers?   
  • 30.
    Example: Types of Statistical Studies Do seatbelts save lives?    Can lifting weights improve runners’ times in a 10-kilometer (10K) race? Does skin contact with a particular glue cause a rash?    Can a new herbal remedy reduce the severity of colds?   
  • 31.
    Uses and Misusesof Statistics Some people use statistics like a drunken man uses a lamp post – for support rather than illumination.
  • 32.
    Seventy-two percent ofAmericans squeeze the toothpaste tube from the top. This and other not-so-serious findings are presented in The First Really Important Survey of American Habits. Those results are based on 7000 respondents from the 25,000 questionnaires that were mailed. What is wrong with this survey?
  • 33.
    The New EnglandChronicles reports that women who eat lobster on a regular basis during their pregnancy tend to have healthier babies. A report sponsored by the Florida Citrus Commission concluded that cholesterol levels could be lowered by eating citrus products. Why might the conclusion be suspect?
  • 34.
    Glamour magazinepublished this survey result: "Seventy-nine percent of those who responded to our August survey say that they believe America has become too lawsuit-happy." The survey question was published in the magazine and readers could respond by mail, fax, or e-mail (Tellus@Galamour. com). How valid is the 79% result?
  • 35.
    In a studyon college campus crimes committed by students high on alcohol or drugs, a mail survey of 1875 students was conducted. A USA Today article noted, "Eight percent of the students responding anonymously say they've committed a campus crime. And 62% of that group say they did so under the influence of alcohol or drugs." Assuming that the number of students responding anonymously is 1875, how many actually committed a campus crime while under the influence of alcohol or drugs?