Downloaded 18 times


![STATISTICAL ANALYSISA paired T test was doneChange in ICP during response checking was highly significant [p<0.001]Change in ICP during suctioning was also very highly significant [p<0.001]](https://image.slidesharecdn.com/changesinicpfollowingresponsecheckinginicu-100523083912-phpapp01/85/Changes-in-icp-following-response-checking-in-icu-18-320.jpg)


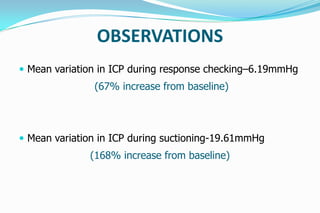
This study examined changes in intracranial pressure (ICP) during response checking and endotracheal suctioning in neurosurgical intensive care unit patients. The study found that both activities resulted in significant increases in ICP compared to baseline levels, with suctioning causing a greater rise and taking longer to return to baseline than response checking. Specifically, response checking increased ICP by an average of 6.19 mmHg and took 9.76 seconds to return to baseline, while suctioning increased ICP by 19.61 mmHg and took 26.56 seconds to return to baseline on average. The study concludes that suctioning in particular poses risks of dangerous ICP elevation that could be mitigated with additional


