Downloaded 22 times

![TABLE OF CONTENTS
I. The Left Ventricle 3
1. Measurement of LV
Size 3
1.1. Linear Measure-
ments 3
1.2. Volumetric Measure-
ments 3
1.3. Normal Reference
Values for 2DE 6
1.4. Normal Reference
Values for 3DE 6
Recommendation 6
2. LV Global Systolic Func-
tion 6
2.1. Fractional Short-
ening 6
2.2. EF 7
2.3. Global Longitudinal
Strain (GLS) 7
2.4. Normal Reference
Values 7
Recommendations 10
3. LV Regional Func-
tion 10
3.1. Segmentation of the
Left Ventricle 10
3.2. Visual Assess-
ment 11
3.3. Regional Wall Motion
during Infarction and
Ischemia 11
3.4. Regional Abnormalities
in the Absence of Cor-
onary Artery Dis-
ease 11
3.5. Quantification of
Regional Wall Motion
Using Doppler and
STE 11
Recommendations 12
4. LV Mass 13
Recommendations 16
II. The Right Ventricle 16
5. General Recommenda-
tions for RV Quantifica-
tion 16
6. Essential Imaging Win-
dows and Views 16
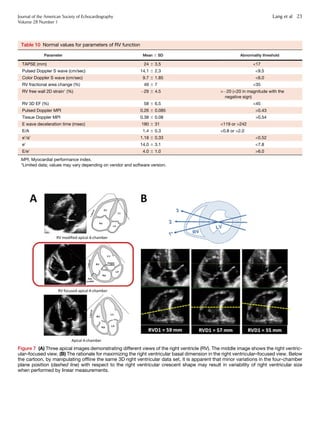
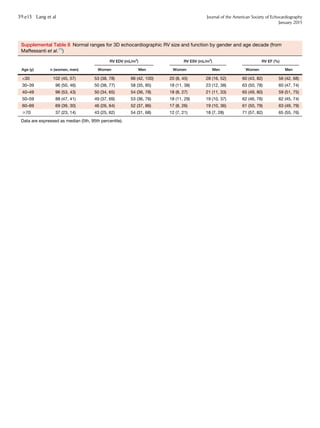
7. RV Measurements 17
7.1. Linear Measure-
ments 17
7.2. Volumetric Measure-
ments 17
Recommendations 17
8. RV Systolic Func-
tion 19
8.1. RIMP 19
8.2. TAPSE 19
8.3. RV 2D FAC 19
8.4. DTI-Derived Tricuspid
Lateral Annular Systolic
Velocity 20
8.5. RV Strain and Strain Rate 20
Recommendations 20
8.6. RV 3D EF 20
Recommendation 20
III. The Left and Right Atria 20
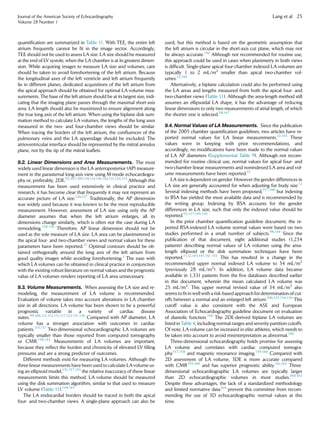
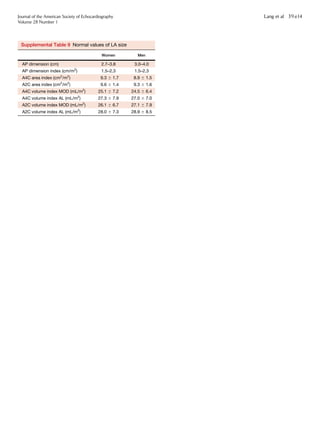
9. LA Measurements 24
9.1. General Considerations for LA Size 24
9.2. Linear Dimensions and Area Measurements 25
9.3. Volume Measurements 25
9.4. Normal Values of LA Measurements 25
Recommendations 28
10. Right Atrial measurements 28
Recommendations 28
IV. The Aortic Annulus and Aortic Root 28
11. The Aortic Annulus 28
12. The Aortic Root 30
13. Identification of Aortic Root Dilatation 32
Recommendations 32
V. The Inferior Vena Cava 32
Notice and Disclaimer 33
References 33
Appendix 39.e1
Methods 39.e1
Echocardiographic Measurements 39.e1
Statistical Analysis 39.e1
The quantification of cardiac chamber size and function is the corner-
stone of cardiac imaging, with echocardiography being the most
commonly used noninvasive modality because of its unique ability
to provide real-time images of the beating heart, combined with its
availability and portability. Standardization of the methodology
used to quantify cardiac chambers is maintained by creating and
disseminating official recommendations, which when followed by
practitioners provides uniformity and facilitates communication.
Recommendations for echocardiographic chamber quantification
were last published in 2005 by the American Society of
Echocardiography (ASE) and the European Association of
Echocardiography (renamed the European Association of
Cardiovascular Imaging [EACVI]).1,2
Since then, echocardiographic technology has continued
evolving, with two major developments being real-time three-
dimensional (3D) echocardiography (3DE) and myocardial defor-
mation imaging. The goal of this document is to provide an update
to the previously published guidelines, as well as recommendations
and reference values, while eliminating the minor discrepancies that
existed between previous guidelines. The normal values in this up-
date include 3DE and myocardial deformation, when possible.
Importantly, compared with the previous guidelines, this update is
based on considerably larger numbers of normal subjects, compiled
from multiple databases, to improve the reliability of the reference
values.
Although most issues covered in this document reflect a broad
consensus among the members of the writing group, one important
issue the group debated was partition values for severity of abnormal-
ities. Most often, in addition to describing a parameter as normal or
abnormal (reference values), clinical echocardiographers qualify the
degree of abnormality with terms such as mildly, moderately, and
Abbreviations
AP = Anteroposterior
ASE = American Society of
Echocardiography
BSA = Body surface area
CMR = Cardiac magnetic
resonance
DTI = Doppler tissue imaging
EACVI = European
Association of Cardiovascular
Imaging
EDV = End-diastolic volume
EF = Ejection fraction
ESV = End-systolic volume
FAC = Fractional area change
GLS = Global longitudinal
strain
I-I = Inner edge–to–inner edge
IVC = Inferior vena cava
LA = Left atrial
L-L = Leading edge–to–
leading edge
LV = Left ventricular
MDCT = Multidetector
computed tomography
PW = Pulsed-wave
RA = Right atrial
RIMP = Right ventricular index
of myocardial performance
RV = Right ventricular
RWT = Relative wall thickness
STE = Speckle-tracking
echocardiography
TAPSE = Tricuspid annular
plane systolic excursion
TAVI = Transcatheter aortic
valve implantation
TAVR = Transcatheter aortic
valve replacement
TEE = Transesophageal
echocardiography
3D = Three-dimensional
3DE = Three-dimensional
echocardiography
TTE = Transthoracic
echocardiography
2D = Two-dimensional
2DE = Two-dimensional
echocardiography
2 Lang et al Journal of the American Society of Echocardiography
January 2015](https://image.slidesharecdn.com/chamberquantification2015-160402104403/85/Chamber-Quantification-2015-2-320.jpg)
![severely abnormal, which reflect the degree to which measurements
deviate from normal. In addition to providing normative data, it
would be beneficial to standardize cutoffs for severity of abnormality
for all parameters across echocardiography laboratories, such that the
term moderately abnormal, for example, would have the same mean-
ing universally. However, different approaches may be used for deter-
mining cutoff values for the different degrees of abnormality, all of
which have significant limitations.
The first approach would be to empirically define cutoffs for
mild, moderate, and severe abnormalities on the basis of SDs above
or below the reference limit derived from a group of healthy people.
The advantage of this method is that these data readily exist for
most echocardiographic parameters. However, this approach is
fundamentally flawed. First, not all echocardiographic parameters
are normally distributed (or Gaussian), even in a normal population.
Second, even if a particular parameter is normally distributed in
normal subjects, most echocardiographic parameters, when
measured in the general population, have a significant asymmetric
distribution in one direction (abnormally large for size or abnormally
low for function parameters). An alternative method would be to
define abnormalities on the basis of percentile values (e.g., 95th,
99th) of measurements derived from a population that includes
both healthy people and those with disease. Although these data
would still not be normally distributed, they would account for
the asymmetric distribution and the range of abnormality present
within the general population. The major limitation of this approach
is that such population data sets simply do not exist for most echo-
cardiographic variables.
Ideally, an approach that predicts outcomes or prognosis would be
preferred. That is, defining a variable as moderately deviated from
normal would imply that there is a moderate risk for a particular
adverse outcome for a patient. Although sufficient data linking risk
and cardiac chamber sizes exist for several parameters (e.g., left ven-
tricular [LV] size and ejection fraction [EF], left atrial [LA] volume),
outcomes data are lacking for many other parameters.
Unfortunately, this approach also has limitations. The first obstacle
is how to best define risk. The cutoffs suggested for the same param-
eter vary broadly for different risks in different patient populations
and disease states.
Last, cutoff values may be determined by experience-based
consensus of expert opinions. An extensive debate arose among
the members of the writing group, some of whom felt that
providing partition values on the basis of this scientifically less-
than-rigorous approach would be a disservice to the echocardiog-
raphy community and that a disease-specific approach might be
required to achieve meaningful clinical categorization of the
severity of abnormality. Others felt that such cutoffs would pro-
vide a uniform reference for echocardiographic reporting, which
would be easier to interpret by referring clinicians. The compro-
mise was to provide experience-based partition values only for
LV EF and LA volume, while suggested partition values for addi-
tional parameters of LV size and mass are listed in the
Appendix. All partition values should interpreted with caution
in this perspective.
For parameters other than LV size, function, and mass as well as
LA volume, only the mean value and the SD of gender-, age-, and
body surface area (BSA)–normalized cutoffs or upper and lower
limits are reported in the appropriate sections of this document.
For these parameters, measurements exceeding 61.96 SDs (i.e.,
the 95% confidence interval) should be classified as abnormal.
Any description of the degree of deviation from normality in the
echocardiographic report should remain at the discretion of the in-
dividual laboratory, and the writing group does not recommend spe-
cific partition values.
Quantification using transesophageal echocardiography (TEE)
has advantages and disadvantages compared with transthoracic
echocardiography (TTE). Although visualization of many cardiac
structures is improved with TEE, some differences in measure-
ments have been found between TEE and TTE, particularly for
chamber dimensions and thickness. These differences are primarily
attributable to the inability to obtain from the transesophageal
approach the standardized imaging planes and views used when
quantifying chamber dimensions transthoracically. It is the recom-
mendation of this writing group that the same range of normal
values for LV and right ventricular (RV) chamber dimensions and
volumes apply for both TEE and TTE. For details on specific views
for optimal measurements, please refer to the recently published
TEE guidelines.3
All measurements described in this document should be per-
formed on more than one cardiac cycle to account for interbeat
variability. The committee suggests the average of three beats for
patients in normal sinus rhythm and a minimum of five beats in
patients with atrial fibrillation. Because the committee acknowl-
edges that the implementation of this recommendation is time
consuming, the use of representative beats is acceptable in the clin-
ical setting.
I. THE LEFT VENTRICLE
1. Measurement of LV Size
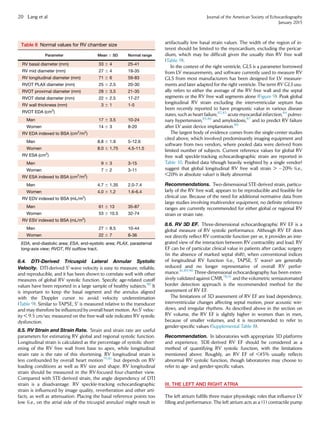
The most commonly used parameters to describe LV cavity size
include linear internal dimensions and volumes. Measurements are
commonly reported for end-diastole and end-systole, which are
then used to derive parameters of global LV function. To allow com-
parison among individuals with different body sizes, chamber mea-
surements should be reported indexed to BSA.
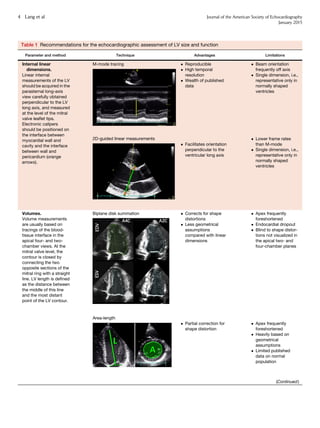
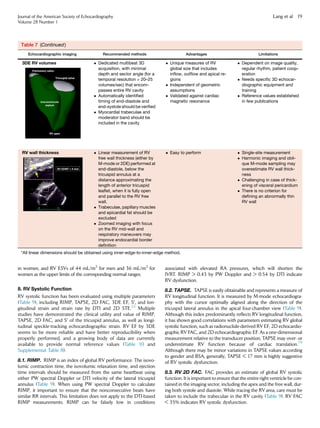
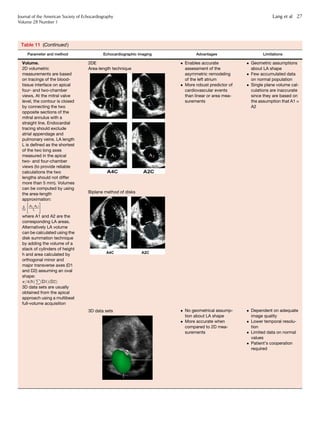
1.1. Linear Measurements. It is recommended that linear internal
measurements of the left ventricle and its walls be performed in the
parasternal long-axis view. Values should be carefully obtained
perpendicular to the LV long axis and measured at or immediately
below the level of the mitral valve leaflet tips. In this regard, the elec-
tronic calipers should be positioned on the interface between the
myocardial wall and cavity and the interface between the wall and
the pericardium. Internal dimensions can be obtained with a two-
dimensional (2D) echocardiography (2DE)–guided M-mode
approach, although linear measurements obtained from 2D echocar-
diographic images are preferred to avoid oblique sections of the
ventricle (Table 1).
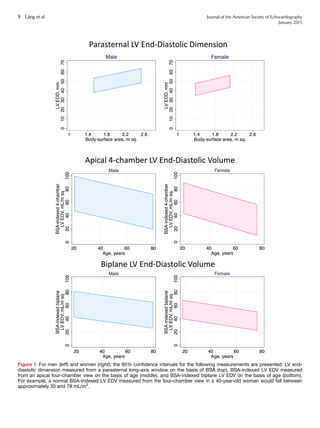
1.2. Volumetric Measurements. LV volumes are measured using
2DE or 3DE. Volume calculations derived from linear measurements
may be inaccurate, because they rely on the assumption of a fixed
geometric LV shape such as a prolate ellipsoid, which does not apply
in a variety of cardiac pathologies. Accordingly, the Teichholz and
Quinones methods for calculating LV volumes from LV linear dimen-
sions are no longer recommended for clinical use.
Volumetric measurements are usually based on tracings of the
interface between the compacted myocardium and the LV cavity.
Journal of the American Society of Echocardiography
Volume 28 Number 1
Lang et al 3](https://image.slidesharecdn.com/chamberquantification2015-160402104403/85/Chamber-Quantification-2015-3-320.jpg)
![view in midsystole (Figure 11). It should be noted that the difference
between major and minor diameters may be up to 6 mm.173,188-193
For a detailed, step-by-step approach to making these measurements
using 3D TEE, which is beyond the scope of this document, the reader
is referred to four recent publications.184-187
By using these
techniques, close agreement with MDCT can be achieved.184,185
It should be noted that proponents of each of the two modalities
(3D TEE and MDCT) tout advantages. In fact, each of these
methods has certain strengths and limitations. Limitations of
MDCT include the need for contrast media, radiation exposure,
inability to obtain real-time measurements during the procedure,
and the need to control the heart rate for suitable gating. Three-
dimensional TEE also has limitations. First, the software required
to use the methodology described by Kasel et al.184
and Pershad
et al.185
is not currently available on all echocardiographic platforms.
Second, visualization of the anterior portion of the annulus can be
obscured by echo ‘‘dropout’’ due to annular calcification. In addition,
calcification at the level of the annulus may hinder the ability to
determine boundary definition and may make its shape irregular.
Third, the plane formed by the nadirs of the three cusps is often
not orthogonal to the LV outflow tract or aortic root; frequently
the insertion of the right coronary cusp is inferior to that of the
left and noncoronary cusps.183
Fourth, both the spatial and temporal
resolution of 3D echocardiography is currently limited. Last, this
technique is operator dependent and may be difficult at times,
even in experienced hands.173,174
Because of these potential
limitations, it is desirable to use a multimodality approach for
aortic annular measurement.
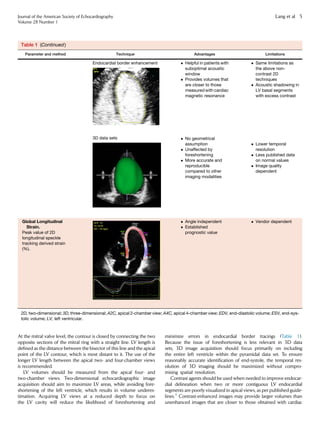
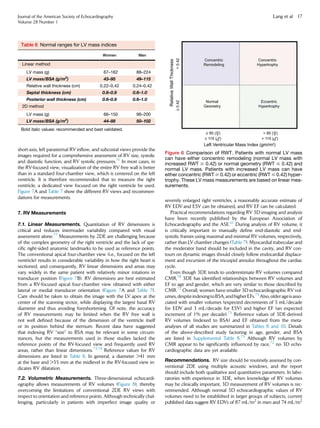
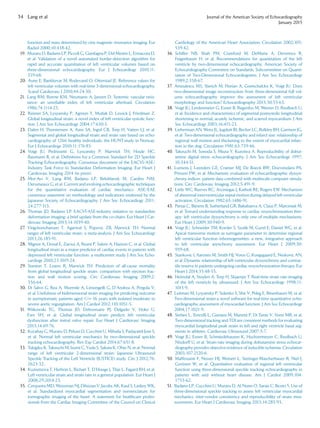
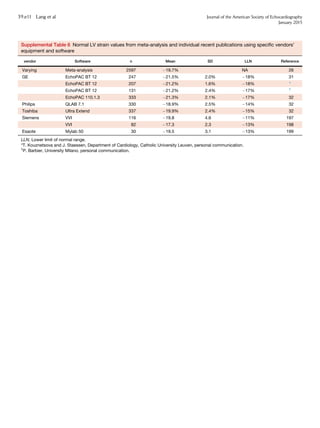
12. The Aortic Root
With 2D TTE, the diameter of the aortic root (at the maximal diam-
eter of the sinuses of Valsalva) should be obtained from the paraster-
nal long-axis view, which depicts the aortic root and the proximal
ascending aorta. This plane is slightly different from that of the long
axis of the left ventricle (Figure 10A). Acquisition of this LV long-
axis view may be performed from different intercostal spaces and
at various distances from the left sternal border. Use of simultaneous
biplane orthogonal images provided by matrix transducers may be
helpful. The tubular ascending aorta is often not adequately visualized
from a standard parasternal window. In these instances, moving the
transducer closer to the sternum may allow visualization of a longer
portion of the ascending aorta. In addition, the ascending aorta may
sometimes be well visualized from right parasternal windows in the
second or third intercostal space, especially when the aorta is dilated.
Measurements should be made in the view that depicts the
maximum aortic diameter perpendicular to the long axis of the aorta.
In patients with tricuspid aortic valves, the closure line of the leaflets
(typically the right coronary cusp and the noncoronary cusp) is in the
center of the aortic root lumen, and the closed leaflets are seen on the
aortic side of a line connecting the hinge points of the two visualized
leaflets. An asymmetric closure line, in which the tips of the closed
leaflets are closer to one of the hinge points, is an indication that
the cross-section is not encompassing the largest root diameter
(Figure 12).
Unfortunately, there is no uniform method of measurement of the
aortic root and aorta. Echocardiography uses the leading edge–to–
leading edge (L-L) convention, but other techniques, such as
MDCT and CMR, use the inner edge–to–inner edge (I-I) or outer
edge–to–outer edge convention. In the consensus document,194
the ASE and EACVI writing committee took the initiative to provide
a common standard for measurement of the aortic root and aorta by
recommending a switch to the I-I convention for echocardiography.
However, this goal of achieving uniformity among modalities was ul-
timately abandoned for several reasons. First, currently used long-
standing reference values for the aorta were obtained using the L-L
convention.195,196
Second, the L-L convention provides statistically
Table 13 Normal RA size obtained from 2D
echocardiographic studies
Women Men
RA minor axis dimension (cm/m2
) 1.9 6 0.3 1.9 6 0.3
RA major axis dimension (cm/m2
) 2.5 6 0.3 2.4 6 0.3
2D echocardiographic RA volume (mL/m2
) 21 6 6 25 6 7
Data are expressed as mean 6 SD.
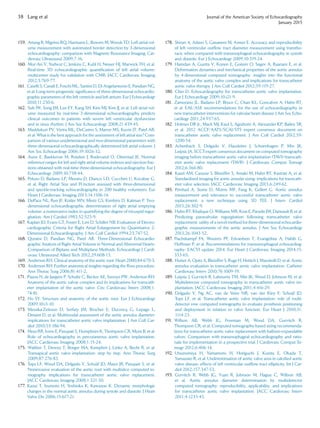
Figure 10 (A) Sites for measurements of the aortic root and
ascending aorta. This diagram illustrates the four sites at which
measurements are recommended (light blue arrows): (1) the aortic
valve annulus (hinge point of aortic leaflets), (2) the sinuses of
Valsalva (maximal diameter, usually the midpoint), (3) the sinotub-
ular junction, and (4) the proximal ascending aorta (the distance
between the measurement site and the annular plane [purple ar-
rowheads] should always be reported). The aortic annulus should
be measured at peak systole, in contrast to the other dimensions,
which are measured at end-diastole. The dashed lines, depicting
the longitudinal axis of the left ventricle (LV) and that of the aortic
root and proximal ascending aorta, are different. Note that the
angle between these two axes varies from individual to individual
and with age and pathology. (B) Normal anatomy of the aortic
annulus. The aortic annulus accounts for the tightest part of the
aortic root and is defined as a virtual ring (shaded) with three
anatomic anchor points at the nadir of each of the attachments
of the three aortic leaflets. Reproduced with permission from
Kasel et al.184
Ao, Aorta; LA, left atrium.
30 Lang et al Journal of the American Society of Echocardiography
January 2015](https://image.slidesharecdn.com/chamberquantification2015-160402104403/85/Chamber-Quantification-2015-30-320.jpg)
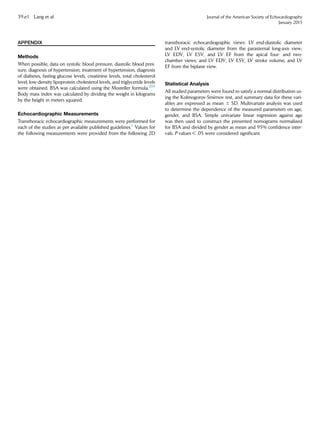
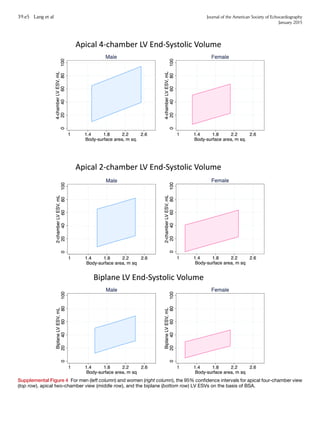
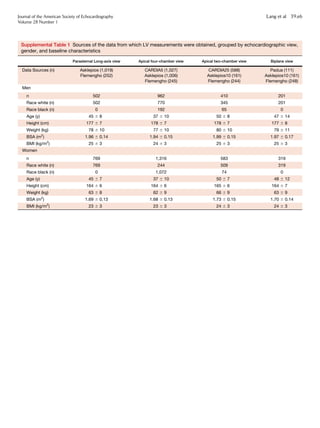
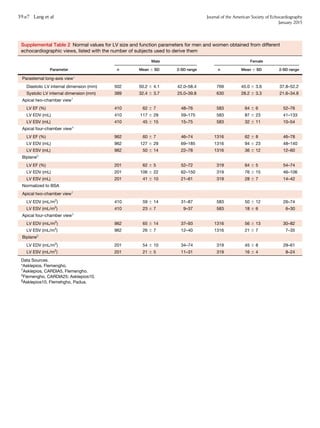

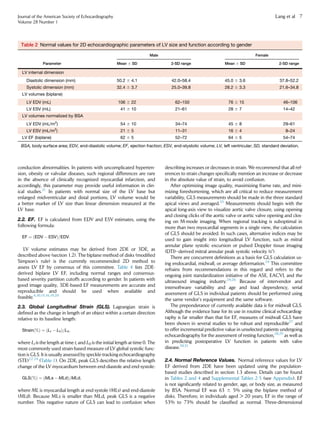
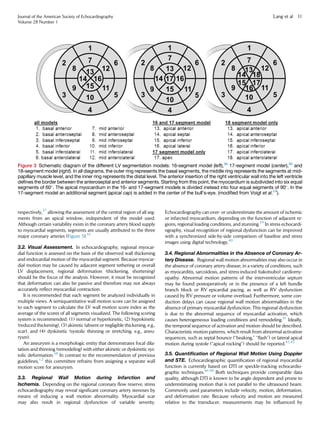
This document provides updated guidelines and reference values for cardiac chamber quantification by echocardiography. It summarizes recommendations for measuring and evaluating left ventricular size, function, mass and regional wall motion. Reference values are given for linear dimensions, volumes and ejection fraction of the left ventricle based on a large number of normal subjects. The document also summarizes guidelines for assessing right ventricular size and function, as well as the size and function of the left and right atria, aortic root dimensions, and inferior vena cava size. Partition values are only provided for left ventricular ejection fraction and left atrial volume due to limitations of existing data.


![CASE_PRESENTATION_ON_subdural_hematoma(SDH)[1 FINAL PPT]-1.pptx](https://cdn.slidesharecdn.com/ss_thumbnails/casepresentationonsubduralhematomasdh1finalppt-1-260129172522-d405d375-thumbnail.jpg?width=640&height=640&fit=bounds)


