The document discusses key concepts about population including:
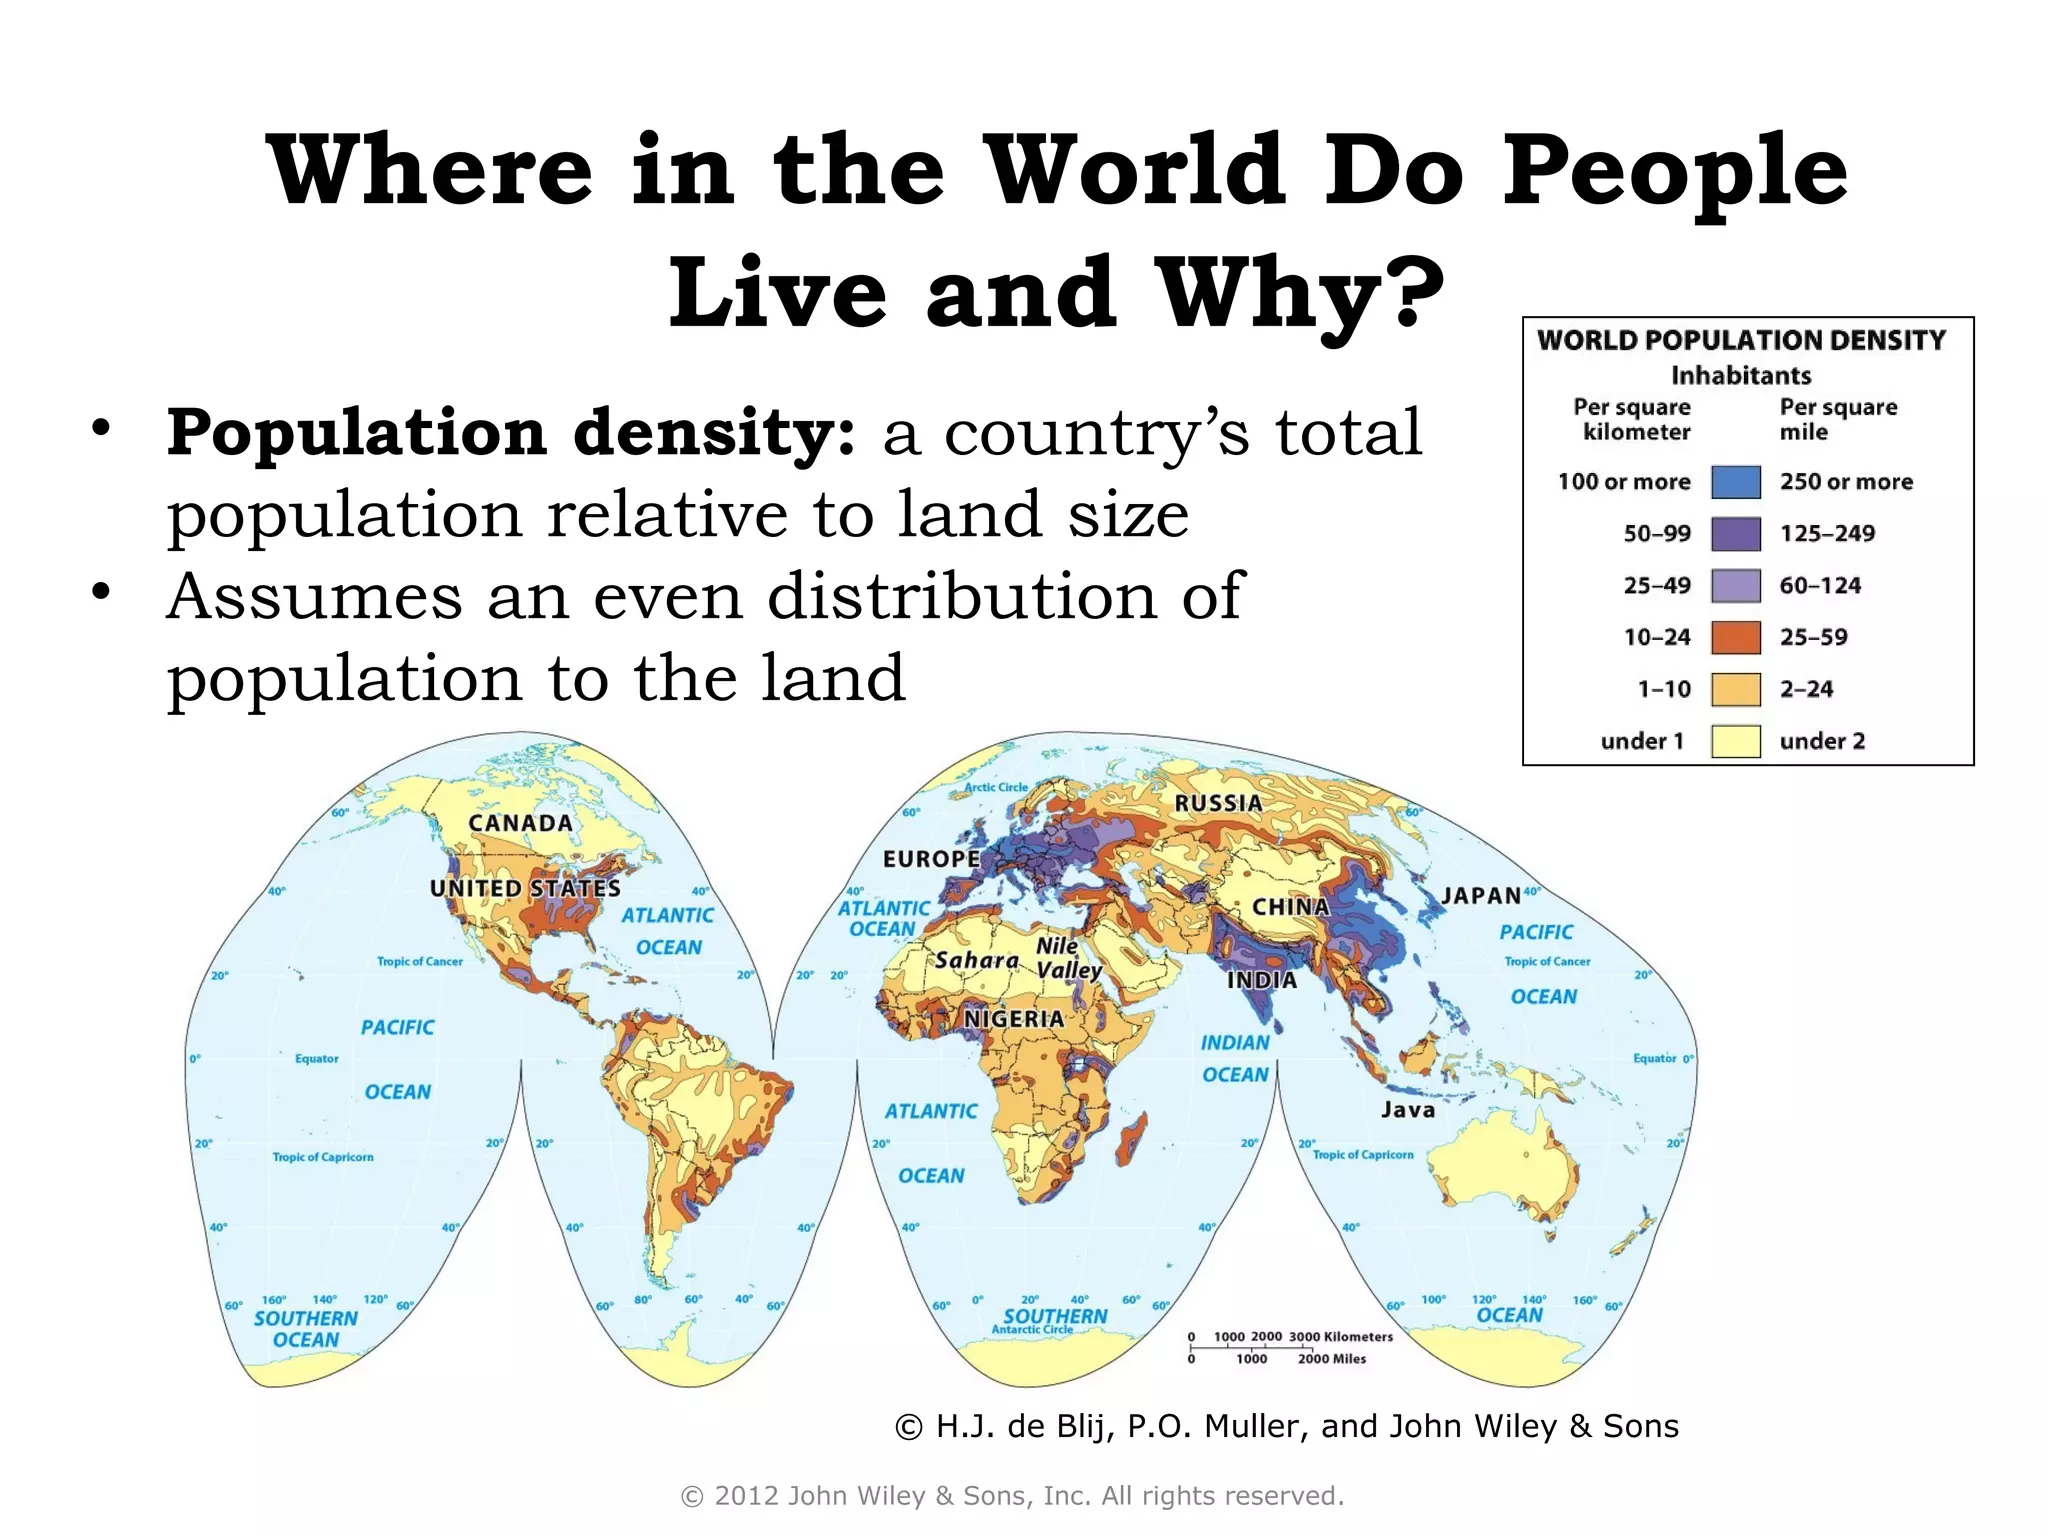
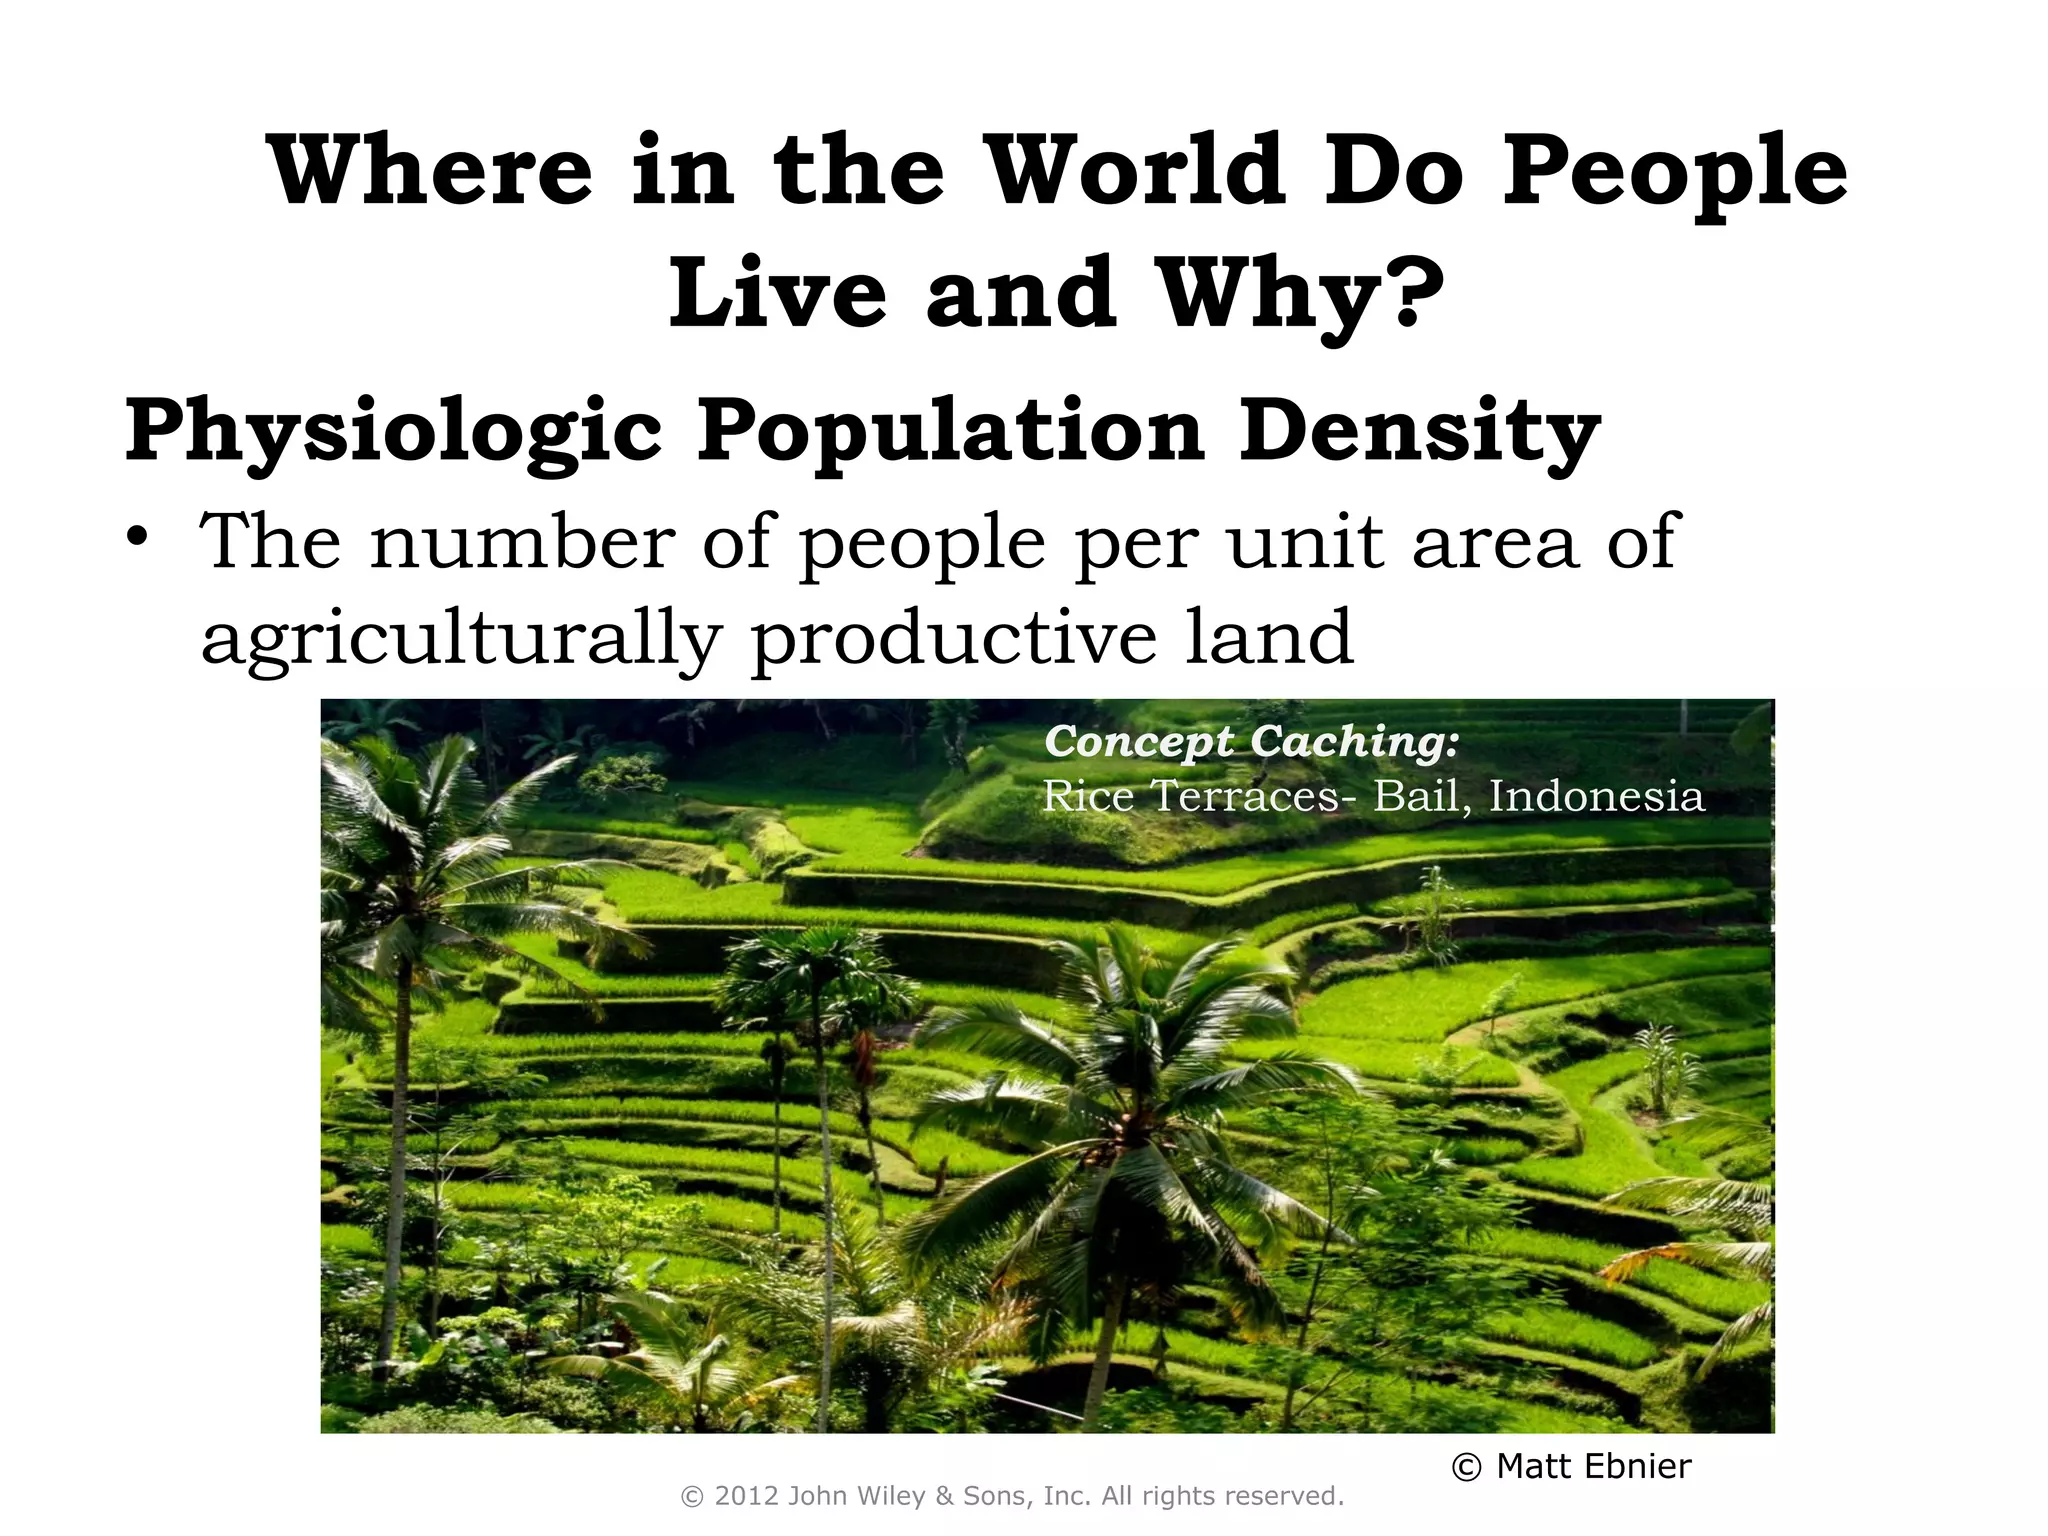
1) Population density measures the total population relative to land size and assumes an even distribution.
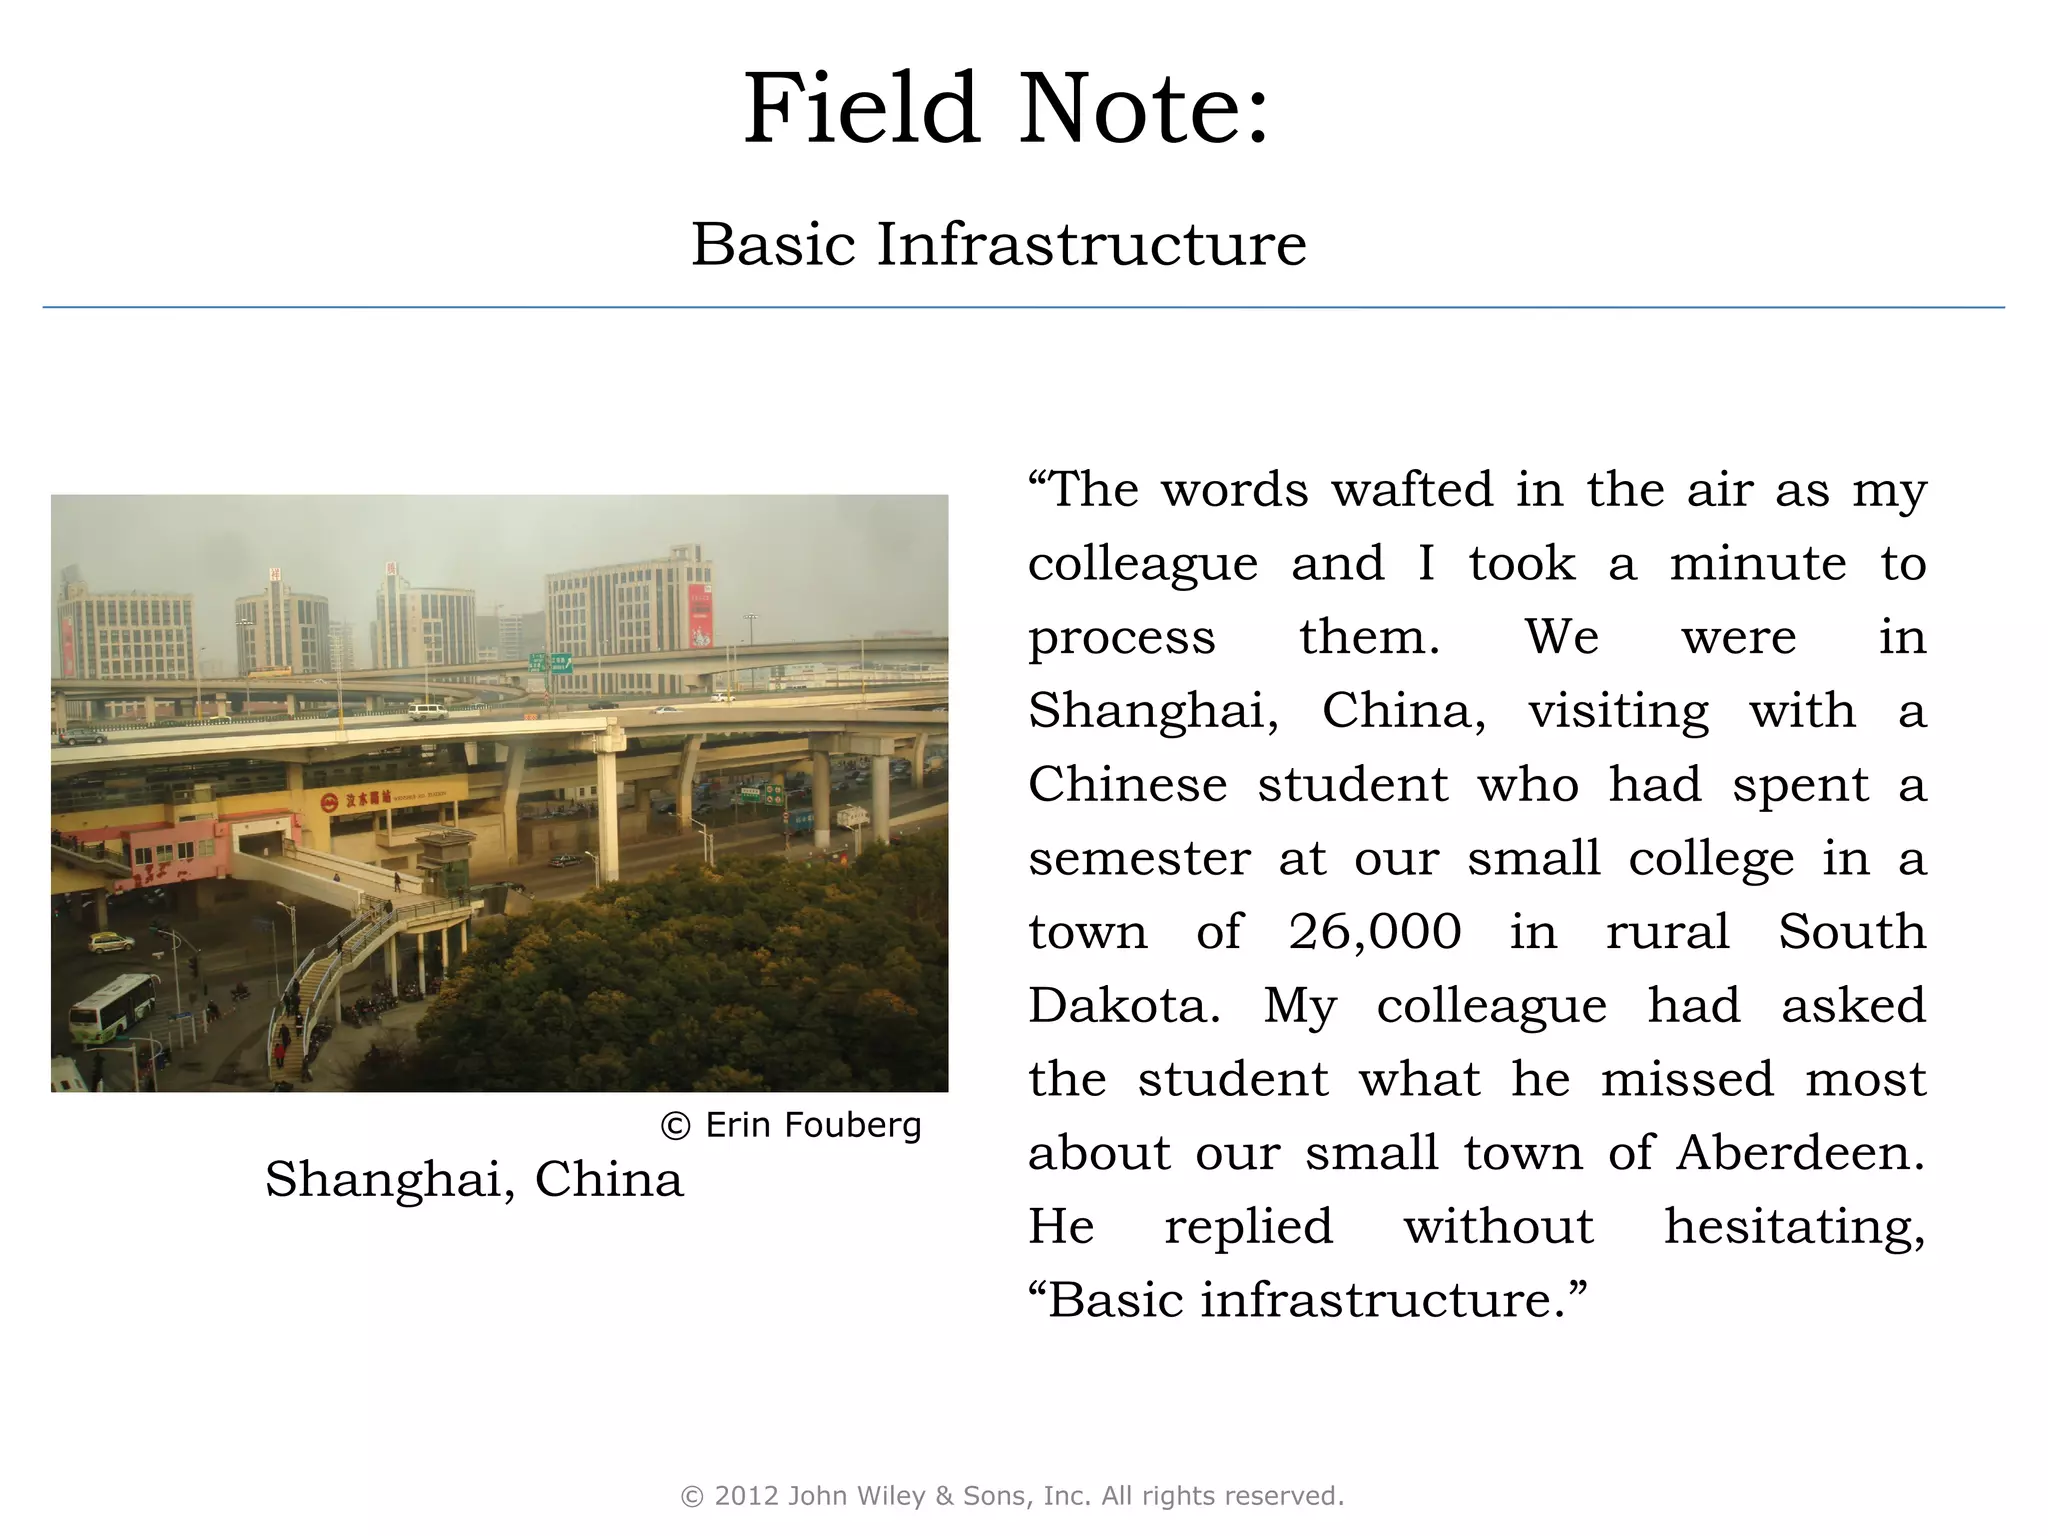
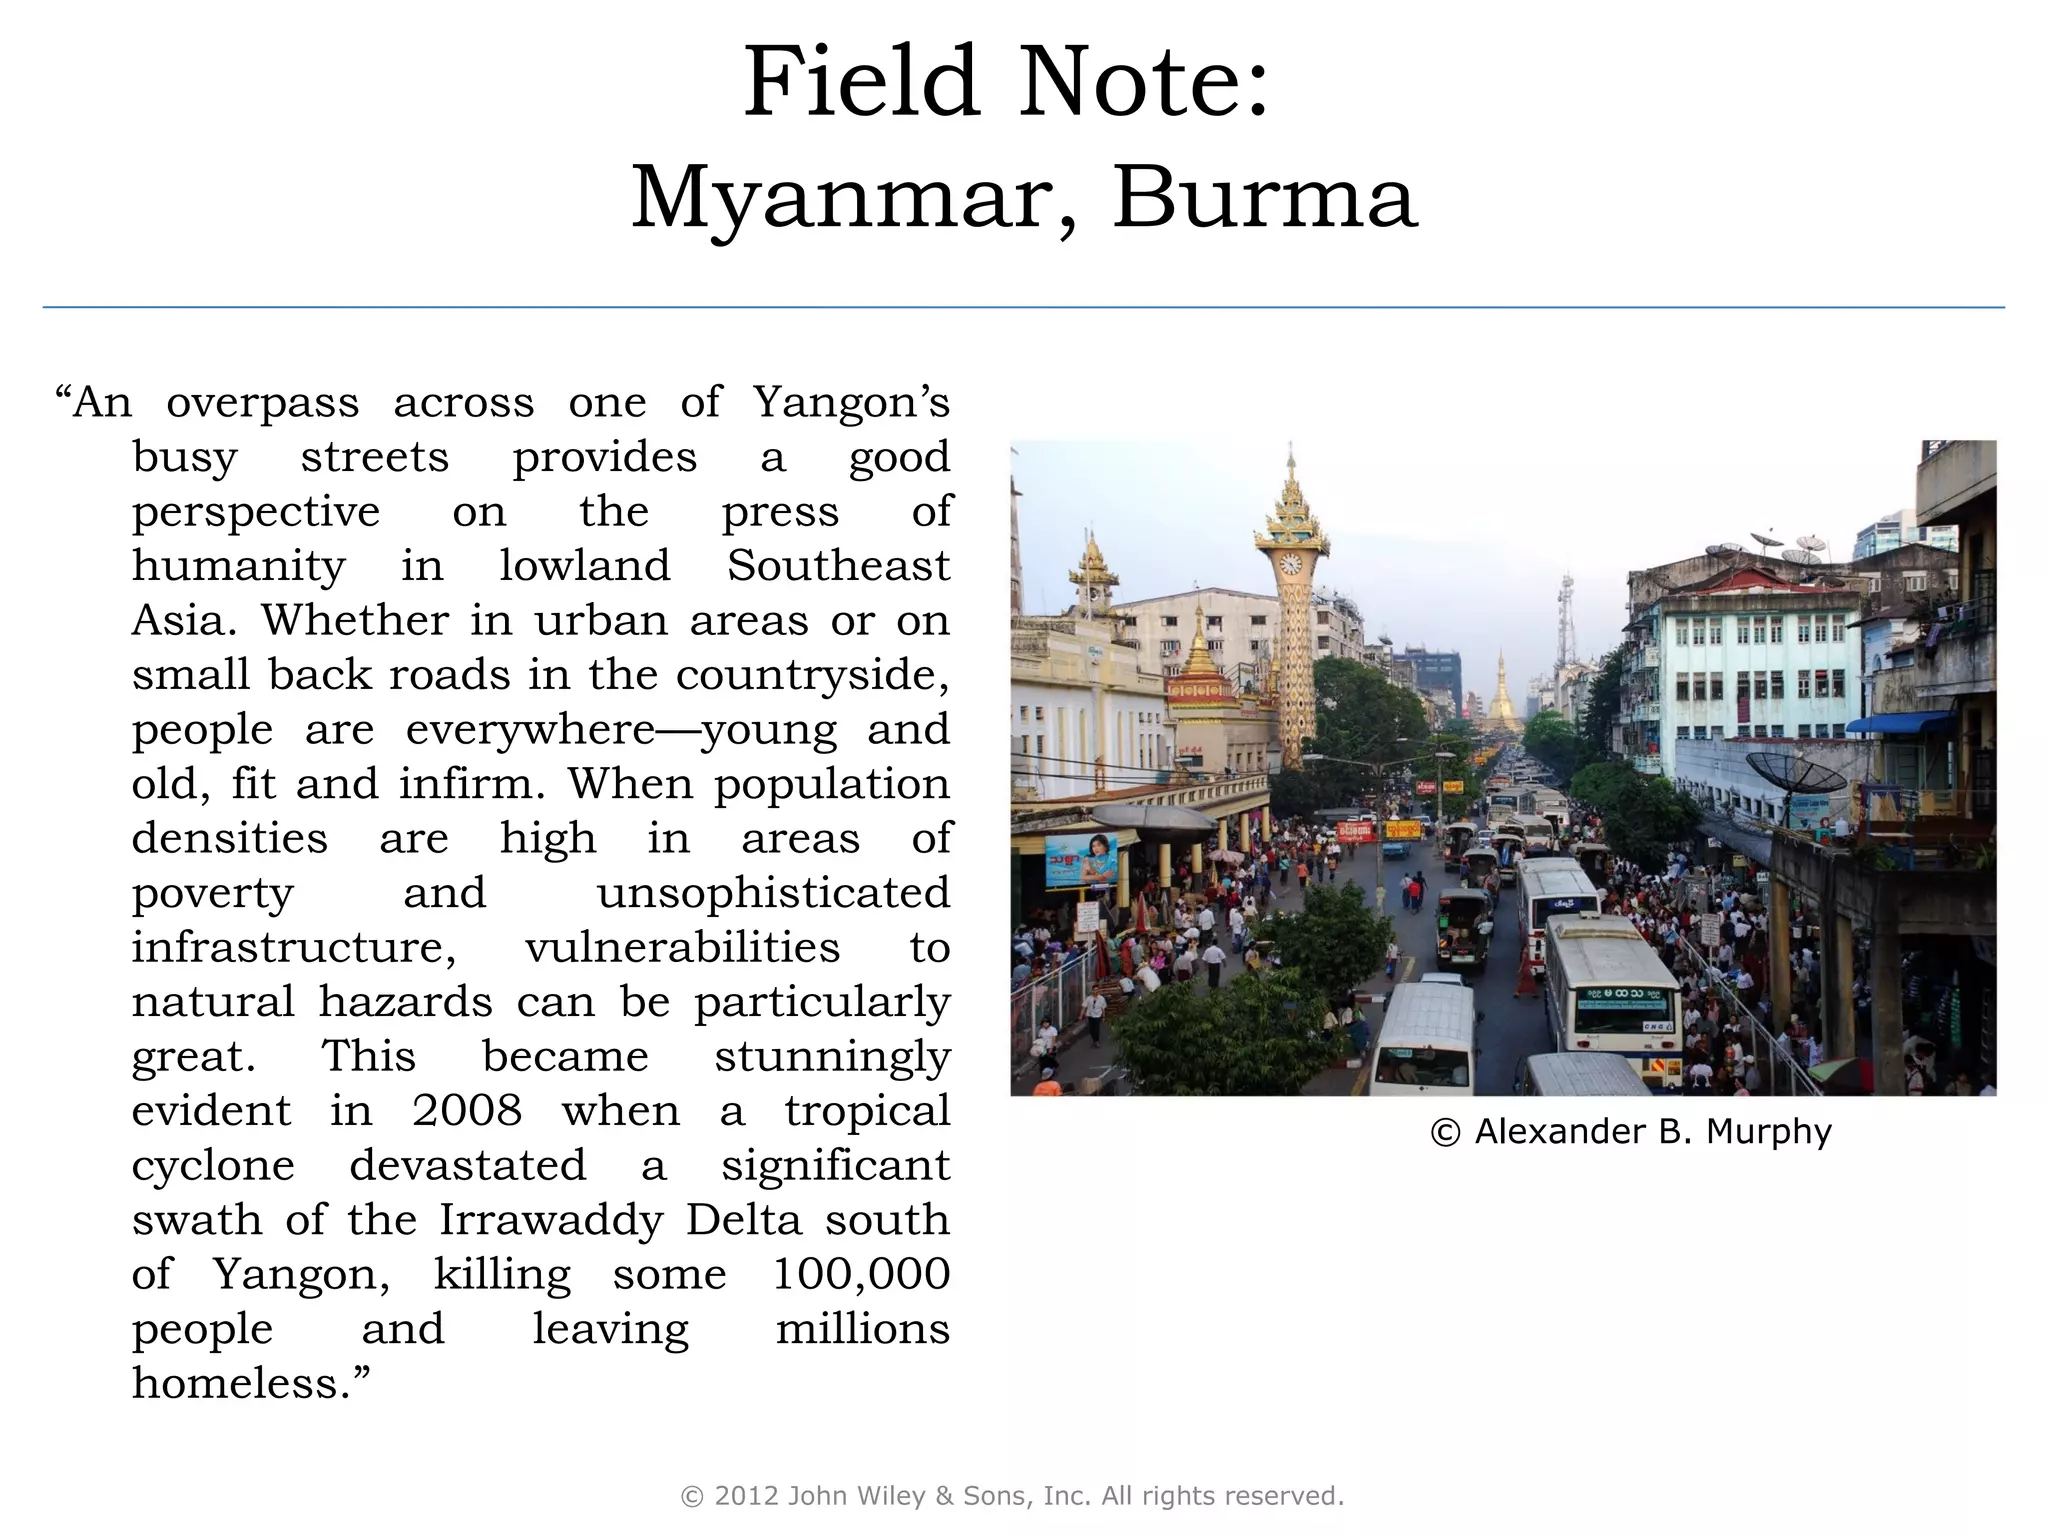
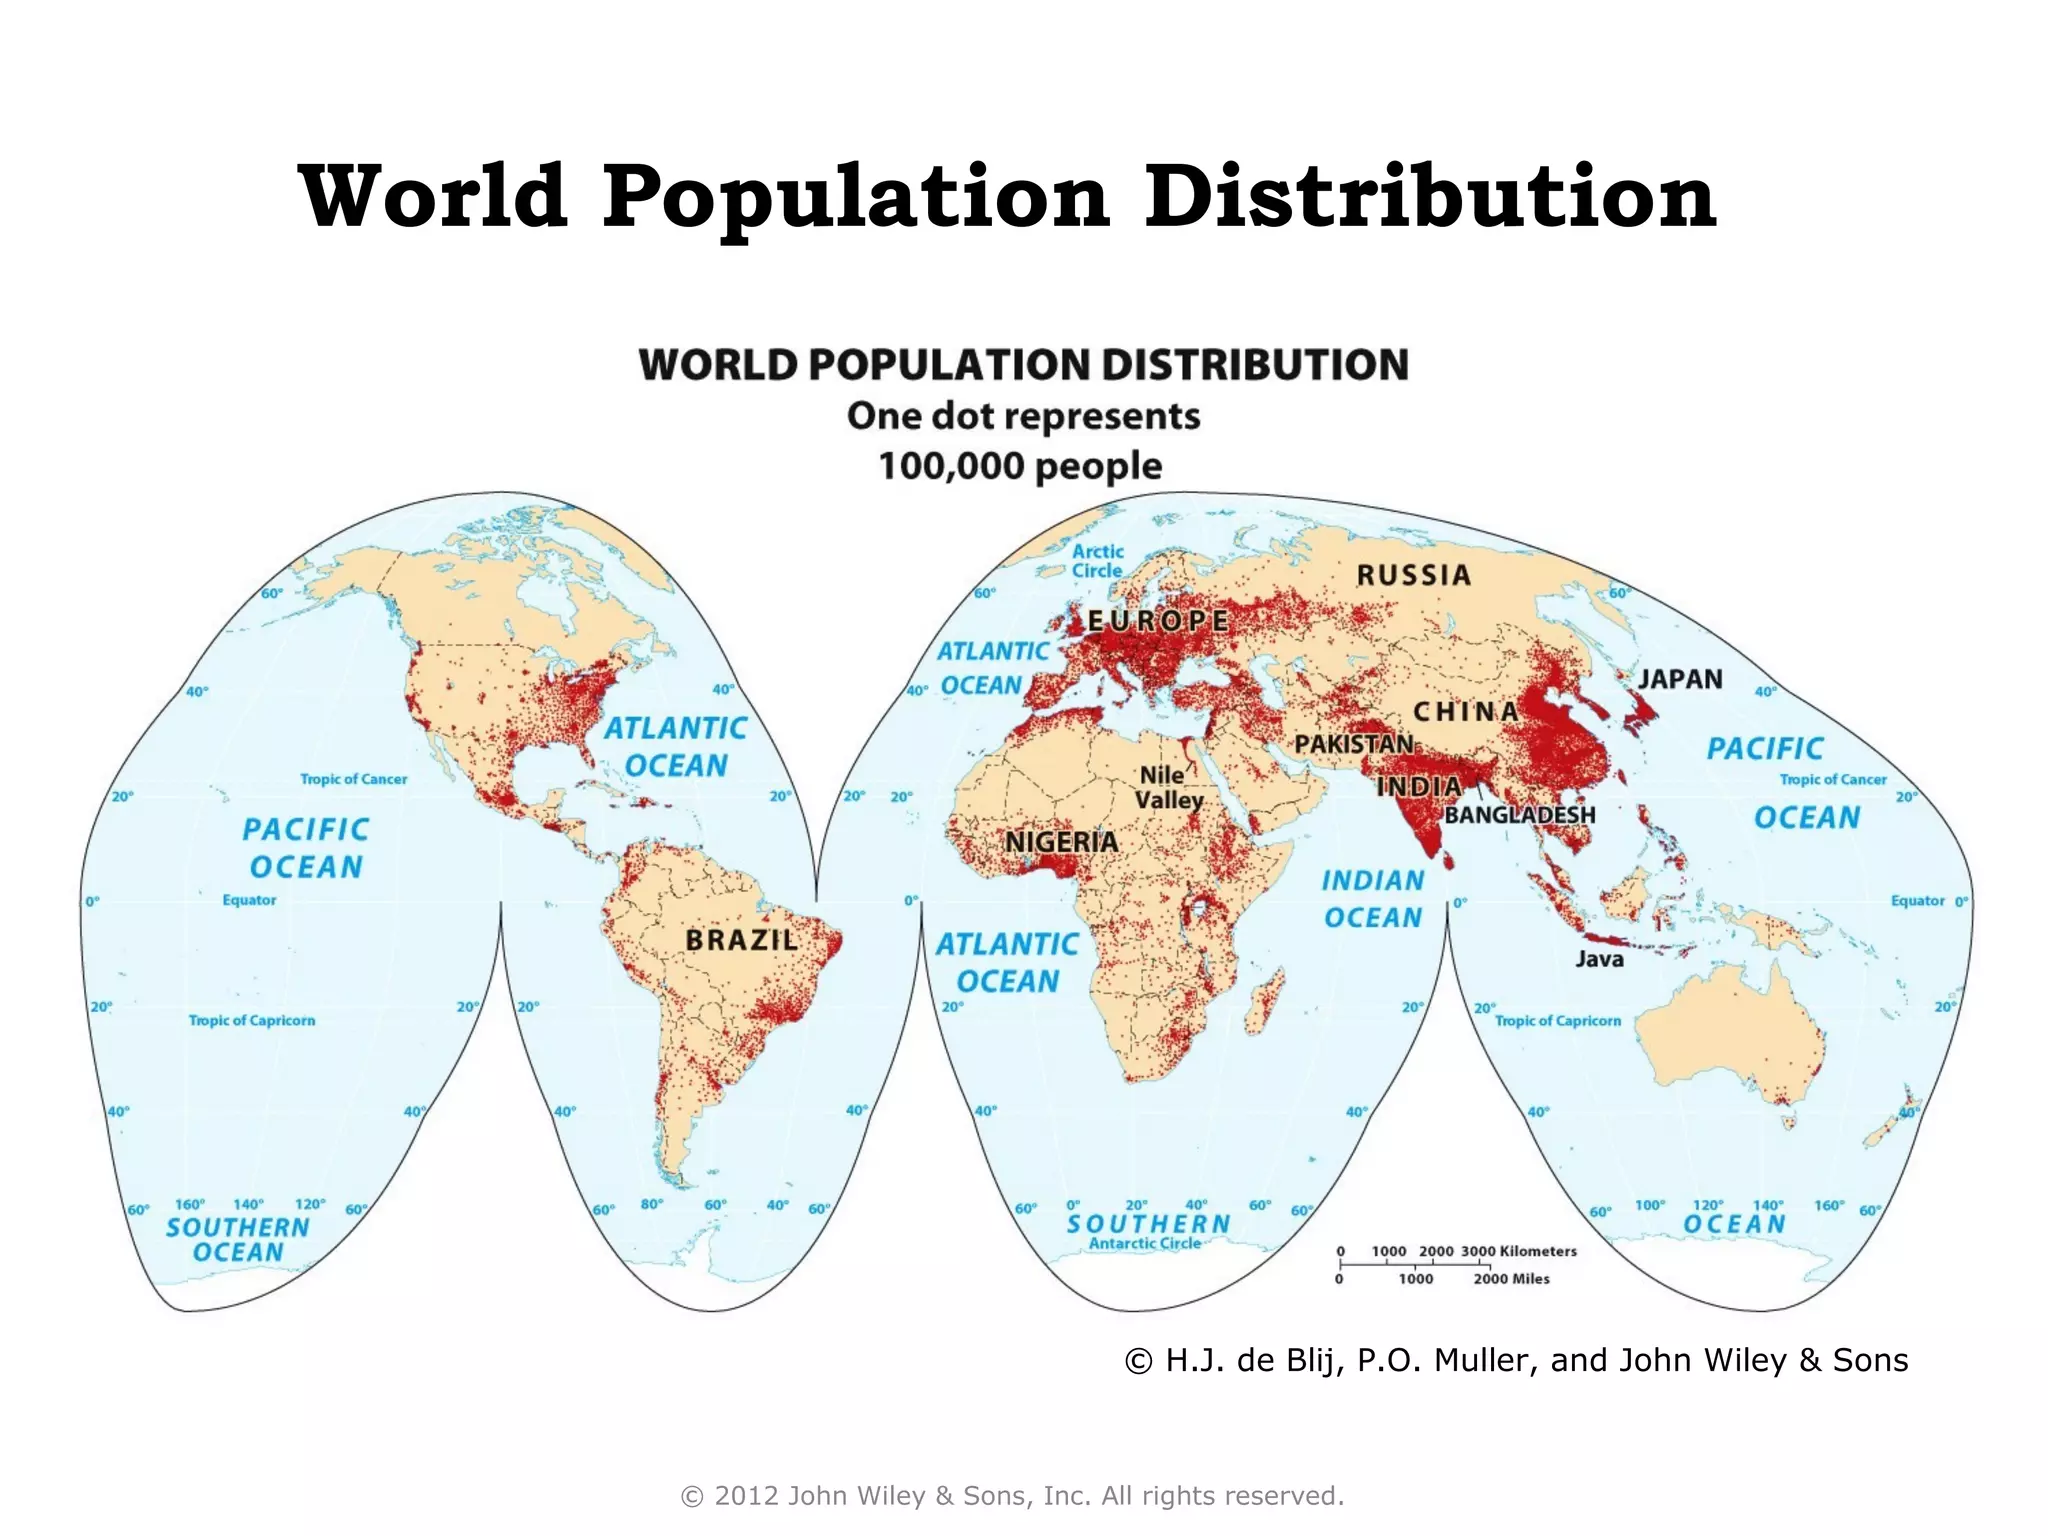
2) Population is concentrated in areas with good agricultural land and infrastructure like along river valleys.
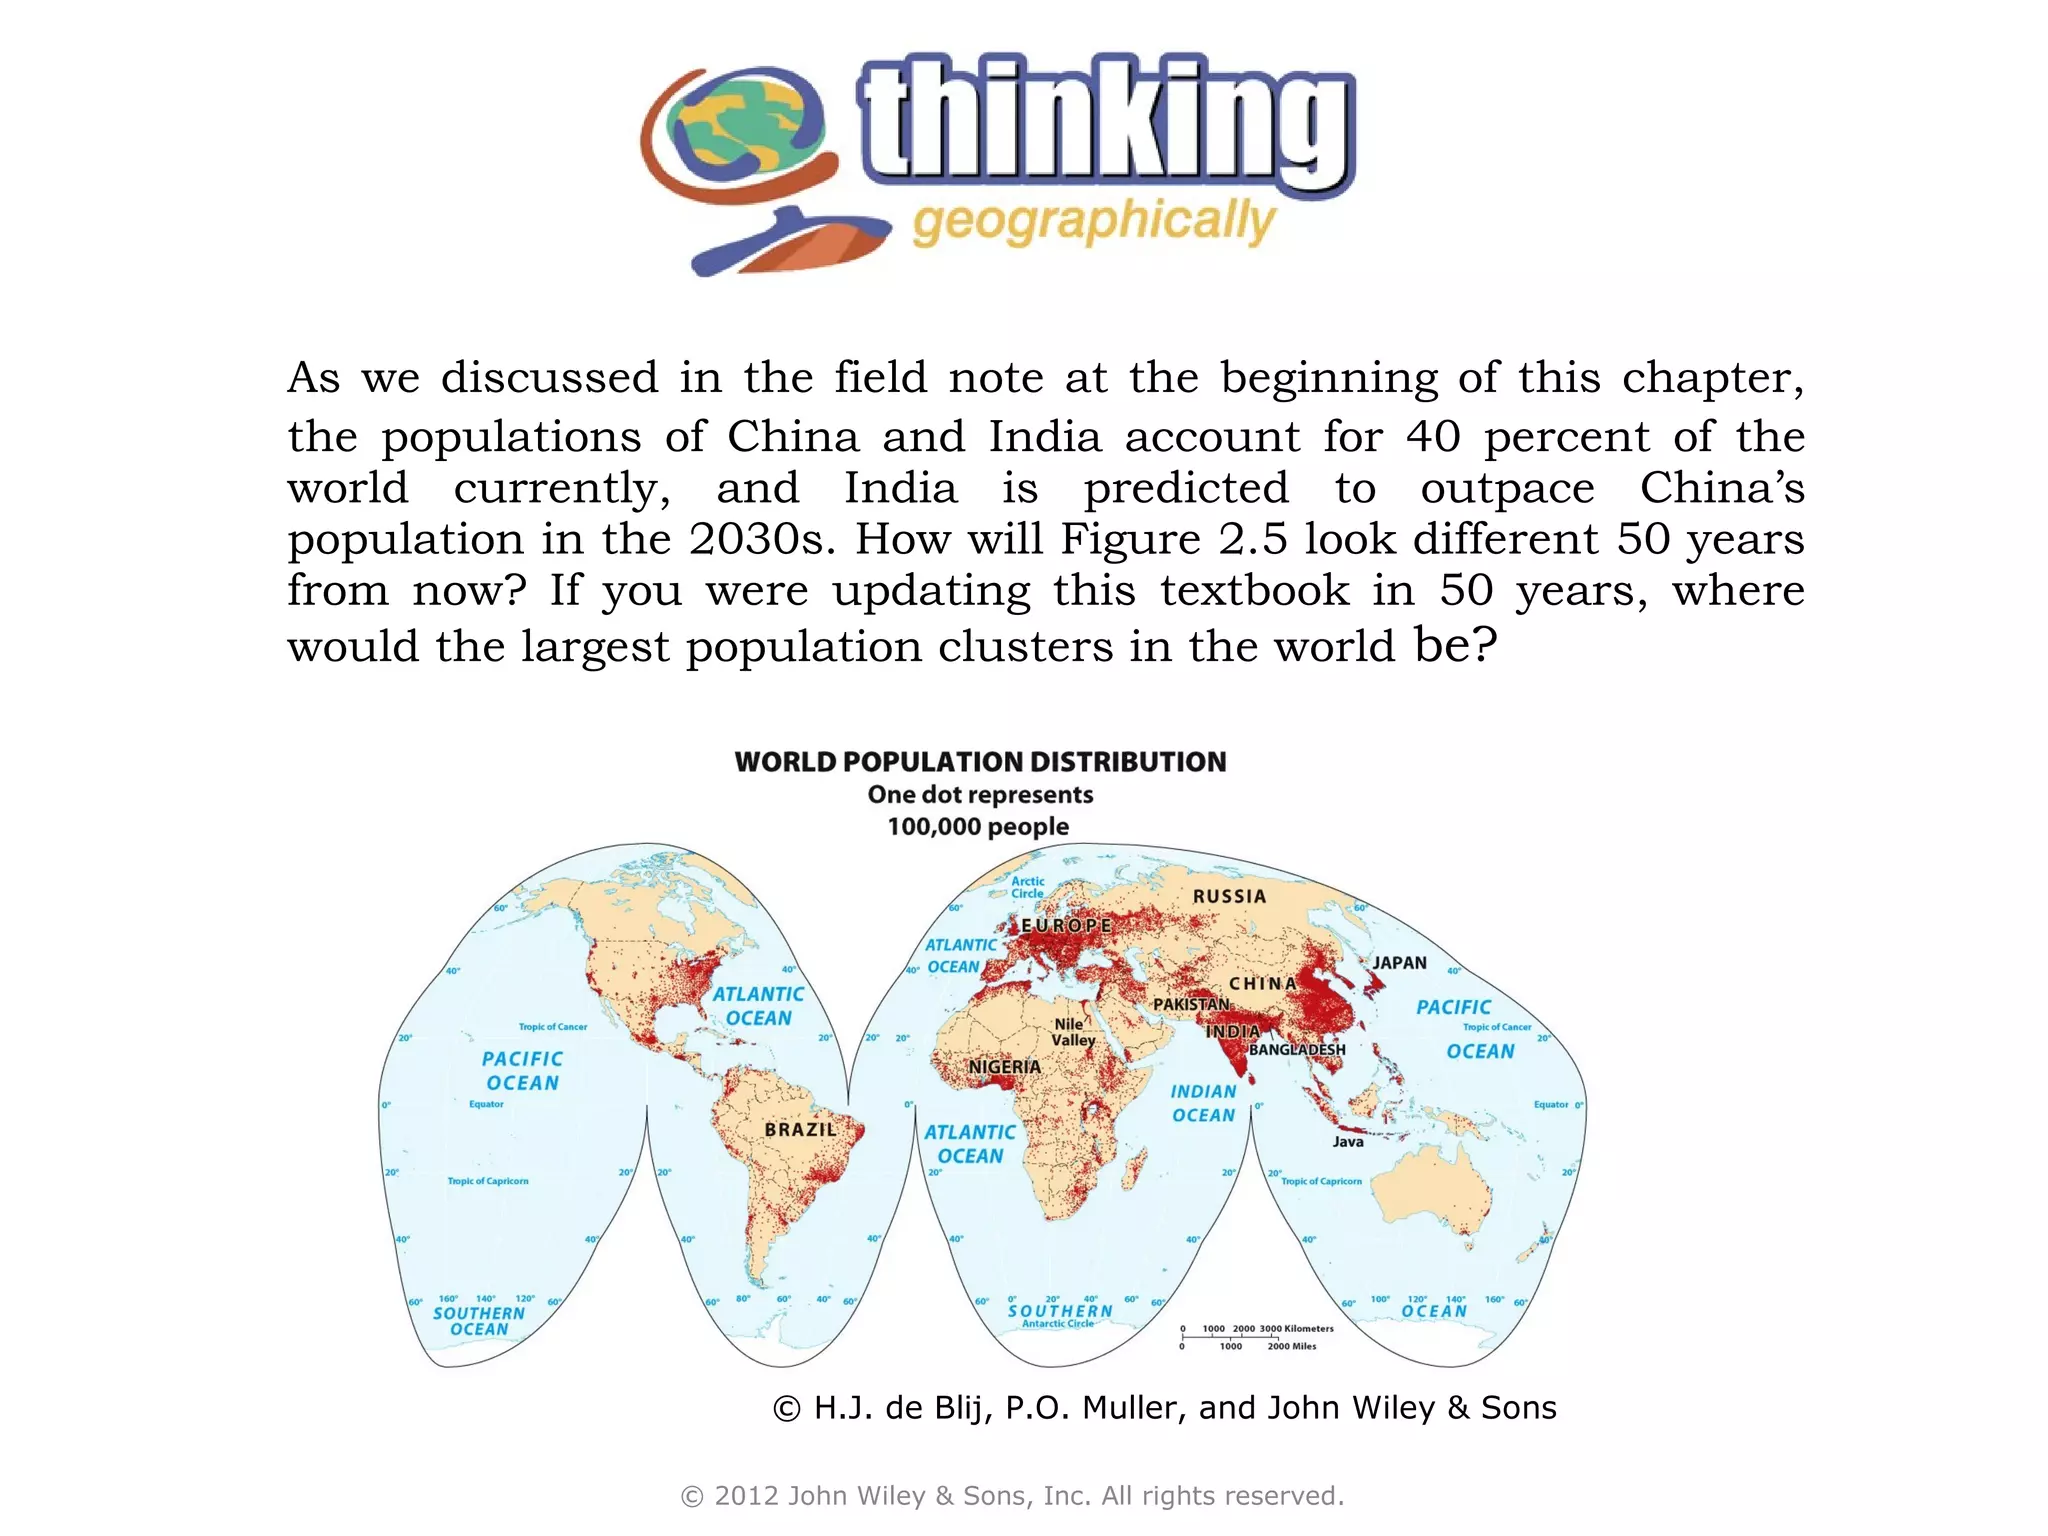
3) China and India currently make up 40% of the world's population and India is predicted to outpace China by the 2030s.
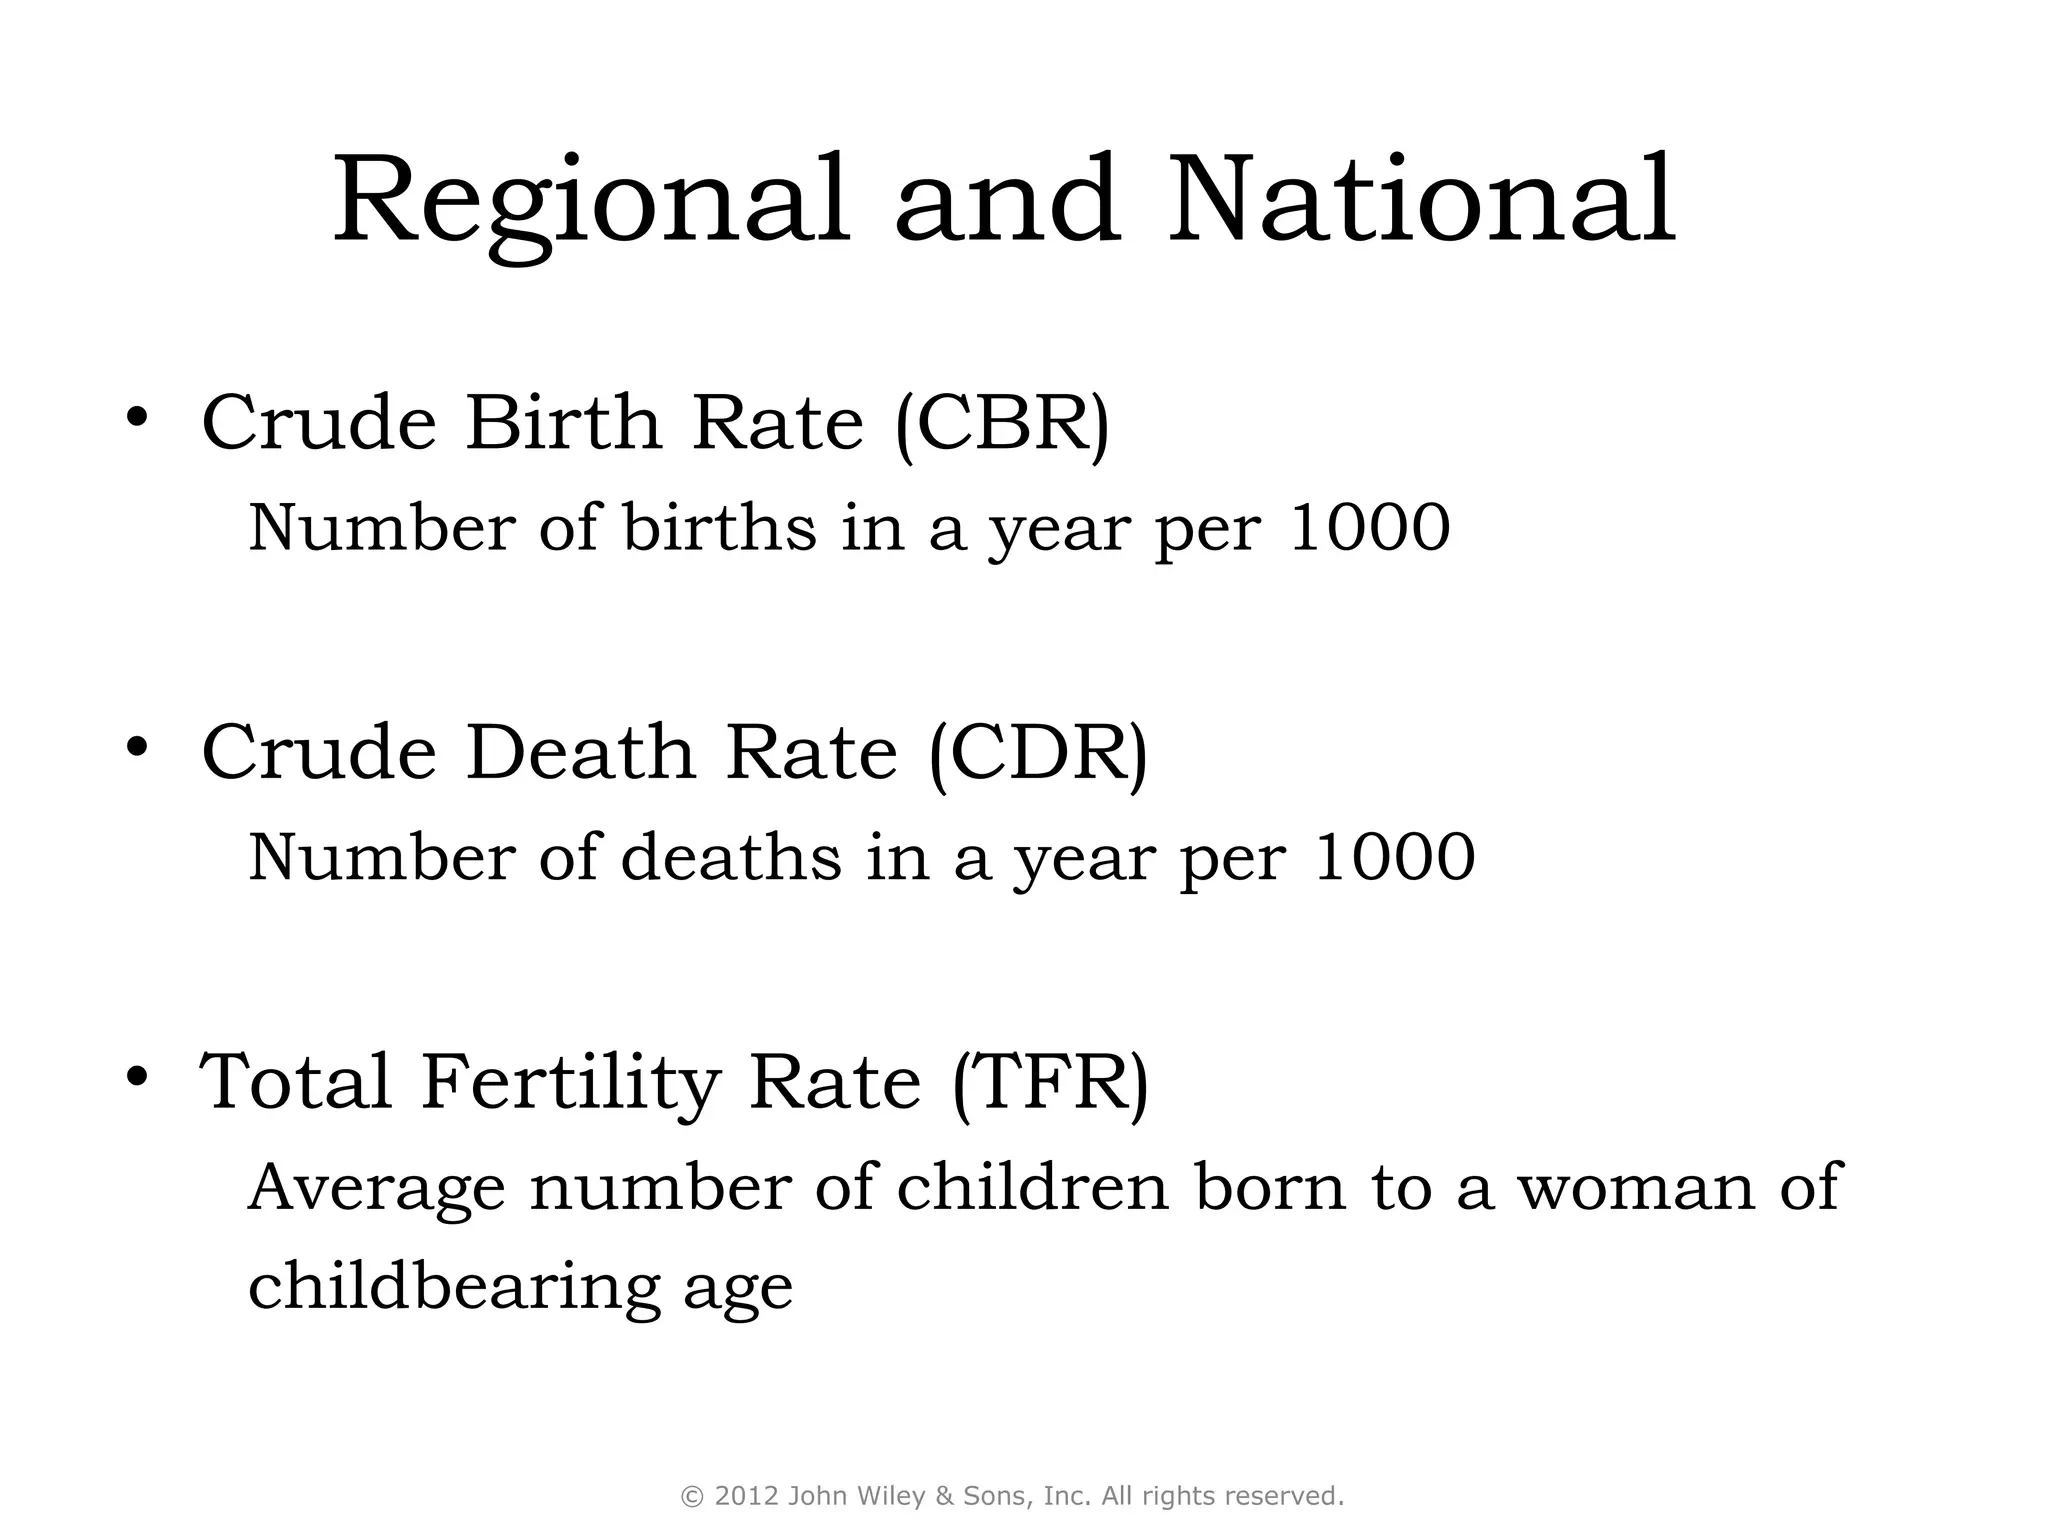
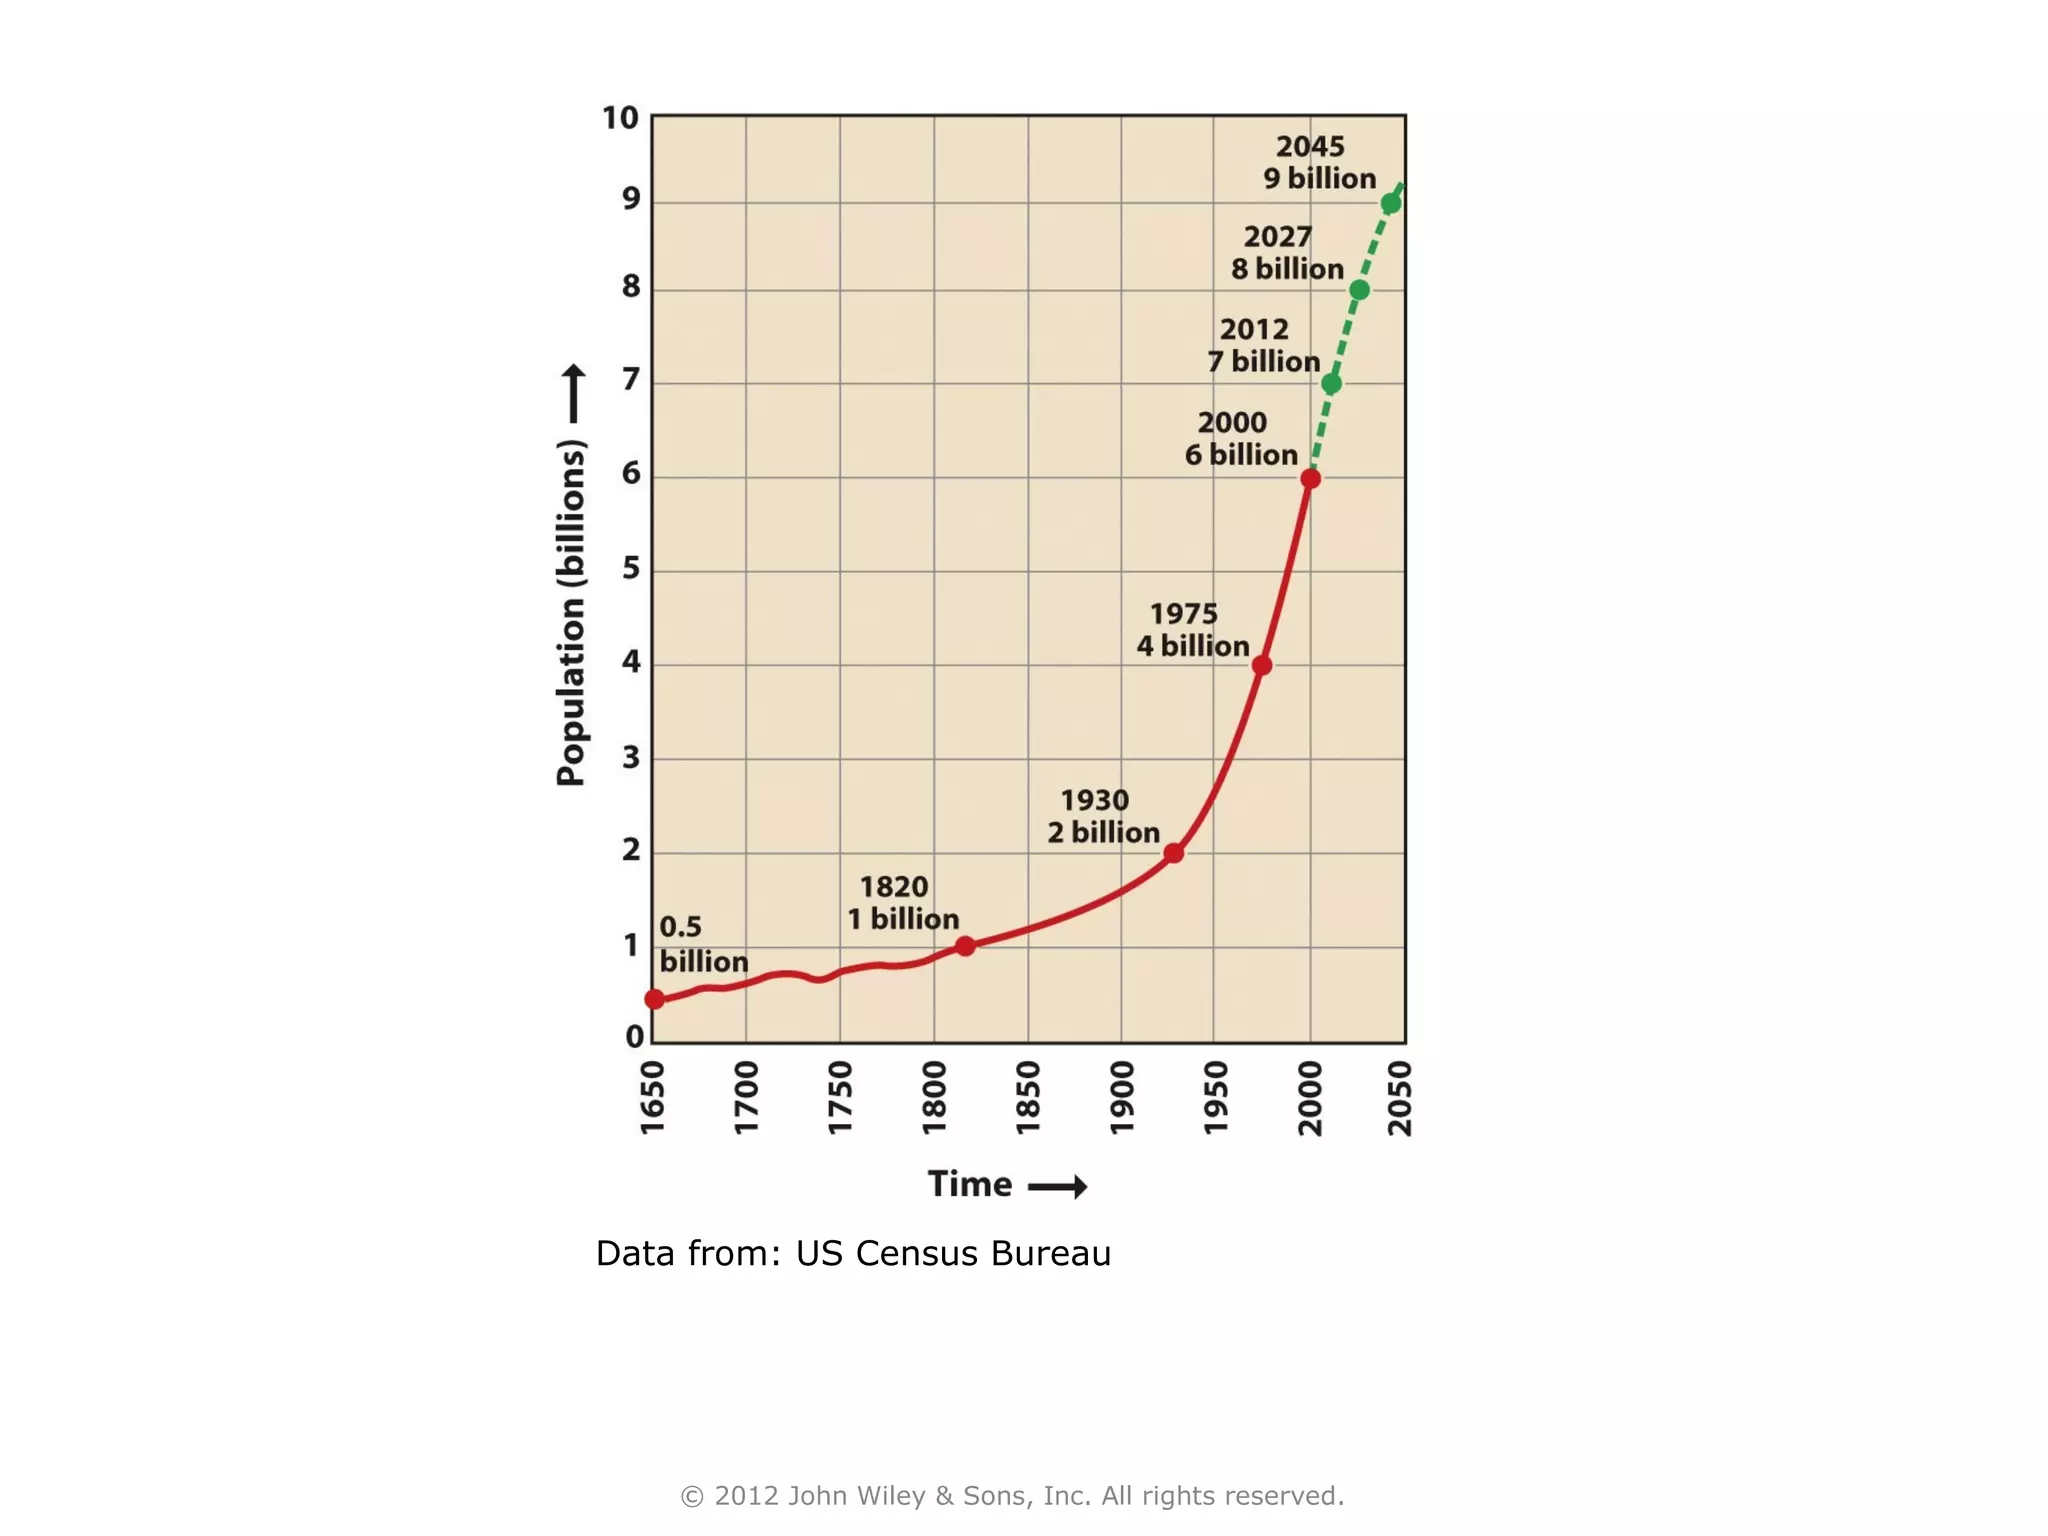
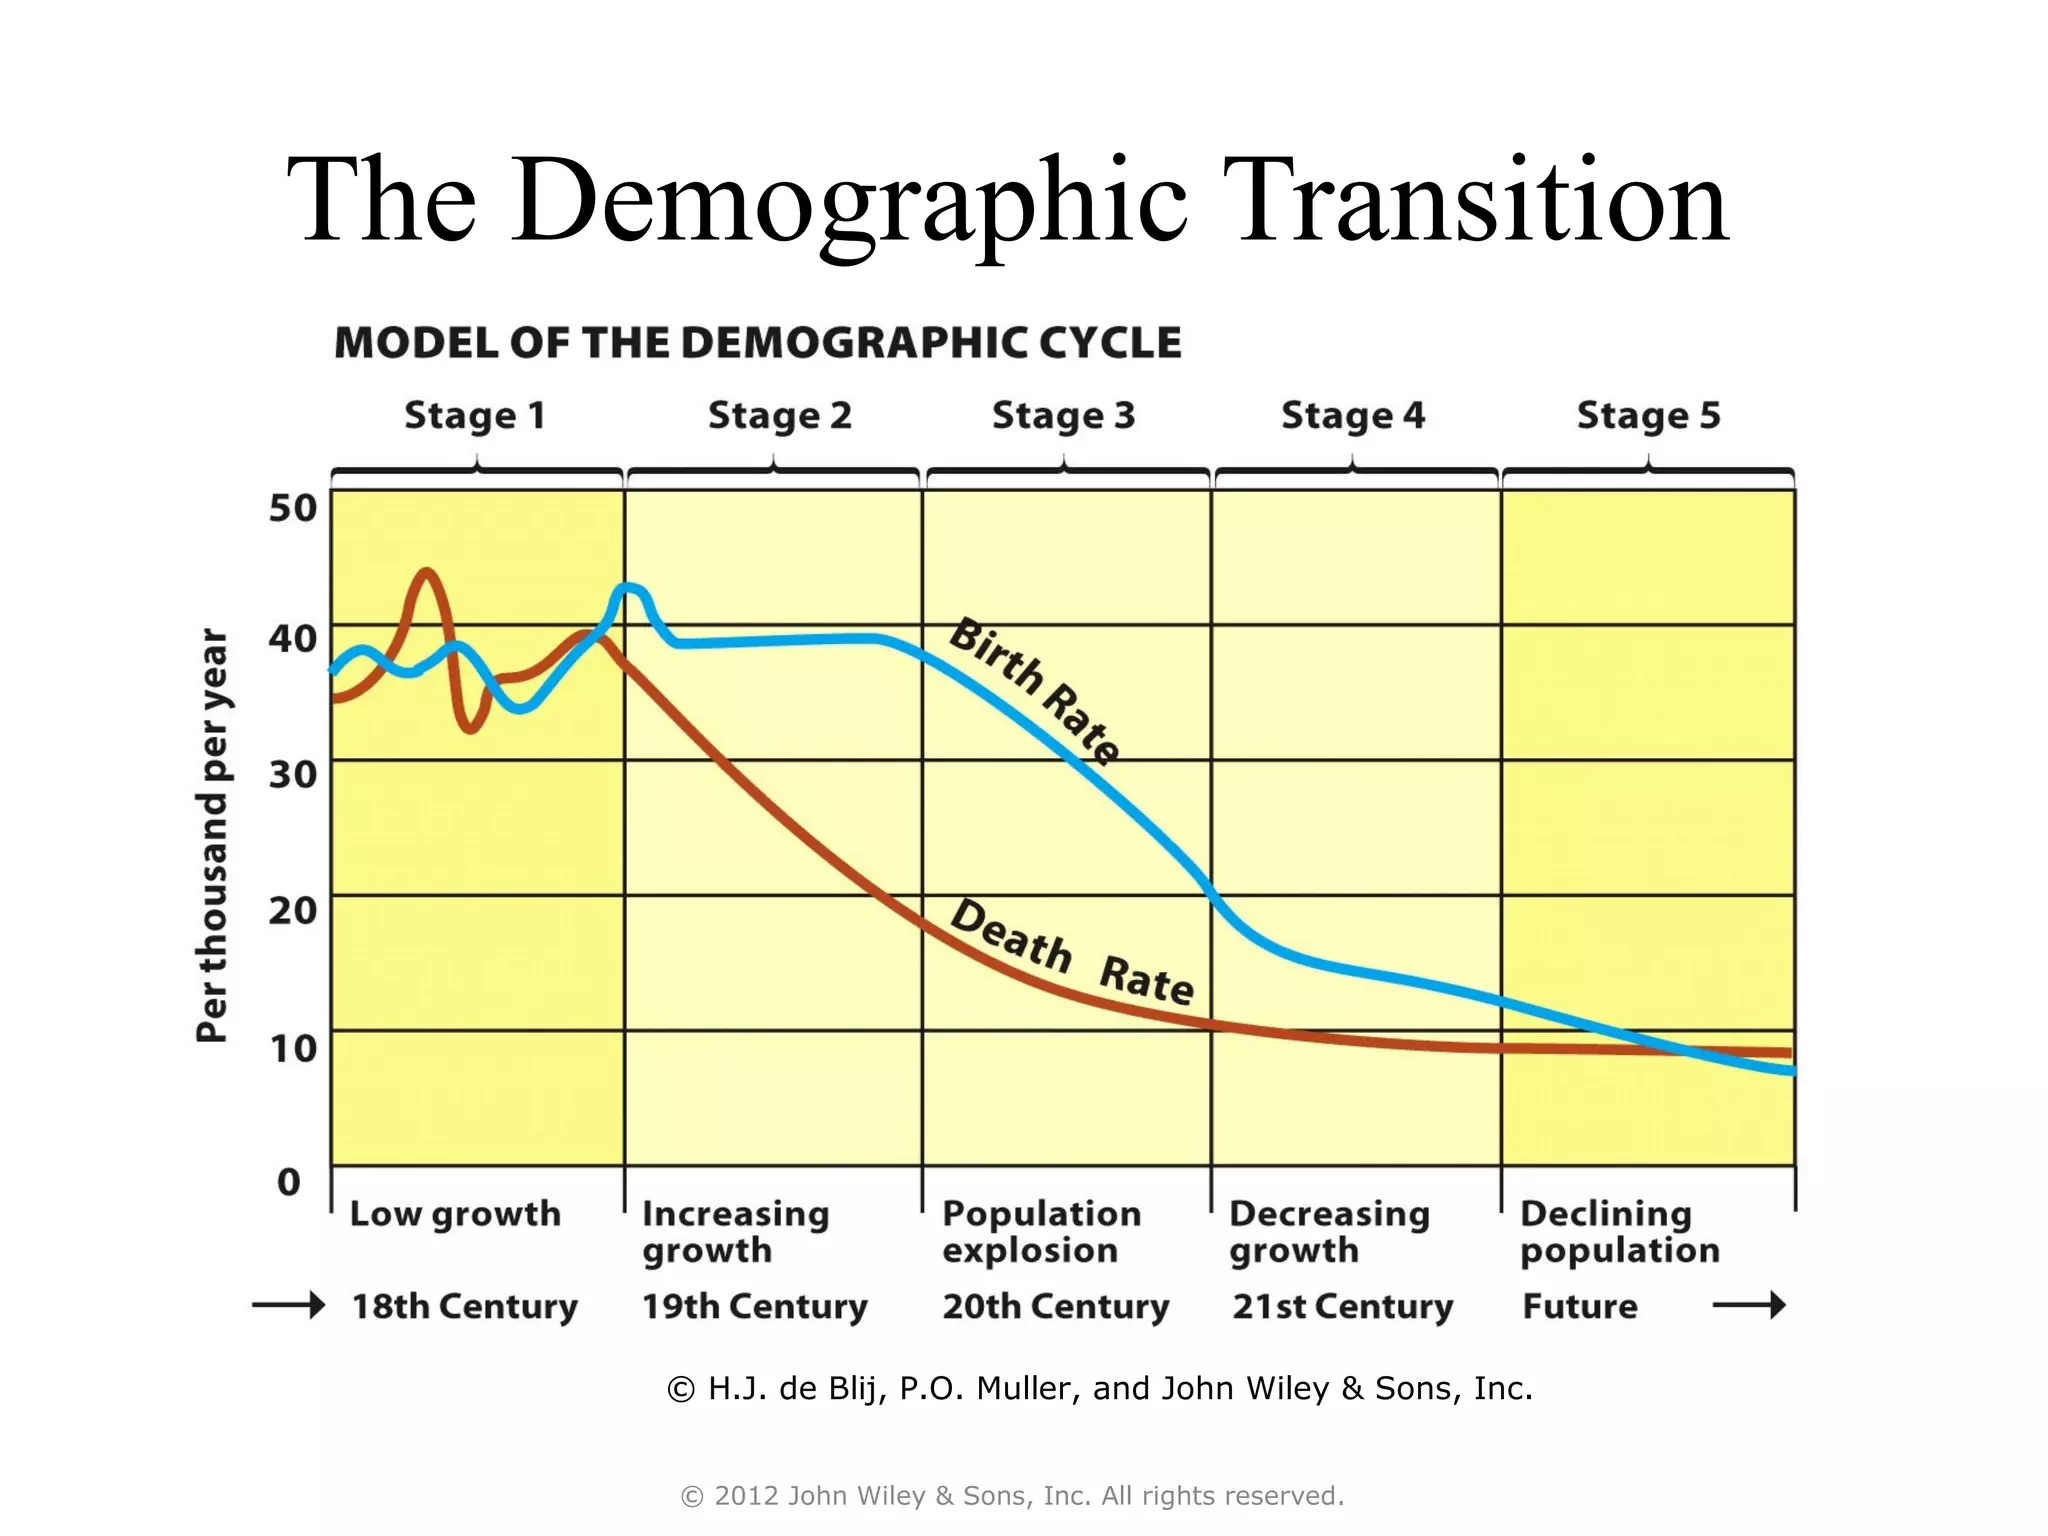
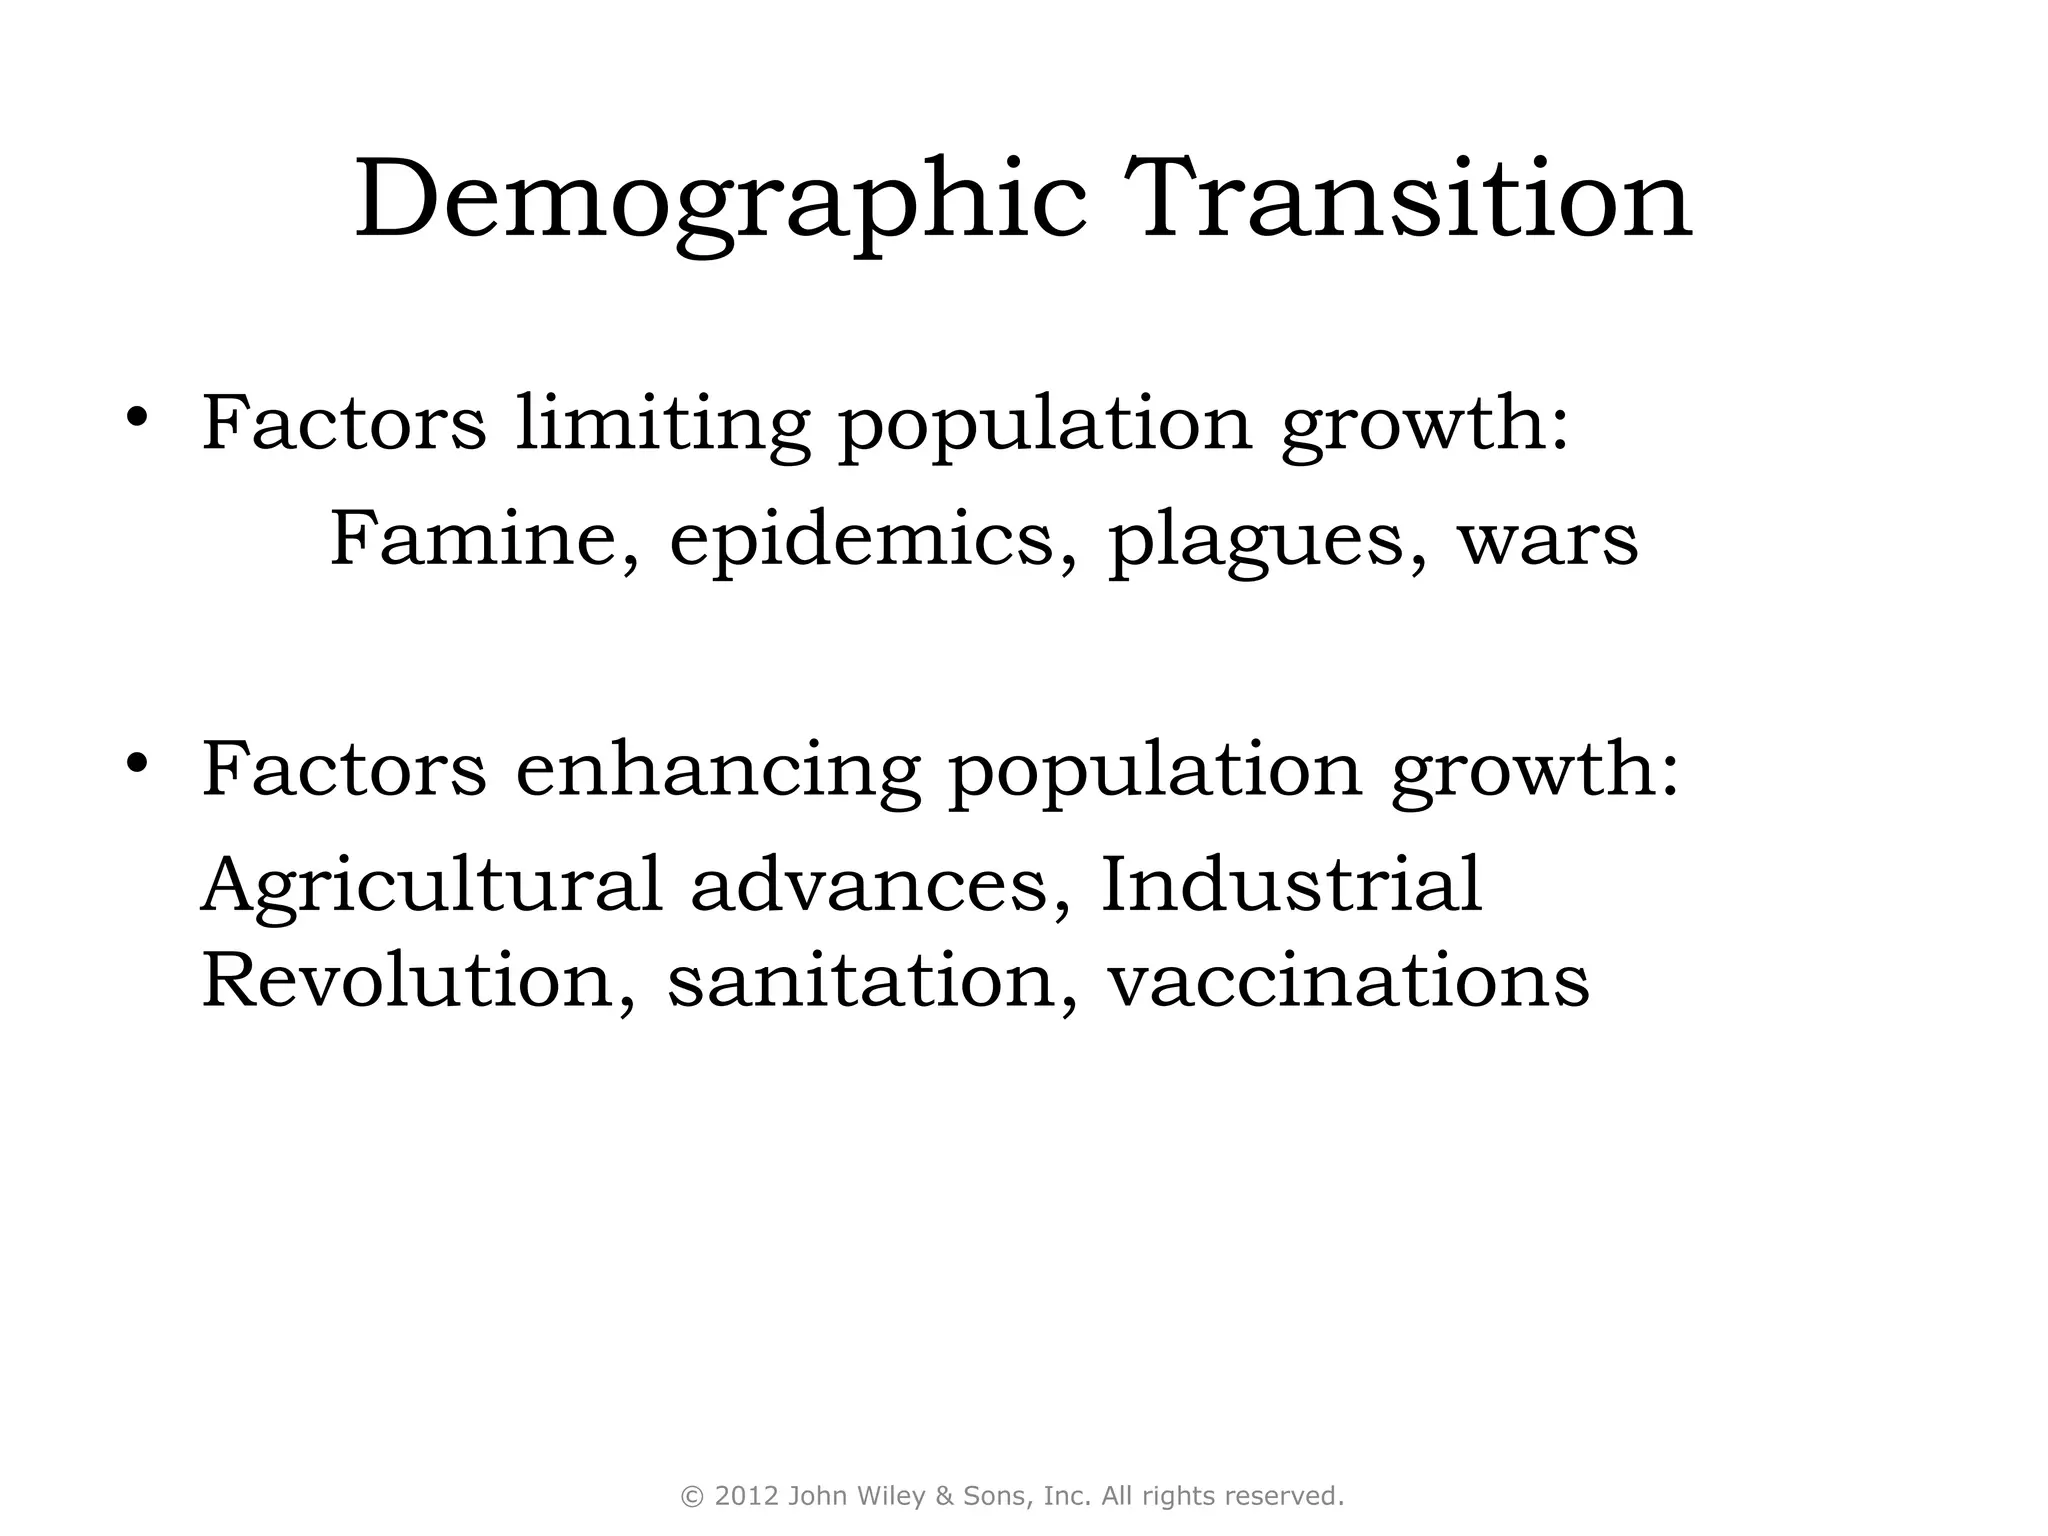
4) Population growth is determined by births and deaths, as well as immigration and emigration. Factors like improved healthcare have led to demographic transitions with lower birth rates in many countries.