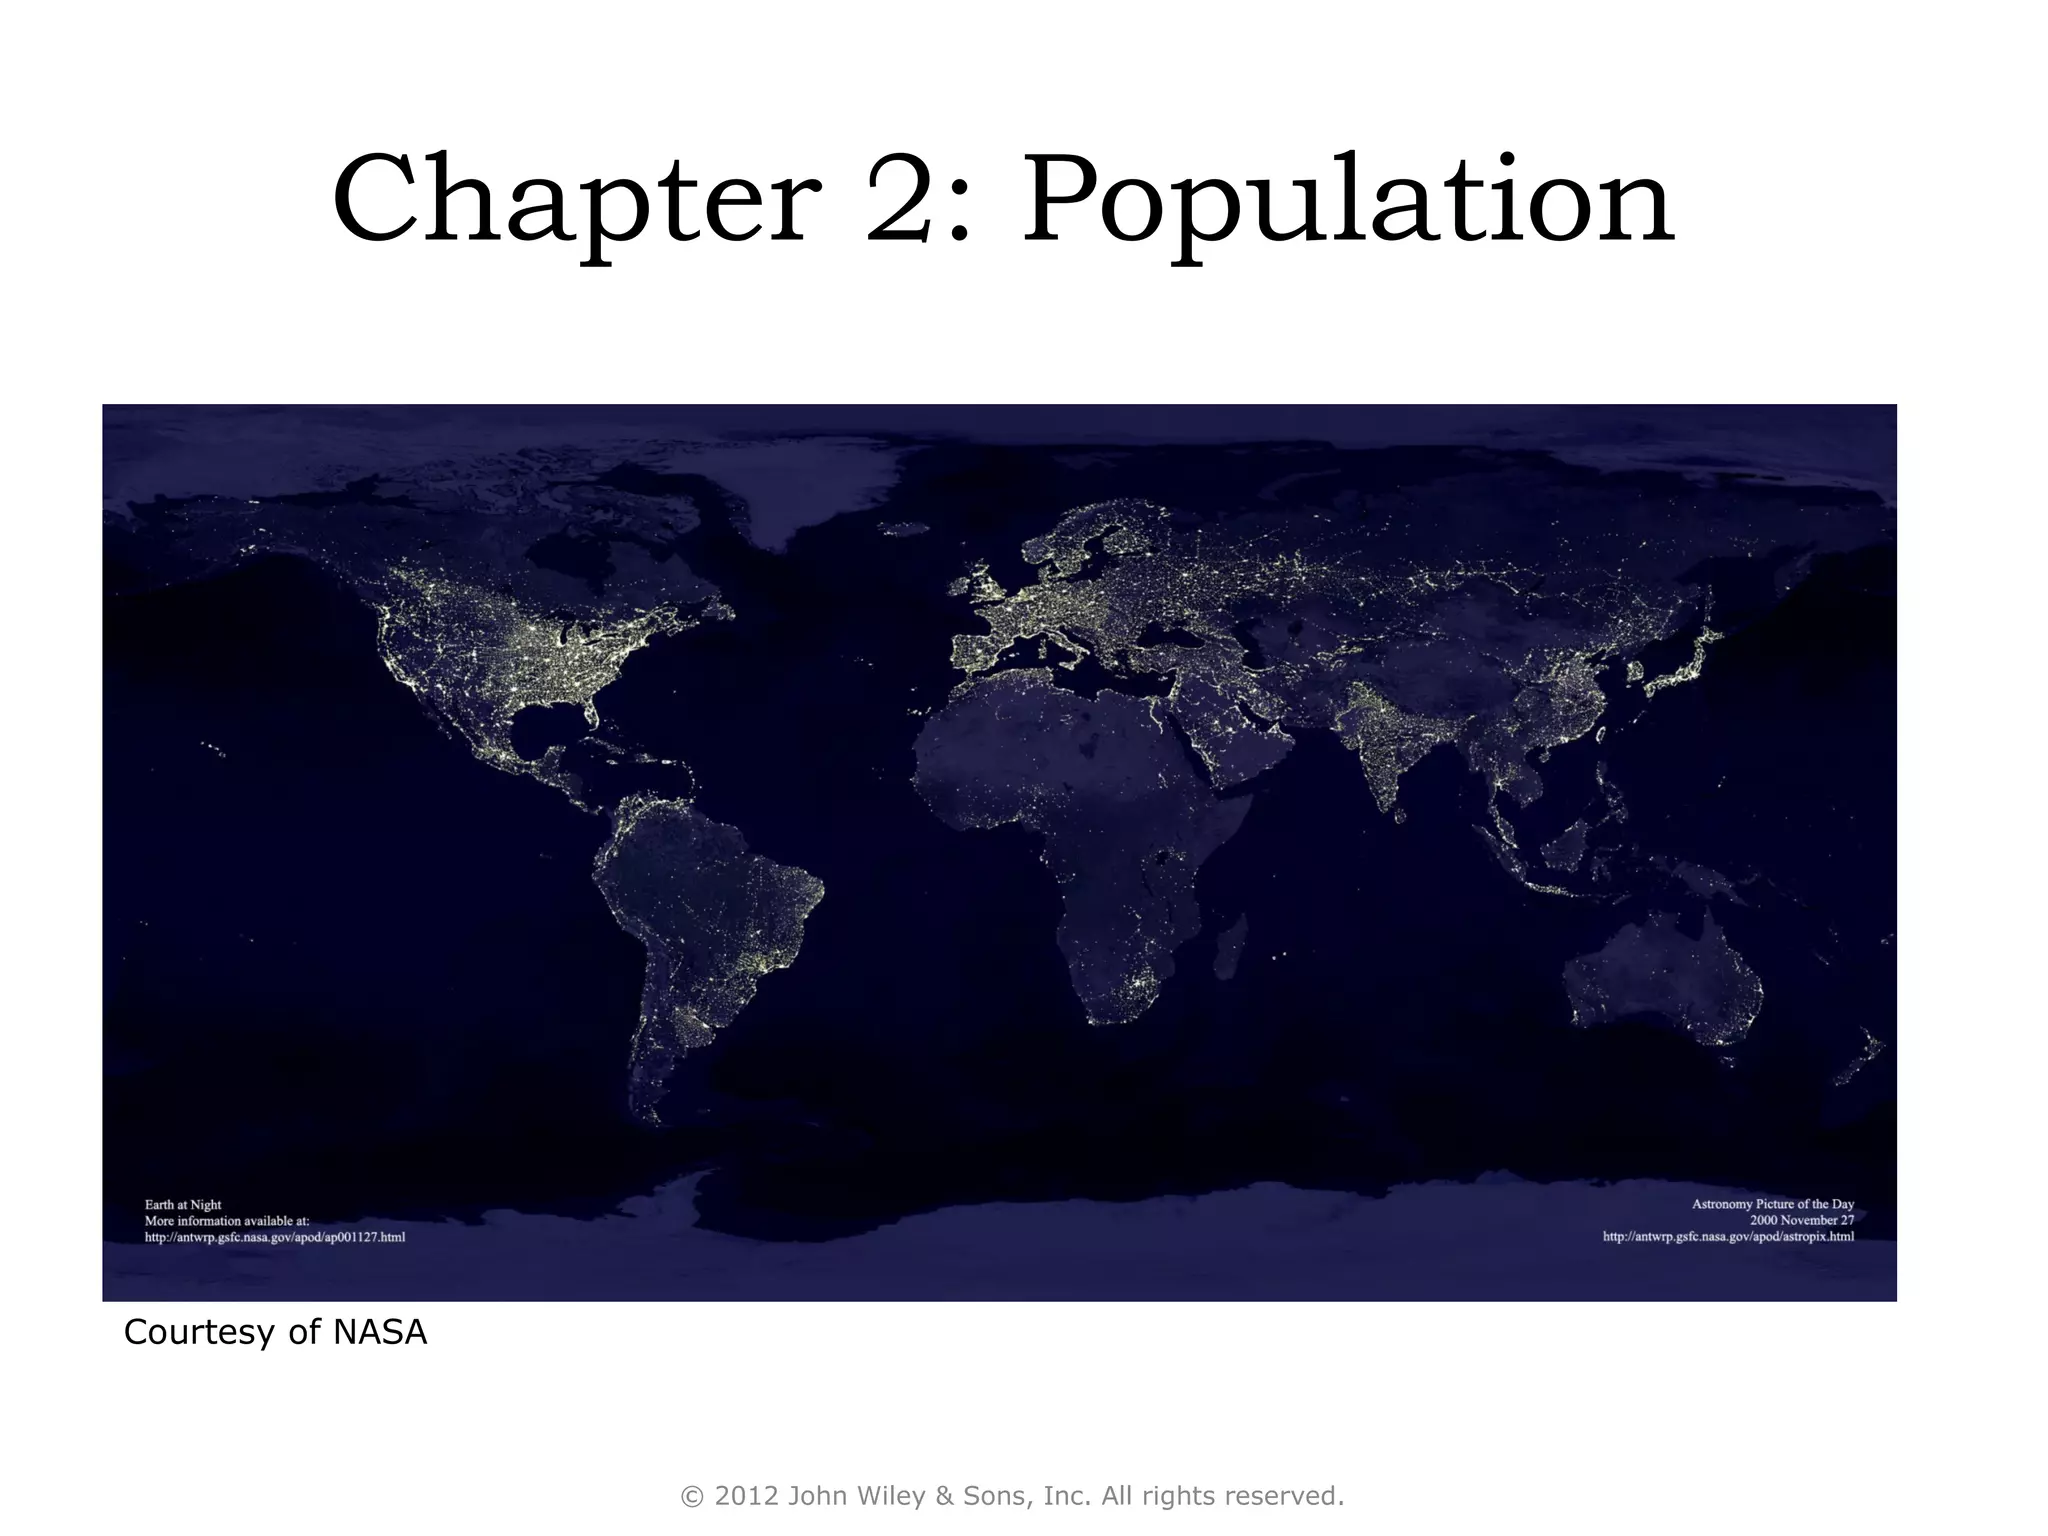
Chapter 2: Population 
© 2012 John Wiley & Sons, Inc. All rights reserved. 
Courtesy of NASA
Field Note: 
Basic Infrastructure 
“The words wafted in the air as my 
colleague and I took a minute to 
process them. We were in 
Shanghai, China, visiting with a 
Chinese student who had spent a 
semester at our small college in a 
town of 26,000 in rural South 
Dakota. My colleague had asked 
the student what he missed most 
about our small town of Aberdeen. 
He replied without hesitating, 
“Basic infrastructure.” 
© Erin Fouberg 
Shanghai, China 
© 2012 John Wiley & Sons, Inc. All rights reserved.
Key Question 
Where in the world do people 
live and why? 
© 2012 John Wiley & Sons, Inc. All rights reserved.
Field Note: 
Myanmar, Burma 
“An overpass across one of Yangon’s 
busy streets provides a good 
perspective on the press of 
humanity in lowland Southeast 
Asia. Whether in urban areas or on 
small back roads in the countryside, 
people are everywhere—young and 
old, fit and infirm. When population 
densities are high in areas of 
poverty and unsophisticated 
infrastructure, vulnerabilities to 
natural hazards can be particularly 
great. This became stunningly 
evident in 2008 when a tropical 
cyclone devastated a significant 
swath of the Irrawaddy Delta south 
of Yangon, killing some 100,000 
people and leaving millions 
homeless.” 
© 2012 John Wiley & Sons, Inc. All rights reserved. 
© Alexander B. Murphy
Where in the World Do People 
Live and Why? 
• Population density: a country’s total 
population relative to land size 
• Assumes an even distribution of 
population to the land 
© H.J. de Blij, P.O. Muller, and John Wiley & Sons 
© 2012 John Wiley & Sons, Inc. All rights reserved.
Where in the World Do People 
Live and Why? 
Physiologic Population Density 
• The number of people per unit area of 
agriculturally productive land 
Concept Caching: 
Rice Terraces- Bail, Indonesia 
© 2012 John Wiley & Sons, Inc. All rights reserved. 
© Matt Ebnier
Field Note: Luxor, Egypt 
© Alexander B. Murphy © Alexander B. Murphy 
Egypt’s arable lands are along the Nile River Valley. 
Moving away from the river a few blocks, the 
land becomes sandy and wind-sculpted. 
“The contrasting character of the Egyptian landscape could not be more striking. Along the Nile 
River, the landscape is one of green fields, scattered trees, and modest houses, as along this 
stretch of the river’s west bank near Luxor. But anytime I wander away from the river, brown, 
wind-sculpted sand dominates the scene as far as the eye can see. Where people live and what 
they do is not just a product of culture; it is shaped by the physical environment as well.” 
© 2012 John Wiley & Sons, Inc. All rights reserved.
Where in the World Do People 
Live and Why? 
Population Distribution 
• Descriptions of locations on the 
Earth’s surface where individuals or 
groups (depending on the scale) live. 
• Geographers often represent 
population distributions on dot maps, 
in which one dot represents a certain 
number of a population. 
© 2012 John Wiley & Sons, Inc. All rights reserved.
World Population Distribution 
© H.J. de Blij, P.O. Muller, and John Wiley & Sons 
© 2012 John Wiley & Sons, Inc. All rights reserved.
As we discussed in the field note at the beginning of this chapter, 
the populations of China and India account for 40 percent of the 
world currently, and India is predicted to outpace China’s 
population in the 2030s. How will Figure 2.5 look different 50 years 
from now? If you were updating this textbook in 50 years, where 
would the largest population clusters in the world be? 
© H.J. de Blij, P.O. Muller, and John Wiley & Sons 
© 2012 John Wiley & Sons, Inc. All rights reserved.
Where in the World Do People 
Live and Why? 
Reliability of Population Data 
• Census: Federal government funding 
depends on population data. 
• Political implications of under-representation 
of populations. 
• United Nations, World Bank, and 
Population Reference Bureau collect data 
on world populations. 
© 2012 John Wiley & Sons, Inc. All rights reserved.
East Asia 
• Almost 25% of world’s population 
• Population concentrated in Korea, 
Japan, China 
• Over 1.3 billion people in China 
© 2012 John Wiley & Sons, Inc. All rights reserved.
South Asia 
• Physical geography barriers separate 
population clusters 
Himalaya Mountains; Indus River Valley 
Confined region with rapidly growing 
population 
• Bangladesh: 152 million people in an area 
the size of Iowa 
© 2012 John Wiley & Sons, Inc. All rights reserved.
North America 
• Megalopolis 
Huge urban agglomerations; Boston, 
NYC, Philadelphia, Baltimore, 
Washington, D.C 
This accounts for more than 20% of US 
population 
© 2012 John Wiley & Sons, Inc. All rights reserved.
Key Question 
• Why Do Populations Rise and 
Fall in Particular Places? 
© 2012 John Wiley & Sons, Inc. All rights reserved.
Population: Rise and Fall 
• Thomas Malthus: An Essay on the 
Principles of Population 
• Grows faster than food supply; food 
grows linearly, population grows 
exponentially 
© 2012 John Wiley & Sons, Inc. All rights reserved.
Population Growth: World, 
Regional, National Scales 
• Births – Deaths = Natural Increase 
Does not factor immigration (in-migration) 
or emigration (outmigration) 
into the equation 
© 2012 John Wiley & Sons, Inc. All rights reserved.
Regional and National 
• Crude Birth Rate (CBR) 
Number of births in a year per 1000 
• Crude Death Rate (CDR) 
Number of deaths in a year per 1000 
• Total Fertility Rate (TFR) 
Average number of children born to a woman of 
childbearing age 
© 2012 John Wiley & Sons, Inc. All rights reserved.
Field Note: Bordeaux, France 
“My mind was on wine. I was in Bordeaux, 
France, walking down the street to the 
Bordeaux Wines Museum (Musée des Vins 
de Bordeaux) with a friend from the city. 
Having just flown from Dakar, Senegal, 
after spending several weeks in 
Subsaharan Africa, I found my current 
surroundings strikingly different. 
Observing the buildings and the people 
around me, I noticed that after having been 
among so many young children in 
Subsaharan Africa, the majority of the 
inhabitants I encountered in Bordeaux 
were adults. I turned to my friend and 
asked, “Where are all the children?” He 
looked around, pointed, and replied, “There 
goes one now!” In Bordeaux, in Paris, in all 
of France and the rest of Europe, there are 
fewer children and populations are aging. 
© 2012 John Wiley & Sons, Inc. All rights reserved. 
CCoonncceepptt CCaacchhiinngg:: 
BBoorrddeeaauuxx,, FFrraannccee 
© Harm de Blij
Data from: US Census Bureau 
© 2012 John Wiley & Sons, Inc. All rights reserved.
Future Population Growth 
• Stationary Population Level (SPL) 
The level at which a national population 
ceases to grow 
Anticipated dates for population 
stabilization are often moved back 
Ex. Brazil and India 
© 2012 John Wiley & Sons, Inc. All rights reserved.
The Demographic Transition 
© H.J. de Blij, P.O. Muller, and John Wiley & Sons, Inc. 
© 2012 John Wiley & Sons, Inc. All rights reserved.
Demographic Transition 
• Factors limiting population growth: 
Famine, epidemics, plagues, wars 
• Factors enhancing population growth: 
Agricultural advances, Industrial 
Revolution, sanitation, vaccinations 
© 2012 John Wiley & Sons, Inc. All rights reserved.
Key Question 
• Why Does Population 
Composition Matter? 
© 2012 John Wiley & Sons, Inc. All rights reserved.
Population Composition 
• The composition is the structure of a 
population in terms of age, sex, and other 
properties such as marital status and 
education. 
• Age and sex are key indicators of 
population composition, and demographers 
and geographers use population pyramids 
to represent these traits visually. 
© 2012 John Wiley & Sons, Inc. All rights reserved.
Population Composition (cont’d) 
• Young vs. elderly in any population 
will determine different social needs 
• Geographers are concerned with both 
spatial distribution and population 
composition 
© 2012 John Wiley & Sons, Inc. All rights reserved.
Figure 2.16 
Age–Sex Population Pyramids for 
Countries with High Population 
Growth Rates. 
Countries with high total fertility 
rates, high infant mortality rates 
and low life expectancies will have 
population pyramids with wide 
bases and narrow tops. 
Data from: UN, World Population Prospects 
Figure 2.17 
Age–Sex Population Pyramids 
for Countries with Low 
Population Growth Rates. 
Countries with lower total fertility 
rates and longer life expectancies 
have population pyramids shaped 
more uniformly throughout. 
Data from: UN, World Population Prospects 
© 2012 John Wiley & Sons, Inc. All rights reserved.
Key Question 
• How Does the Geography of Health 
Influence Population Dynamics? 
© 2012 John Wiley & Sons, Inc. All rights reserved.
Geographies of Health 
• Infant Mortality 
• Child Mortality 
• Life Expectancy 
© 2012 John Wiley & Sons, Inc. All rights reserved.
Study Figure 2.19, the infant 
mortality rate (IMR) by state in the 
United States. Hypothesize why 
the IMR is low in some regions of 
the country and high in others. 
Shift scales in your mind, and 
take one state and choose one 
state to consider: how do you 
think IMR varies within this 
state? 
What other factors are involved at 
this scale and this level of 
generalization to explain the 
pattern of IMRs? Use the 
population Internet sites listed at 
the end of this chapter to 
determine whether your 
hypotheses are correct. 
Data from Centers for Disease Control 
© 2012 John Wiley & Sons, Inc. All rights reserved.
Influence on Health and Well-Being 
• Health is closely related to location and 
environment 
• When an outbreak of a particular disease 
occurs its source and diffusion are studied 
by specialists in medical geography 
• Medical geographers study diseases, and 
they also use locational analysis to predict 
diffusion and prescribe prevention 
strategies 
© 2012 John Wiley & Sons, Inc. All rights reserved.
Infectious Diseases 
• 65% of all diseases are infectious 
• Malaria - Vectored 
• HIV/AIDS- Nonvectored 
© 2012 John Wiley & Sons, Inc. All rights reserved.
Chronic and Genetic Diseases 
• Also called degenerative diseases 
• Afflict middle and old age populations 
• 100 years ago in the United States: 
tuberculosis, pneumonia, and heart 
diseases 
• Today: Cancer, heart disease, stroke 
and accidents are the leading causes 
of death in the United States 
© 2012 John Wiley & Sons, Inc. All rights reserved.
Field Note: 
Johannesburg, South Africa 
“The day was so beautiful and the 
children’s faces so expressive I could 
hardly believe I was visiting an AIDS 
hospice village set up for children. The 
Sparrow Rainbow Village on the edges 
of Johannesburg, South Africa, is the 
product of an internationally funded 
effort to provide children with 
HIV/AIDS the opportunity to spend 
what time they have in a clean, safe 
environment. Playing with the children 
brought home the fragility of human life 
and the extraordinary impacts of a 
modern plague that has spread 
relentlessly across significant parts of 
Subsaharan Africa.” 
© 2012 John Wiley & Sons, Inc. All rights reserved. 
© Alexander B. Murphy 
CCoonncceepptt CCaacchhiinngg: 
Stop AIDS 
© Barbara Weightman
Guest Field Note: Marich 
Village, Kenya 
This drawing was done by a Pokot boy in a remote primary school in northwestern 
Kenya. He agreed to take part in my fieldwork some years after I had started 
researching young carers in Subsaharan Africa. Since those early interviews in 
Zimbabwe I have been acutely aware of young carers’ invisibility—you can’t tell 
who is a young carer just by looking at them. Indeed, invisibility is a characteristic 
of many aspects of the social impacts of HIV/AIDS. This young person drew 
himself working in the fields and taking care of cattle. African young people help 
with farming and herding for many reasons, but for young caregivers, assisting 
their sick family members in this way is especially important. 
© 2012 John Wiley & Sons, Inc. All rights reserved. 
© Elsbeth Robson
Key Question 
How Do Governments Affect 
Population Change? 
© 2012 John Wiley & Sons, Inc. All rights reserved.
Population and Government 
• Expansive population policies: 
Encourage large families and raise the 
rate of natural increase 
• Eugenic population policies: 
Designed to favor one racial or cultural 
sector of the population over others 
© 2012 John Wiley & Sons, Inc. All rights reserved.
Population and Government 
(cont’d) 
• Restrictive 
population policies 
e.g., One-Child Policy 
in China 
– Limitations: Sweden 
– Contradictions: 
Roman Catholic 
© H.J. de Blij 
Chengdu, China doctrine 
© 2012 John Wiley & Sons, Inc. All rights reserved.
Data from: Population Reference Bureau 
© 2012 John Wiley & Sons, Inc. All rights reserved.
Additional Resources 
200 Countries, 200 Years, 4 Minutes 
http://www.youtube.com/watch?v=jbkSRLYSojo 
© 2012 John Wiley & Sons, Inc. All rights reserved.

Chapter 2 Population

  • 1.
    Chapter 2: Population © 2012 John Wiley & Sons, Inc. All rights reserved. Courtesy of NASA
  • 2.
    Field Note: BasicInfrastructure “The words wafted in the air as my colleague and I took a minute to process them. We were in Shanghai, China, visiting with a Chinese student who had spent a semester at our small college in a town of 26,000 in rural South Dakota. My colleague had asked the student what he missed most about our small town of Aberdeen. He replied without hesitating, “Basic infrastructure.” © Erin Fouberg Shanghai, China © 2012 John Wiley & Sons, Inc. All rights reserved.
  • 3.
    Key Question Wherein the world do people live and why? © 2012 John Wiley & Sons, Inc. All rights reserved.
  • 4.
    Field Note: Myanmar,Burma “An overpass across one of Yangon’s busy streets provides a good perspective on the press of humanity in lowland Southeast Asia. Whether in urban areas or on small back roads in the countryside, people are everywhere—young and old, fit and infirm. When population densities are high in areas of poverty and unsophisticated infrastructure, vulnerabilities to natural hazards can be particularly great. This became stunningly evident in 2008 when a tropical cyclone devastated a significant swath of the Irrawaddy Delta south of Yangon, killing some 100,000 people and leaving millions homeless.” © 2012 John Wiley & Sons, Inc. All rights reserved. © Alexander B. Murphy
  • 5.
    Where in theWorld Do People Live and Why? • Population density: a country’s total population relative to land size • Assumes an even distribution of population to the land © H.J. de Blij, P.O. Muller, and John Wiley & Sons © 2012 John Wiley & Sons, Inc. All rights reserved.
  • 6.
    Where in theWorld Do People Live and Why? Physiologic Population Density • The number of people per unit area of agriculturally productive land Concept Caching: Rice Terraces- Bail, Indonesia © 2012 John Wiley & Sons, Inc. All rights reserved. © Matt Ebnier
  • 7.
    Field Note: Luxor,Egypt © Alexander B. Murphy © Alexander B. Murphy Egypt’s arable lands are along the Nile River Valley. Moving away from the river a few blocks, the land becomes sandy and wind-sculpted. “The contrasting character of the Egyptian landscape could not be more striking. Along the Nile River, the landscape is one of green fields, scattered trees, and modest houses, as along this stretch of the river’s west bank near Luxor. But anytime I wander away from the river, brown, wind-sculpted sand dominates the scene as far as the eye can see. Where people live and what they do is not just a product of culture; it is shaped by the physical environment as well.” © 2012 John Wiley & Sons, Inc. All rights reserved.
  • 8.
    Where in theWorld Do People Live and Why? Population Distribution • Descriptions of locations on the Earth’s surface where individuals or groups (depending on the scale) live. • Geographers often represent population distributions on dot maps, in which one dot represents a certain number of a population. © 2012 John Wiley & Sons, Inc. All rights reserved.
  • 9.
    World Population Distribution © H.J. de Blij, P.O. Muller, and John Wiley & Sons © 2012 John Wiley & Sons, Inc. All rights reserved.
  • 10.
    As we discussedin the field note at the beginning of this chapter, the populations of China and India account for 40 percent of the world currently, and India is predicted to outpace China’s population in the 2030s. How will Figure 2.5 look different 50 years from now? If you were updating this textbook in 50 years, where would the largest population clusters in the world be? © H.J. de Blij, P.O. Muller, and John Wiley & Sons © 2012 John Wiley & Sons, Inc. All rights reserved.
  • 11.
    Where in theWorld Do People Live and Why? Reliability of Population Data • Census: Federal government funding depends on population data. • Political implications of under-representation of populations. • United Nations, World Bank, and Population Reference Bureau collect data on world populations. © 2012 John Wiley & Sons, Inc. All rights reserved.
  • 12.
    East Asia •Almost 25% of world’s population • Population concentrated in Korea, Japan, China • Over 1.3 billion people in China © 2012 John Wiley & Sons, Inc. All rights reserved.
  • 13.
    South Asia •Physical geography barriers separate population clusters Himalaya Mountains; Indus River Valley Confined region with rapidly growing population • Bangladesh: 152 million people in an area the size of Iowa © 2012 John Wiley & Sons, Inc. All rights reserved.
  • 14.
    North America •Megalopolis Huge urban agglomerations; Boston, NYC, Philadelphia, Baltimore, Washington, D.C This accounts for more than 20% of US population © 2012 John Wiley & Sons, Inc. All rights reserved.
  • 15.
    Key Question •Why Do Populations Rise and Fall in Particular Places? © 2012 John Wiley & Sons, Inc. All rights reserved.
  • 16.
    Population: Rise andFall • Thomas Malthus: An Essay on the Principles of Population • Grows faster than food supply; food grows linearly, population grows exponentially © 2012 John Wiley & Sons, Inc. All rights reserved.
  • 17.
    Population Growth: World, Regional, National Scales • Births – Deaths = Natural Increase Does not factor immigration (in-migration) or emigration (outmigration) into the equation © 2012 John Wiley & Sons, Inc. All rights reserved.
  • 18.
    Regional and National • Crude Birth Rate (CBR) Number of births in a year per 1000 • Crude Death Rate (CDR) Number of deaths in a year per 1000 • Total Fertility Rate (TFR) Average number of children born to a woman of childbearing age © 2012 John Wiley & Sons, Inc. All rights reserved.
  • 19.
    Field Note: Bordeaux,France “My mind was on wine. I was in Bordeaux, France, walking down the street to the Bordeaux Wines Museum (Musée des Vins de Bordeaux) with a friend from the city. Having just flown from Dakar, Senegal, after spending several weeks in Subsaharan Africa, I found my current surroundings strikingly different. Observing the buildings and the people around me, I noticed that after having been among so many young children in Subsaharan Africa, the majority of the inhabitants I encountered in Bordeaux were adults. I turned to my friend and asked, “Where are all the children?” He looked around, pointed, and replied, “There goes one now!” In Bordeaux, in Paris, in all of France and the rest of Europe, there are fewer children and populations are aging. © 2012 John Wiley & Sons, Inc. All rights reserved. CCoonncceepptt CCaacchhiinngg:: BBoorrddeeaauuxx,, FFrraannccee © Harm de Blij
  • 20.
    Data from: USCensus Bureau © 2012 John Wiley & Sons, Inc. All rights reserved.
  • 21.
    Future Population Growth • Stationary Population Level (SPL) The level at which a national population ceases to grow Anticipated dates for population stabilization are often moved back Ex. Brazil and India © 2012 John Wiley & Sons, Inc. All rights reserved.
  • 22.
    The Demographic Transition © H.J. de Blij, P.O. Muller, and John Wiley & Sons, Inc. © 2012 John Wiley & Sons, Inc. All rights reserved.
  • 23.
    Demographic Transition •Factors limiting population growth: Famine, epidemics, plagues, wars • Factors enhancing population growth: Agricultural advances, Industrial Revolution, sanitation, vaccinations © 2012 John Wiley & Sons, Inc. All rights reserved.
  • 24.
    Key Question •Why Does Population Composition Matter? © 2012 John Wiley & Sons, Inc. All rights reserved.
  • 25.
    Population Composition •The composition is the structure of a population in terms of age, sex, and other properties such as marital status and education. • Age and sex are key indicators of population composition, and demographers and geographers use population pyramids to represent these traits visually. © 2012 John Wiley & Sons, Inc. All rights reserved.
  • 26.
    Population Composition (cont’d) • Young vs. elderly in any population will determine different social needs • Geographers are concerned with both spatial distribution and population composition © 2012 John Wiley & Sons, Inc. All rights reserved.
  • 27.
    Figure 2.16 Age–SexPopulation Pyramids for Countries with High Population Growth Rates. Countries with high total fertility rates, high infant mortality rates and low life expectancies will have population pyramids with wide bases and narrow tops. Data from: UN, World Population Prospects Figure 2.17 Age–Sex Population Pyramids for Countries with Low Population Growth Rates. Countries with lower total fertility rates and longer life expectancies have population pyramids shaped more uniformly throughout. Data from: UN, World Population Prospects © 2012 John Wiley & Sons, Inc. All rights reserved.
  • 28.
    Key Question •How Does the Geography of Health Influence Population Dynamics? © 2012 John Wiley & Sons, Inc. All rights reserved.
  • 29.
    Geographies of Health • Infant Mortality • Child Mortality • Life Expectancy © 2012 John Wiley & Sons, Inc. All rights reserved.
  • 30.
    Study Figure 2.19,the infant mortality rate (IMR) by state in the United States. Hypothesize why the IMR is low in some regions of the country and high in others. Shift scales in your mind, and take one state and choose one state to consider: how do you think IMR varies within this state? What other factors are involved at this scale and this level of generalization to explain the pattern of IMRs? Use the population Internet sites listed at the end of this chapter to determine whether your hypotheses are correct. Data from Centers for Disease Control © 2012 John Wiley & Sons, Inc. All rights reserved.
  • 31.
    Influence on Healthand Well-Being • Health is closely related to location and environment • When an outbreak of a particular disease occurs its source and diffusion are studied by specialists in medical geography • Medical geographers study diseases, and they also use locational analysis to predict diffusion and prescribe prevention strategies © 2012 John Wiley & Sons, Inc. All rights reserved.
  • 32.
    Infectious Diseases •65% of all diseases are infectious • Malaria - Vectored • HIV/AIDS- Nonvectored © 2012 John Wiley & Sons, Inc. All rights reserved.
  • 33.
    Chronic and GeneticDiseases • Also called degenerative diseases • Afflict middle and old age populations • 100 years ago in the United States: tuberculosis, pneumonia, and heart diseases • Today: Cancer, heart disease, stroke and accidents are the leading causes of death in the United States © 2012 John Wiley & Sons, Inc. All rights reserved.
  • 34.
    Field Note: Johannesburg,South Africa “The day was so beautiful and the children’s faces so expressive I could hardly believe I was visiting an AIDS hospice village set up for children. The Sparrow Rainbow Village on the edges of Johannesburg, South Africa, is the product of an internationally funded effort to provide children with HIV/AIDS the opportunity to spend what time they have in a clean, safe environment. Playing with the children brought home the fragility of human life and the extraordinary impacts of a modern plague that has spread relentlessly across significant parts of Subsaharan Africa.” © 2012 John Wiley & Sons, Inc. All rights reserved. © Alexander B. Murphy CCoonncceepptt CCaacchhiinngg: Stop AIDS © Barbara Weightman
  • 35.
    Guest Field Note:Marich Village, Kenya This drawing was done by a Pokot boy in a remote primary school in northwestern Kenya. He agreed to take part in my fieldwork some years after I had started researching young carers in Subsaharan Africa. Since those early interviews in Zimbabwe I have been acutely aware of young carers’ invisibility—you can’t tell who is a young carer just by looking at them. Indeed, invisibility is a characteristic of many aspects of the social impacts of HIV/AIDS. This young person drew himself working in the fields and taking care of cattle. African young people help with farming and herding for many reasons, but for young caregivers, assisting their sick family members in this way is especially important. © 2012 John Wiley & Sons, Inc. All rights reserved. © Elsbeth Robson
  • 36.
    Key Question HowDo Governments Affect Population Change? © 2012 John Wiley & Sons, Inc. All rights reserved.
  • 37.
    Population and Government • Expansive population policies: Encourage large families and raise the rate of natural increase • Eugenic population policies: Designed to favor one racial or cultural sector of the population over others © 2012 John Wiley & Sons, Inc. All rights reserved.
  • 38.
    Population and Government (cont’d) • Restrictive population policies e.g., One-Child Policy in China – Limitations: Sweden – Contradictions: Roman Catholic © H.J. de Blij Chengdu, China doctrine © 2012 John Wiley & Sons, Inc. All rights reserved.
  • 39.
    Data from: PopulationReference Bureau © 2012 John Wiley & Sons, Inc. All rights reserved.
  • 40.
    Additional Resources 200Countries, 200 Years, 4 Minutes http://www.youtube.com/watch?v=jbkSRLYSojo © 2012 John Wiley & Sons, Inc. All rights reserved.

Editor's Notes

  • #2 http://apod.nasa.gov/apod/ap001127.html
  • #10 Fig 2.5a/b