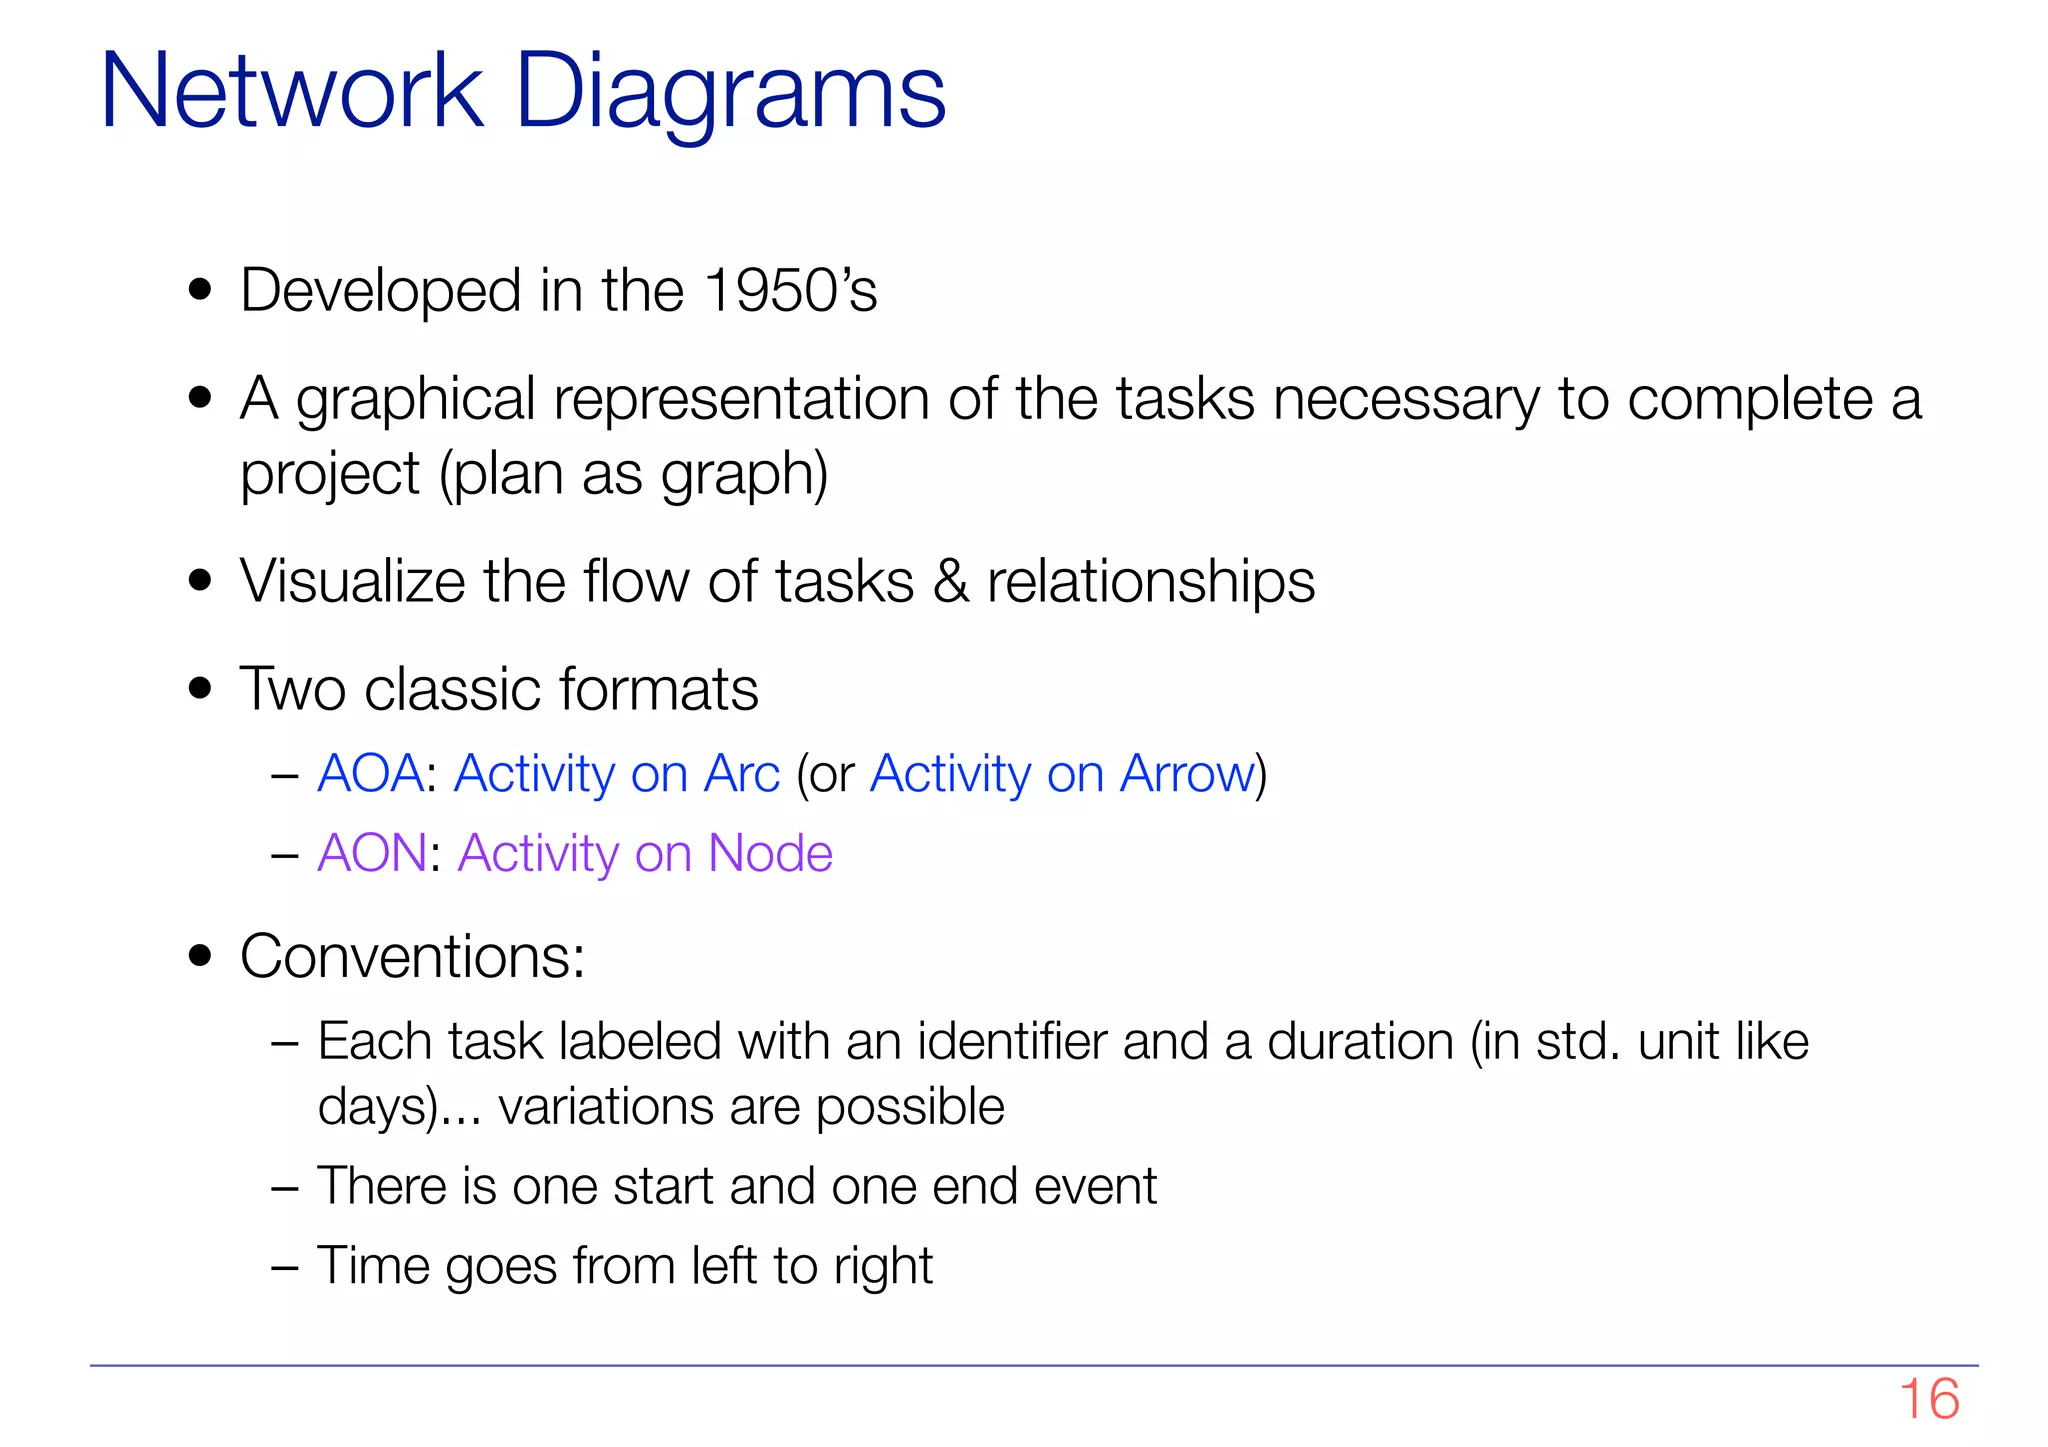
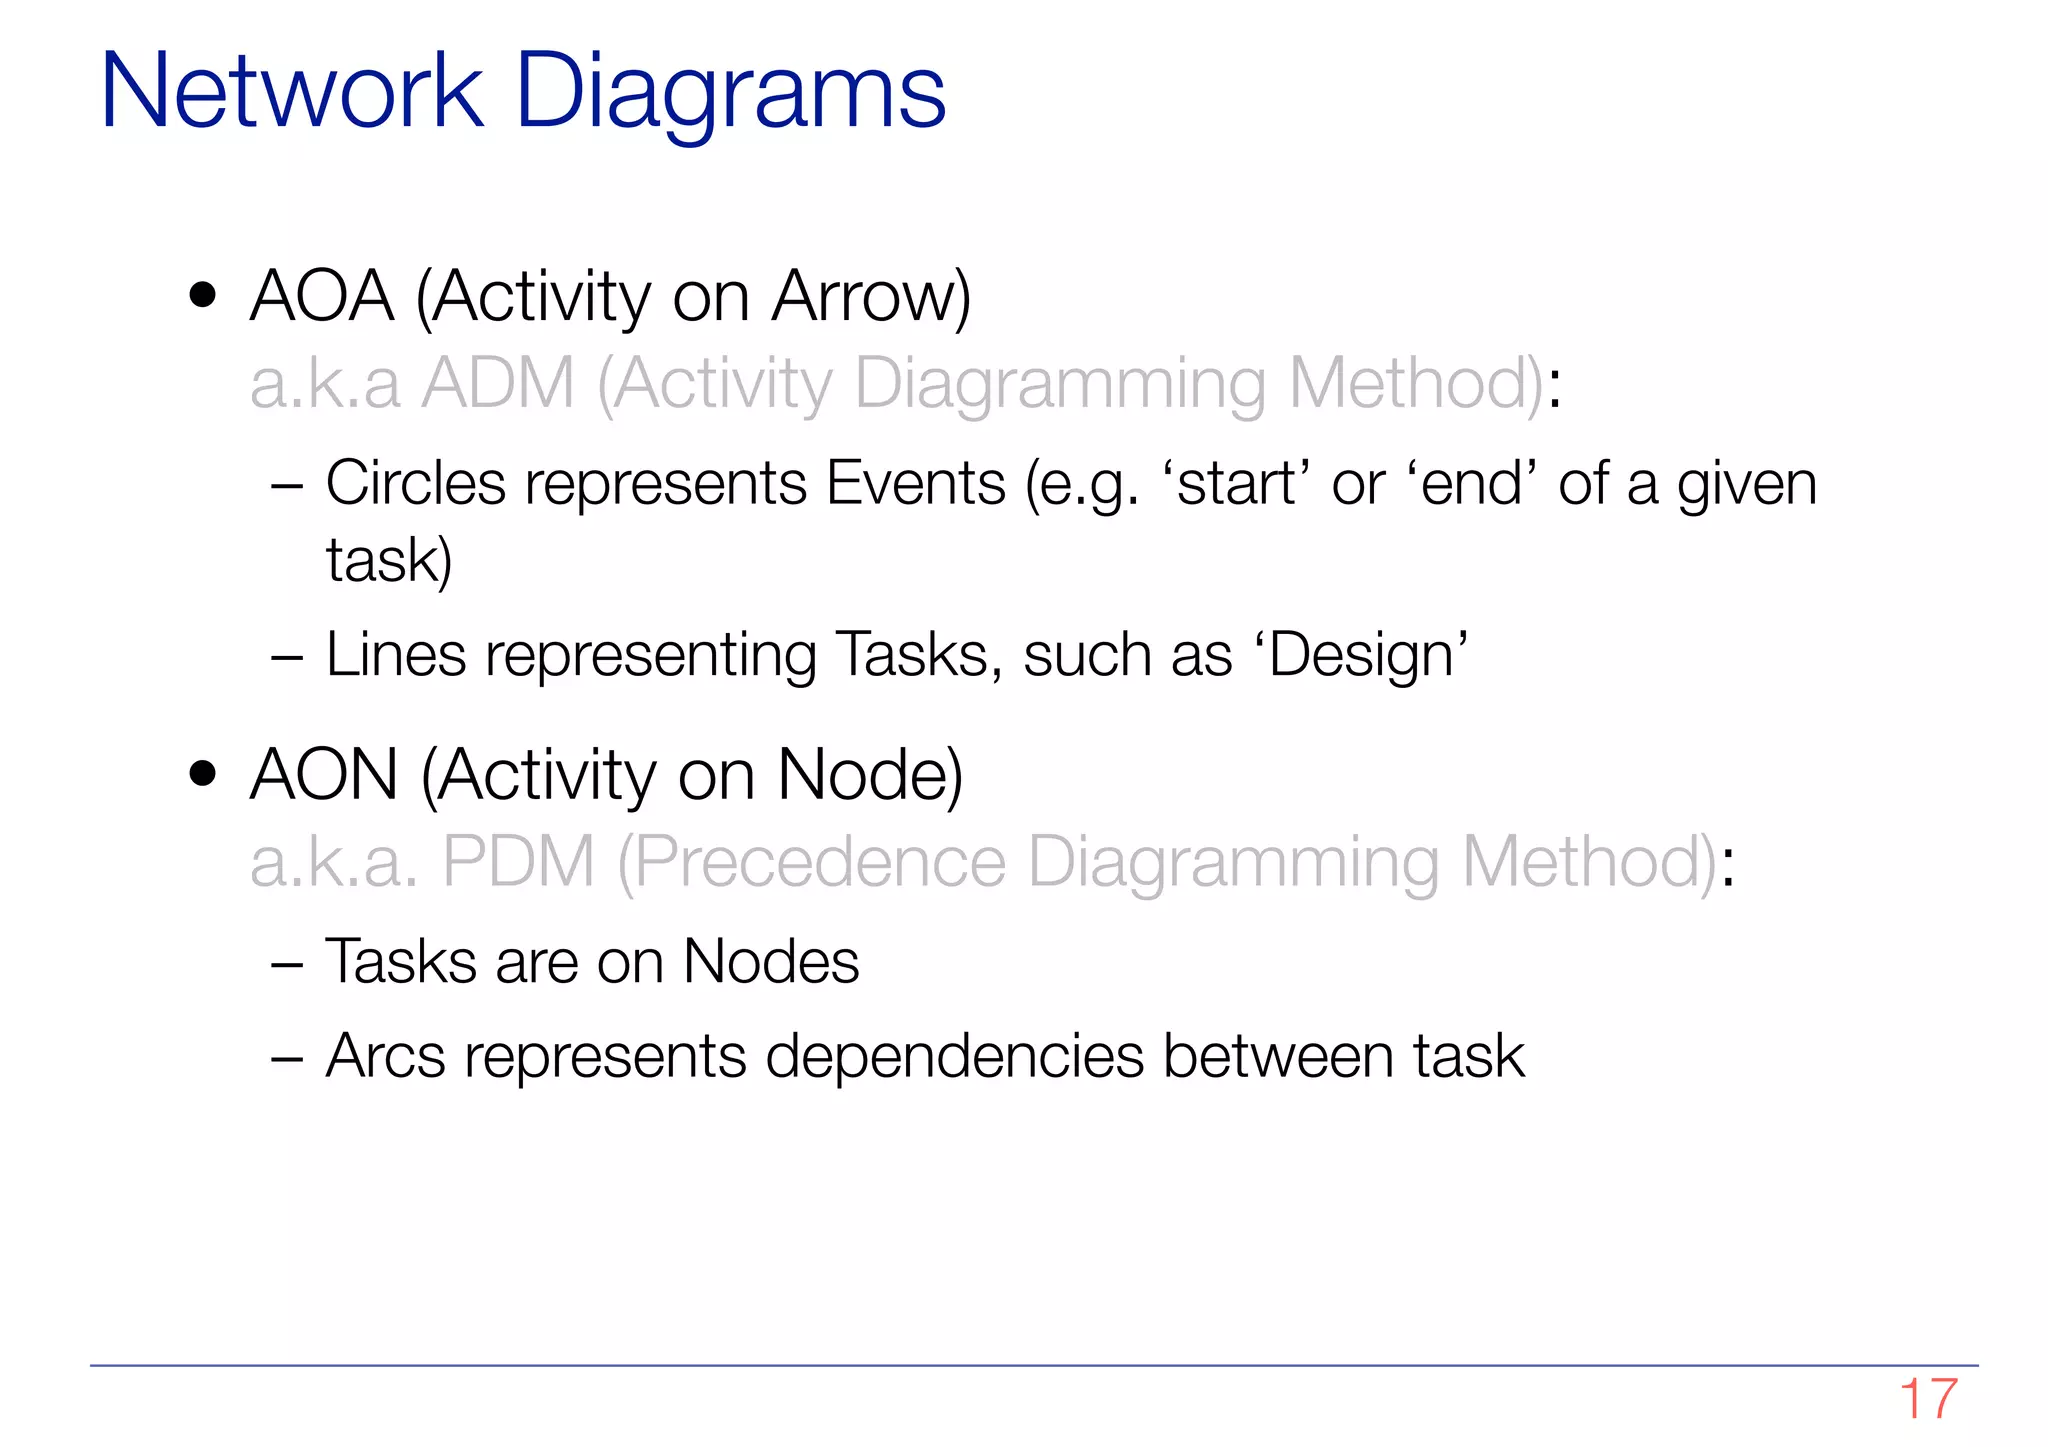
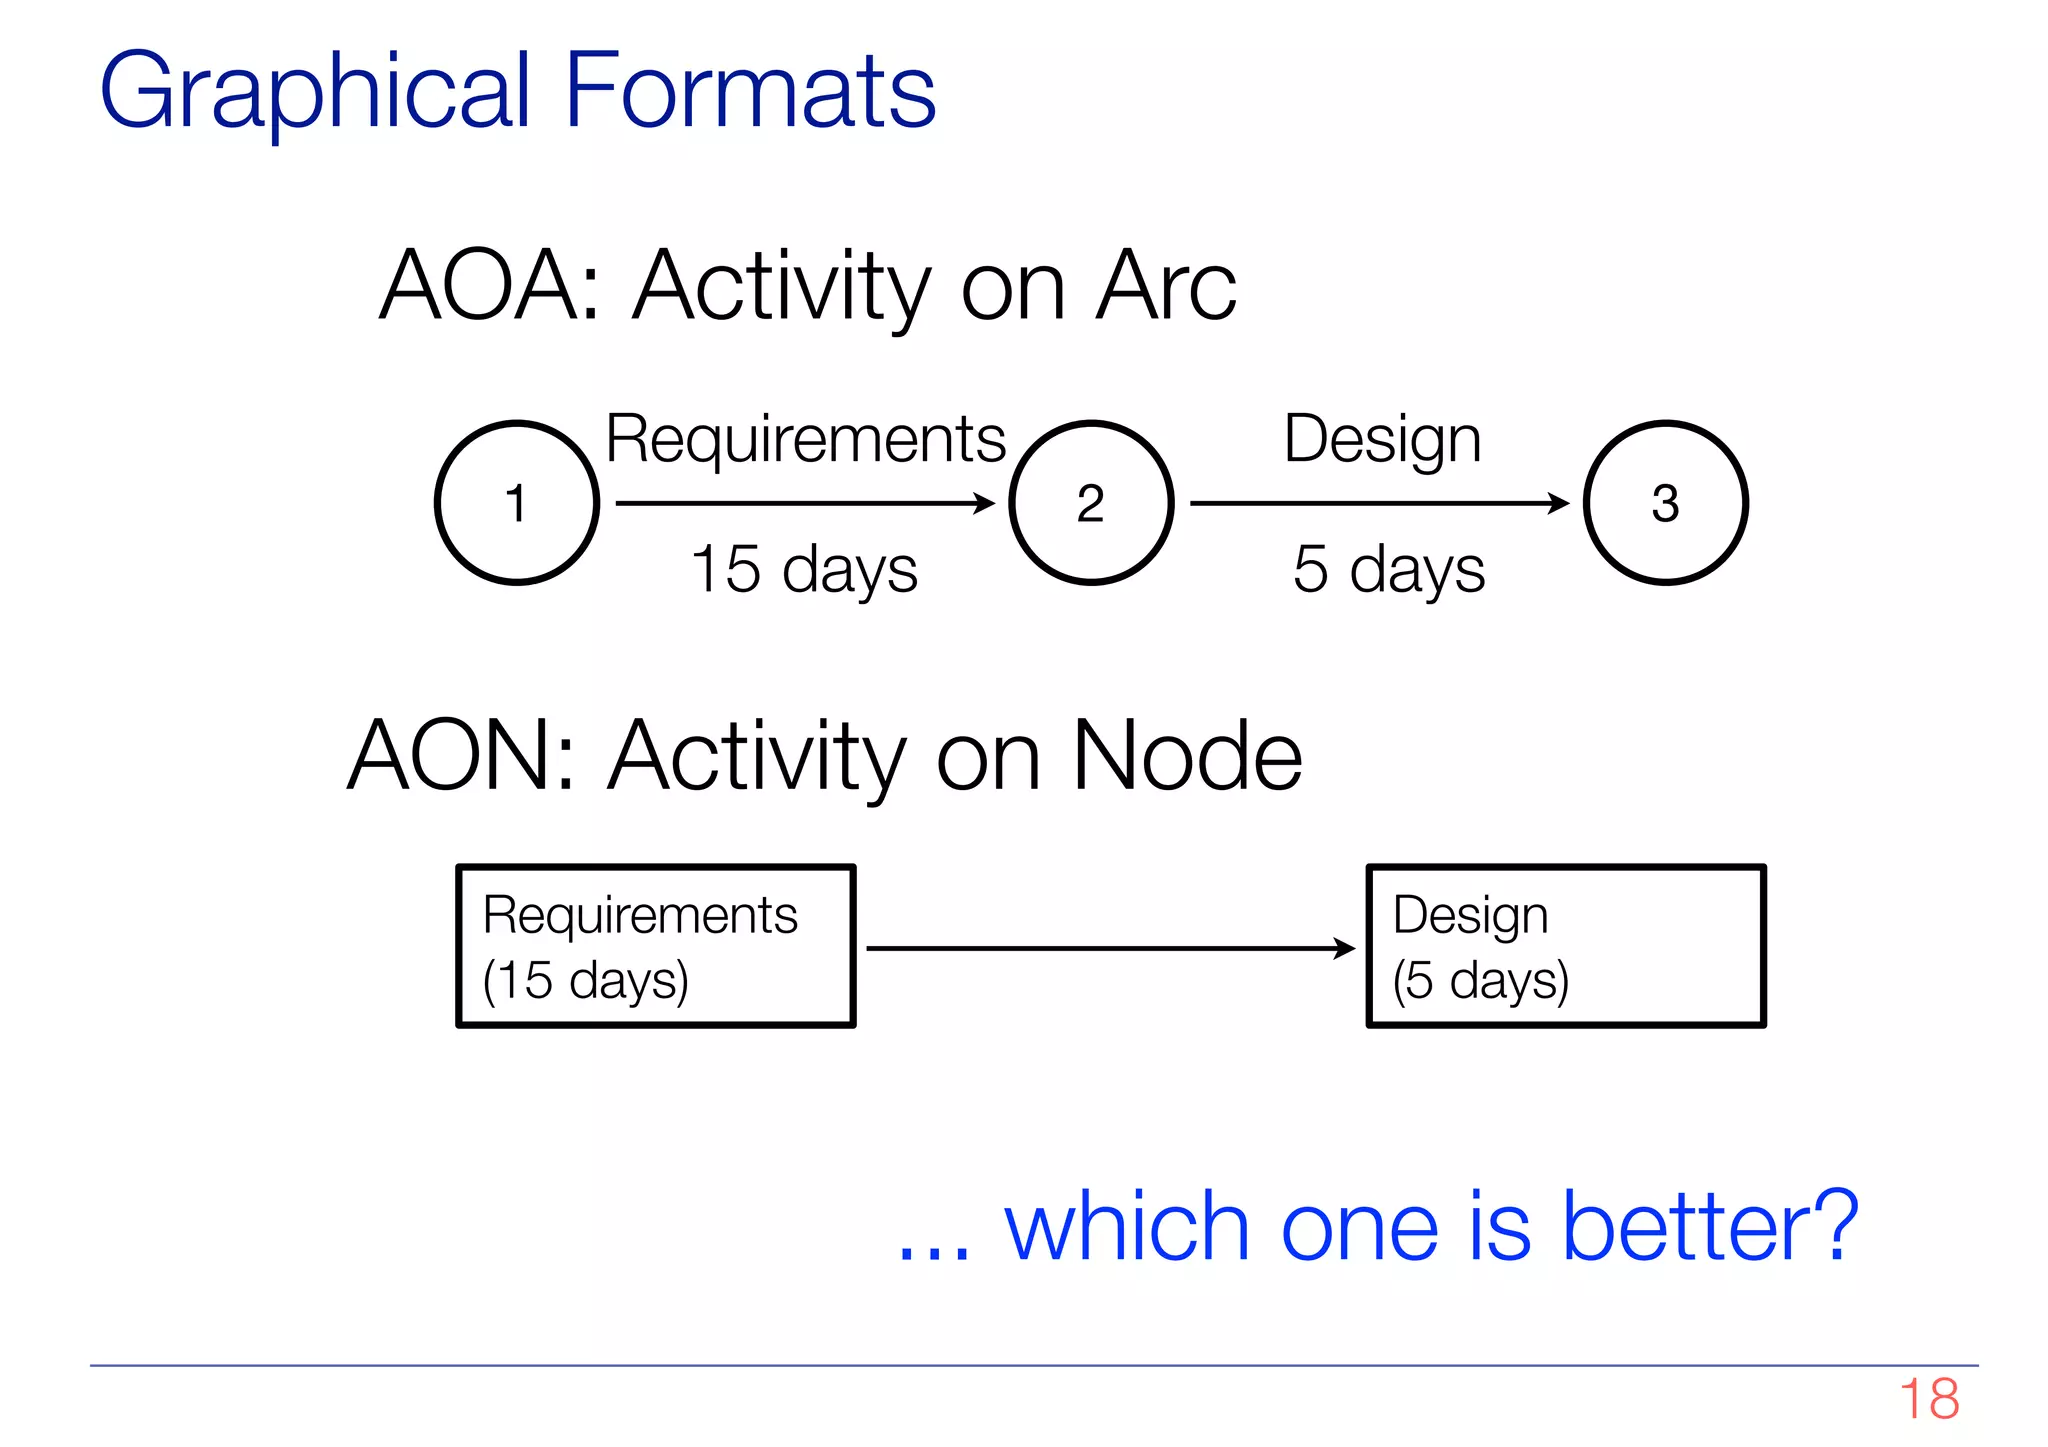
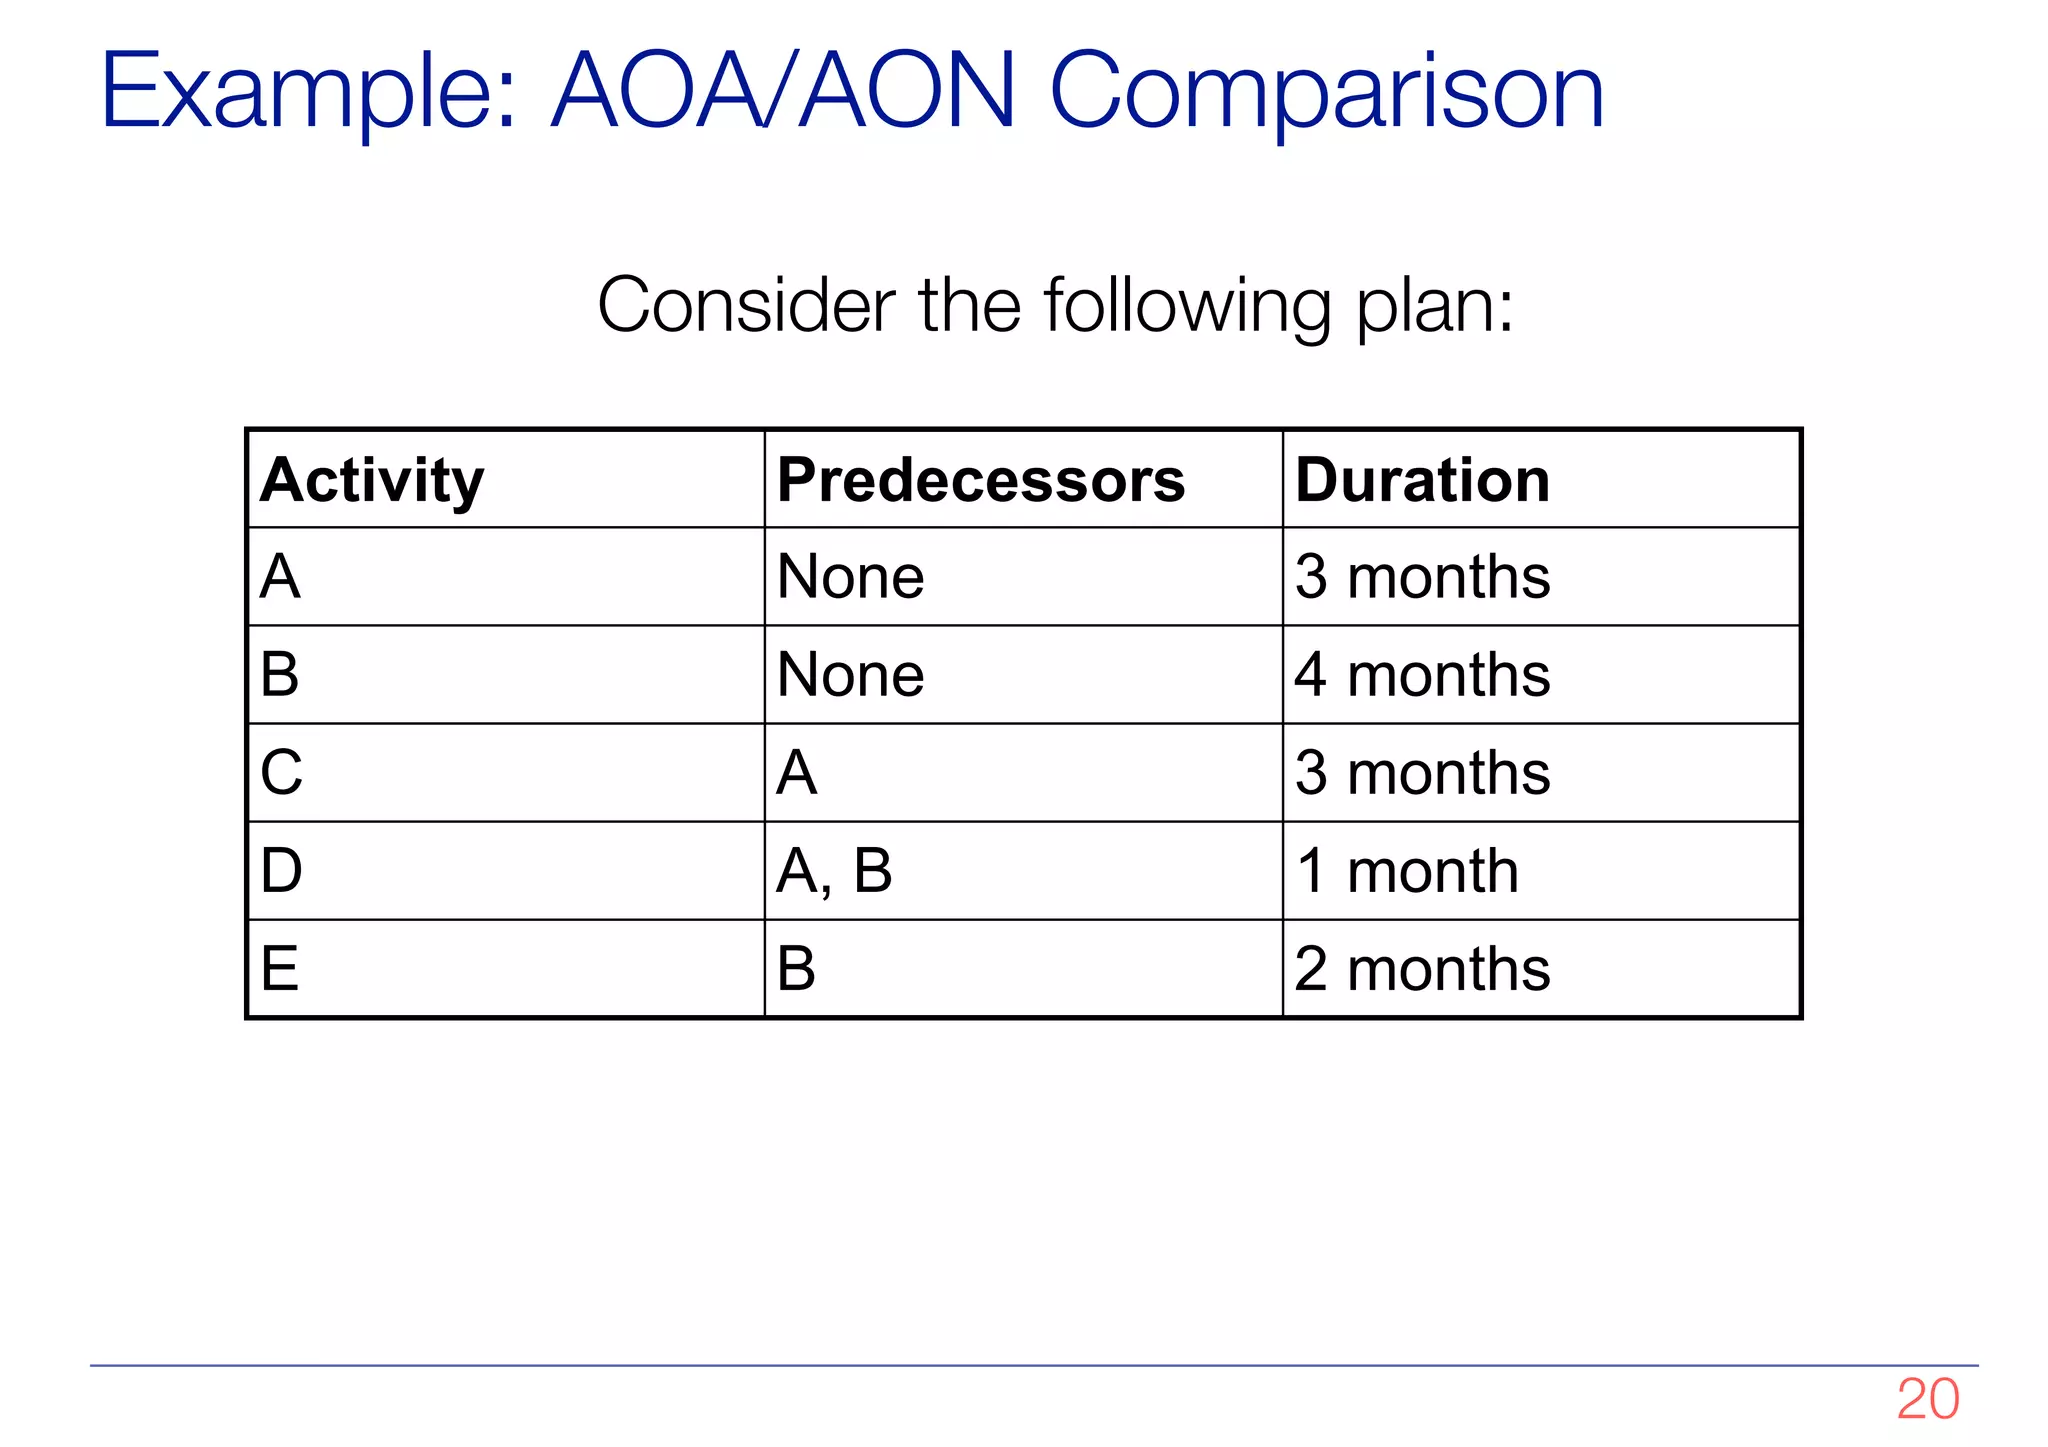
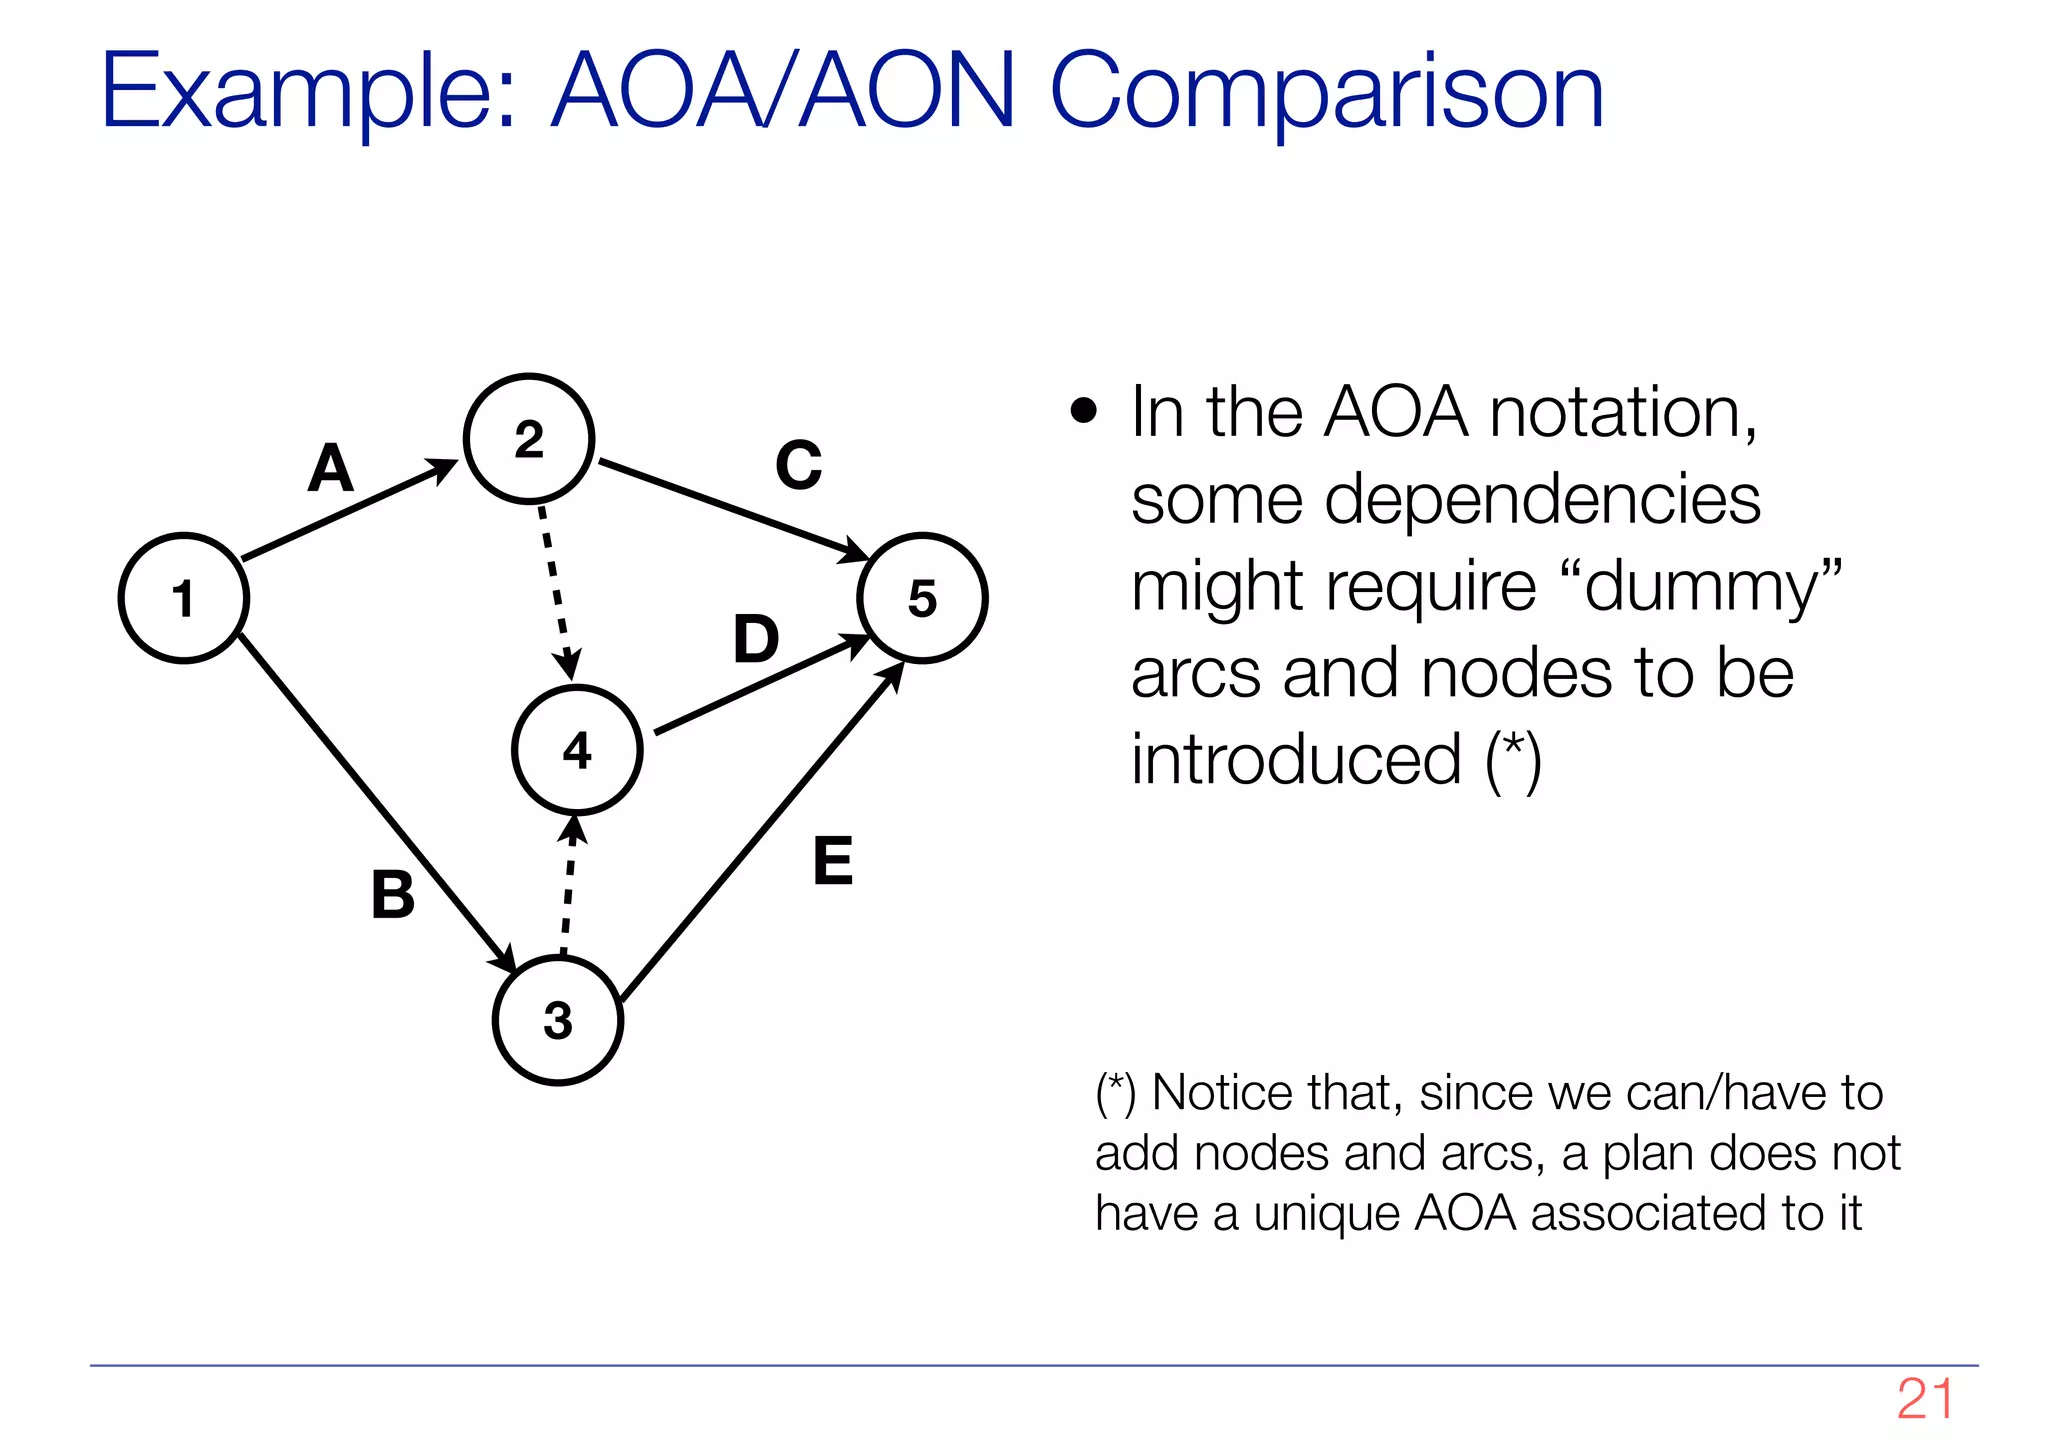
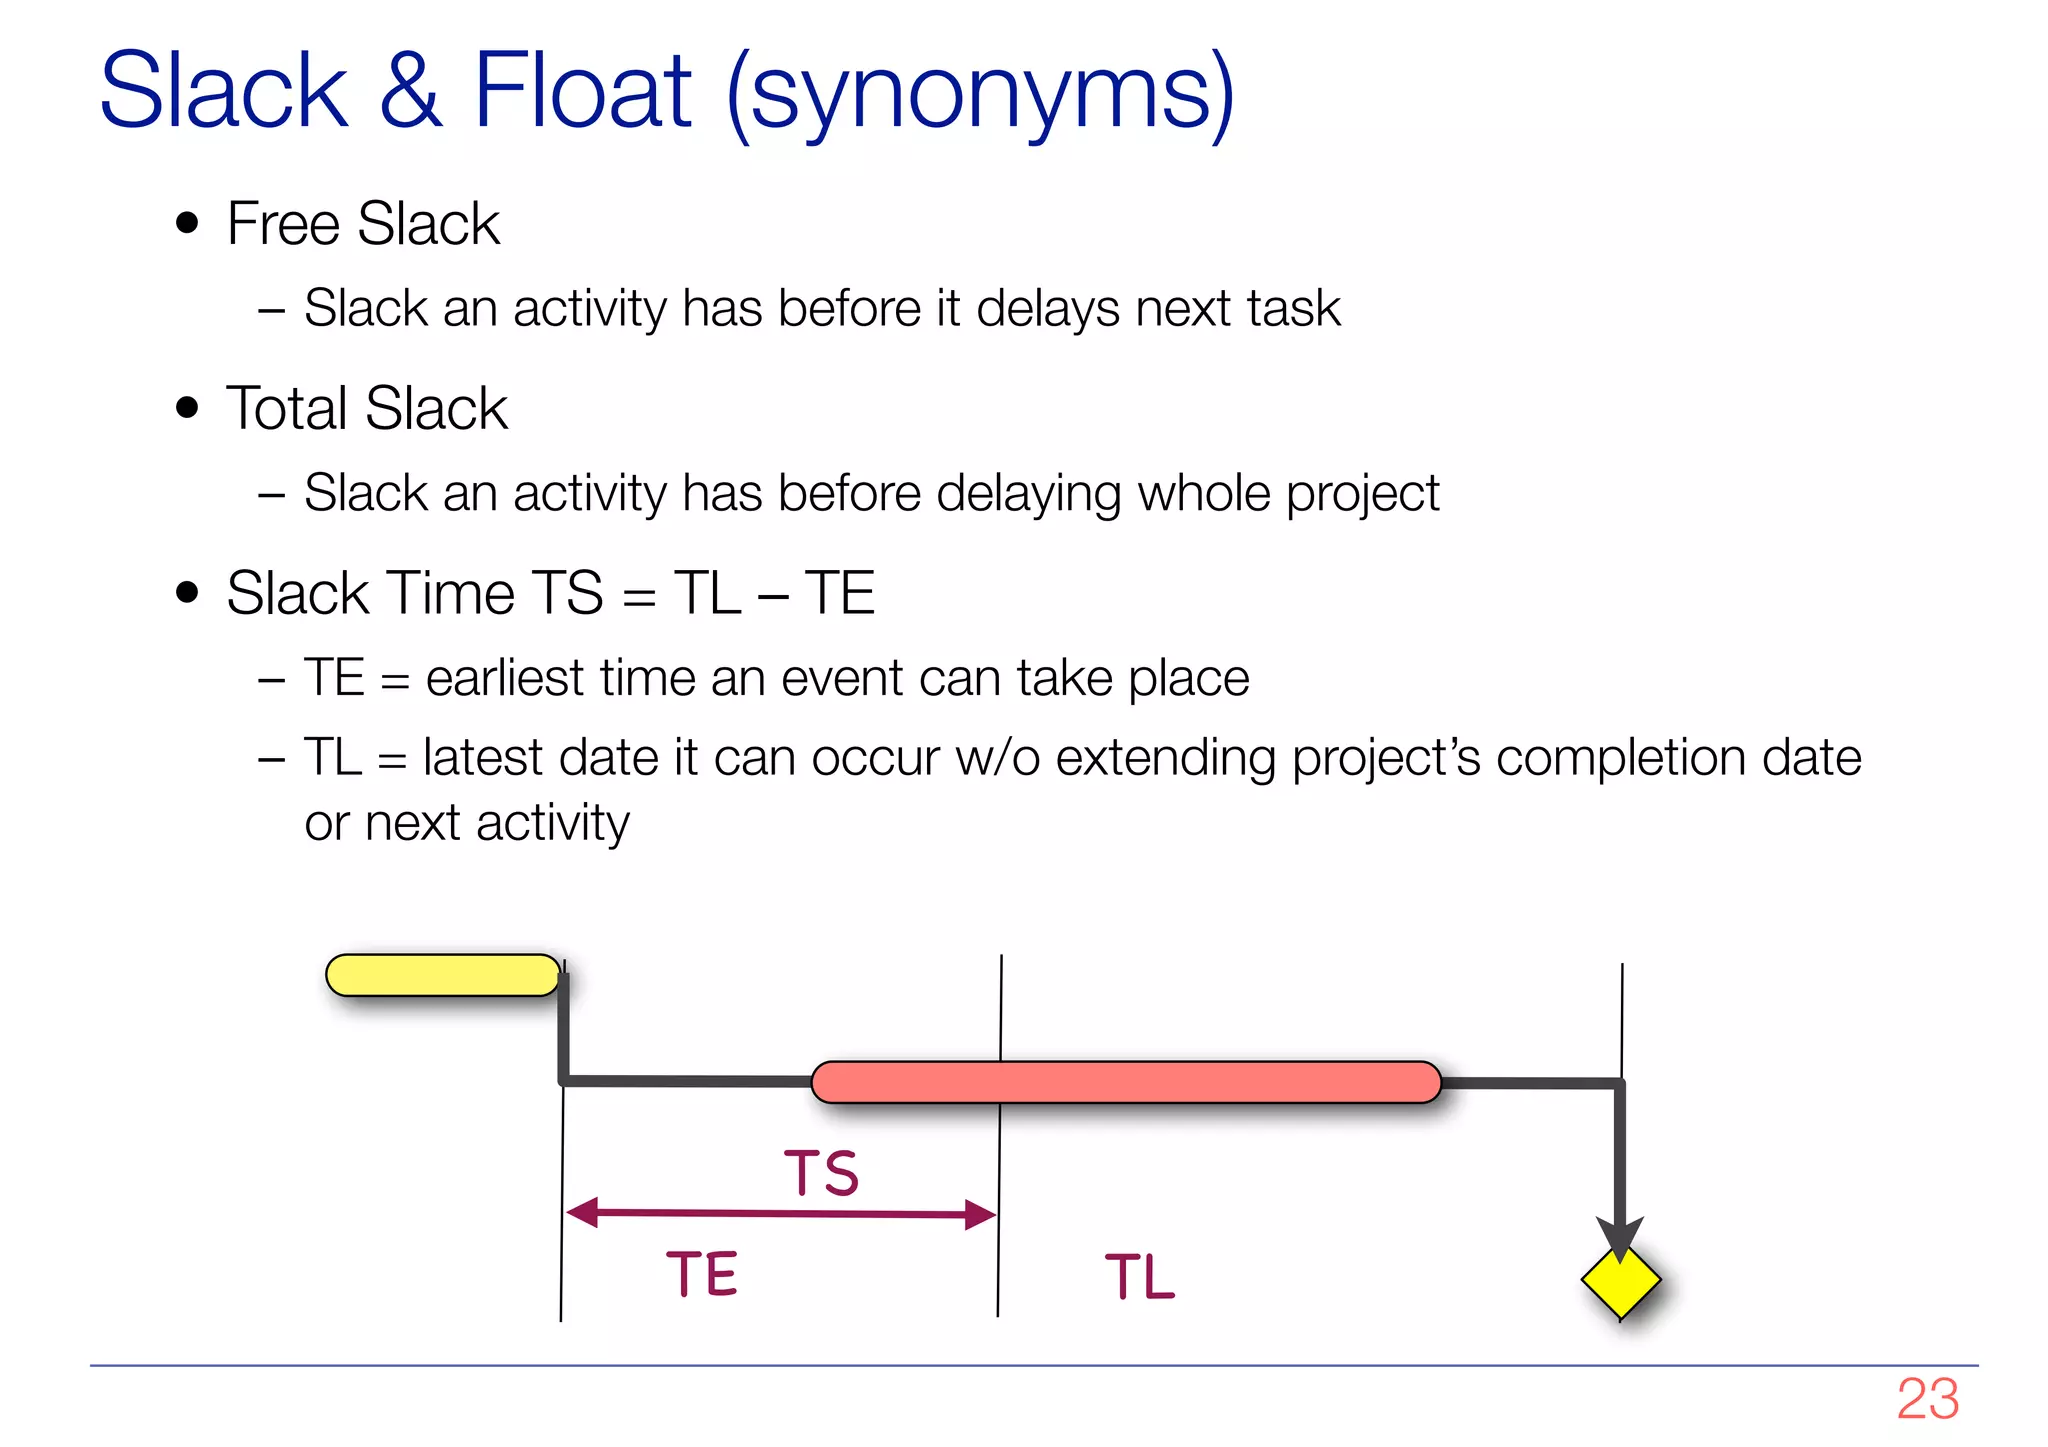
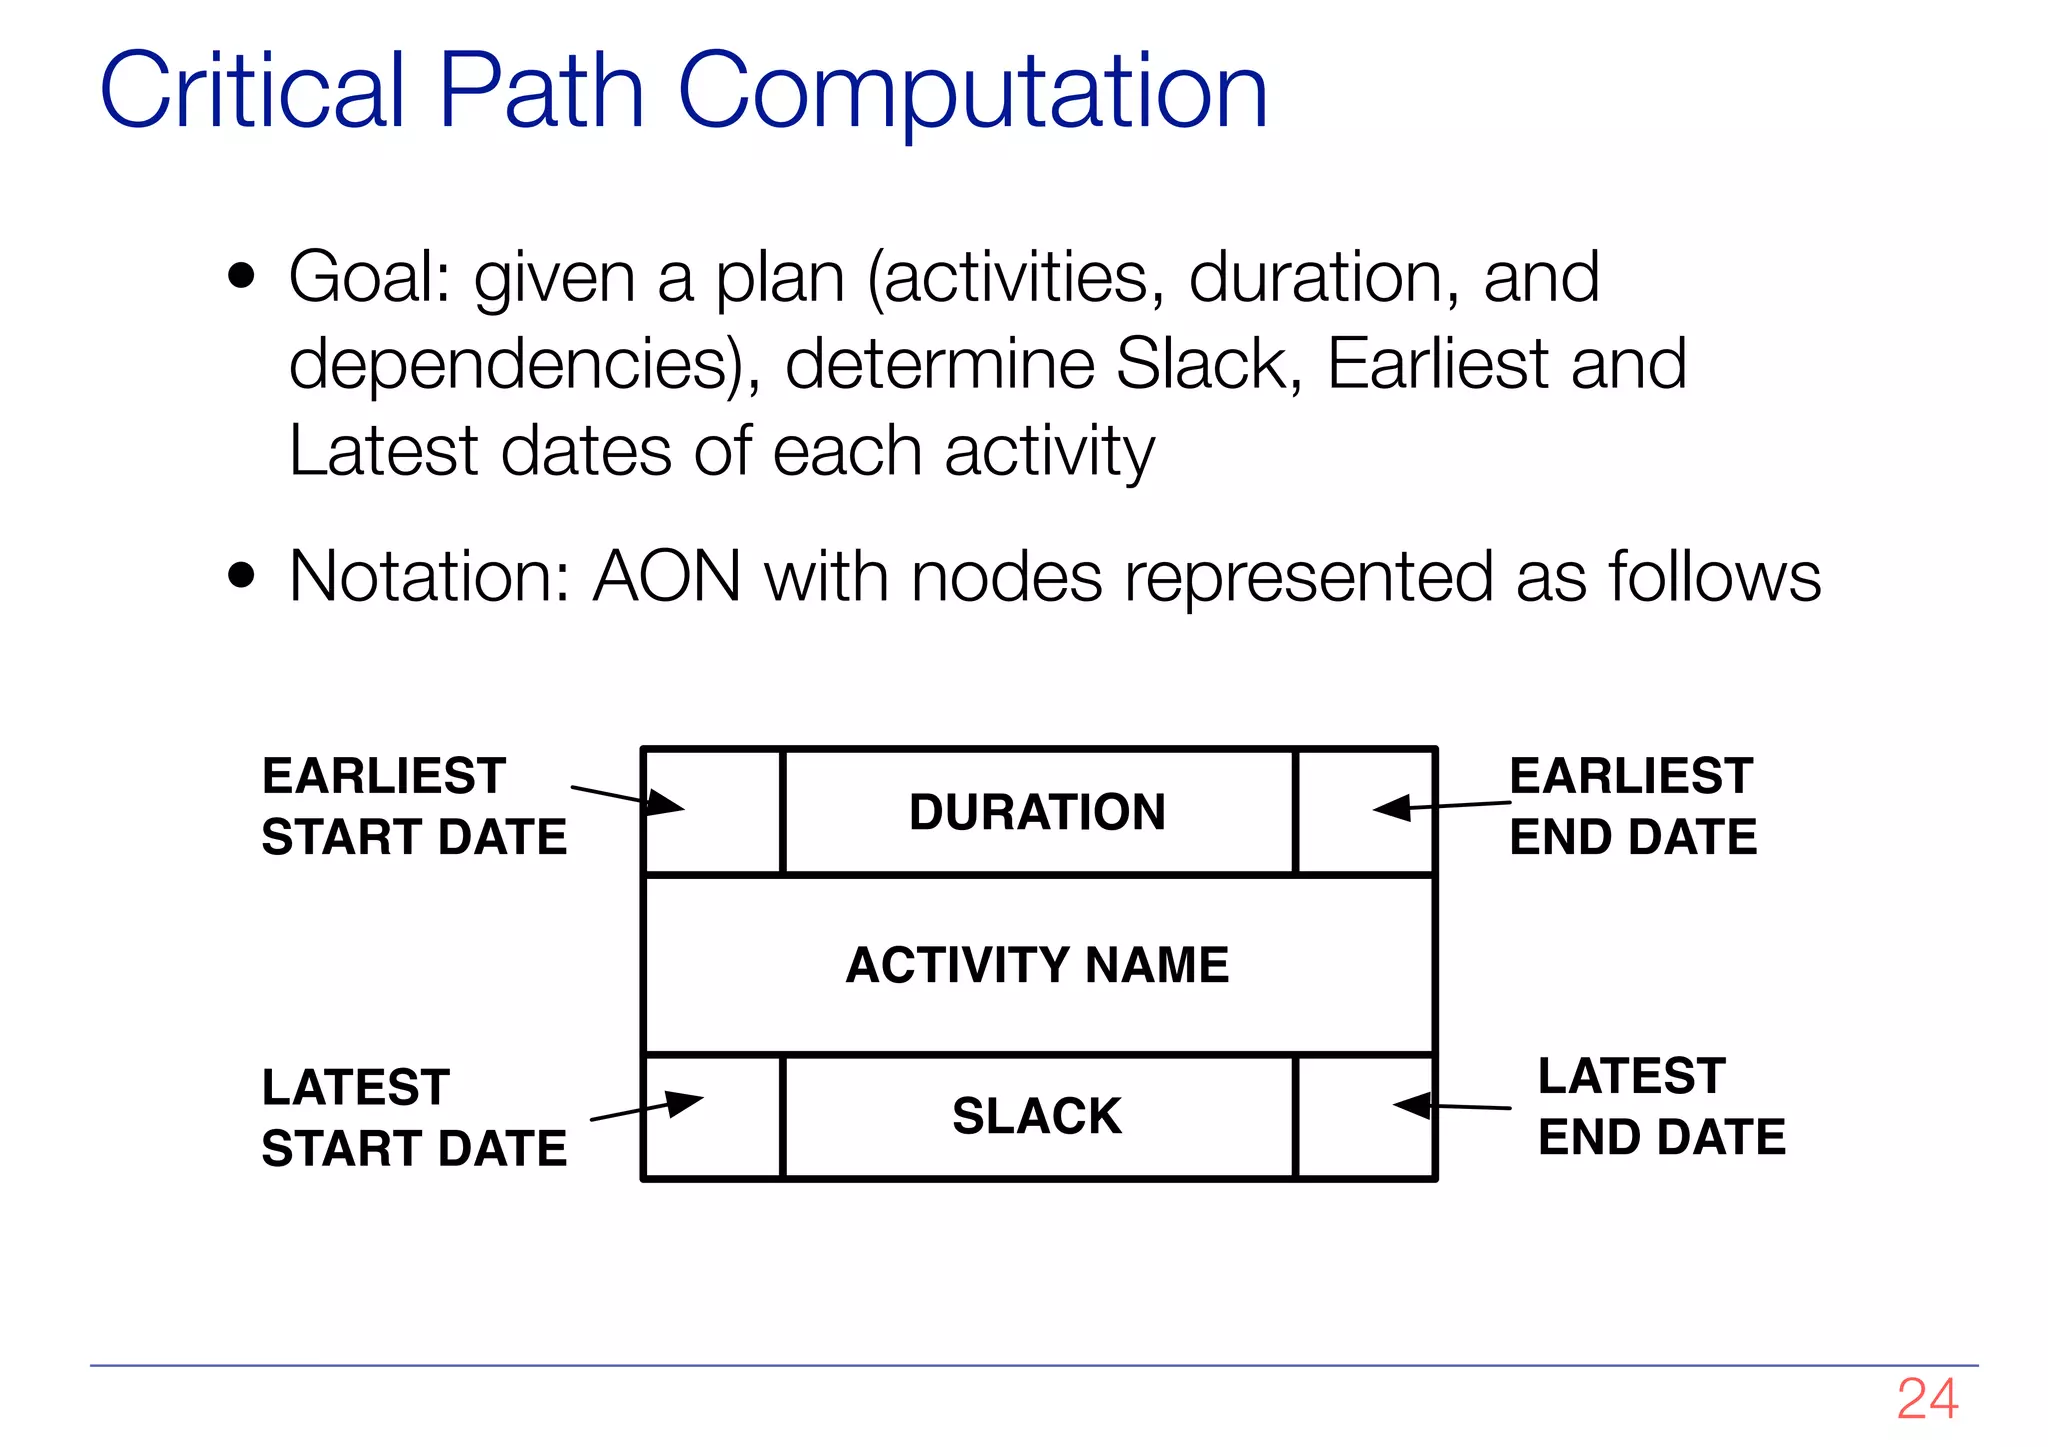
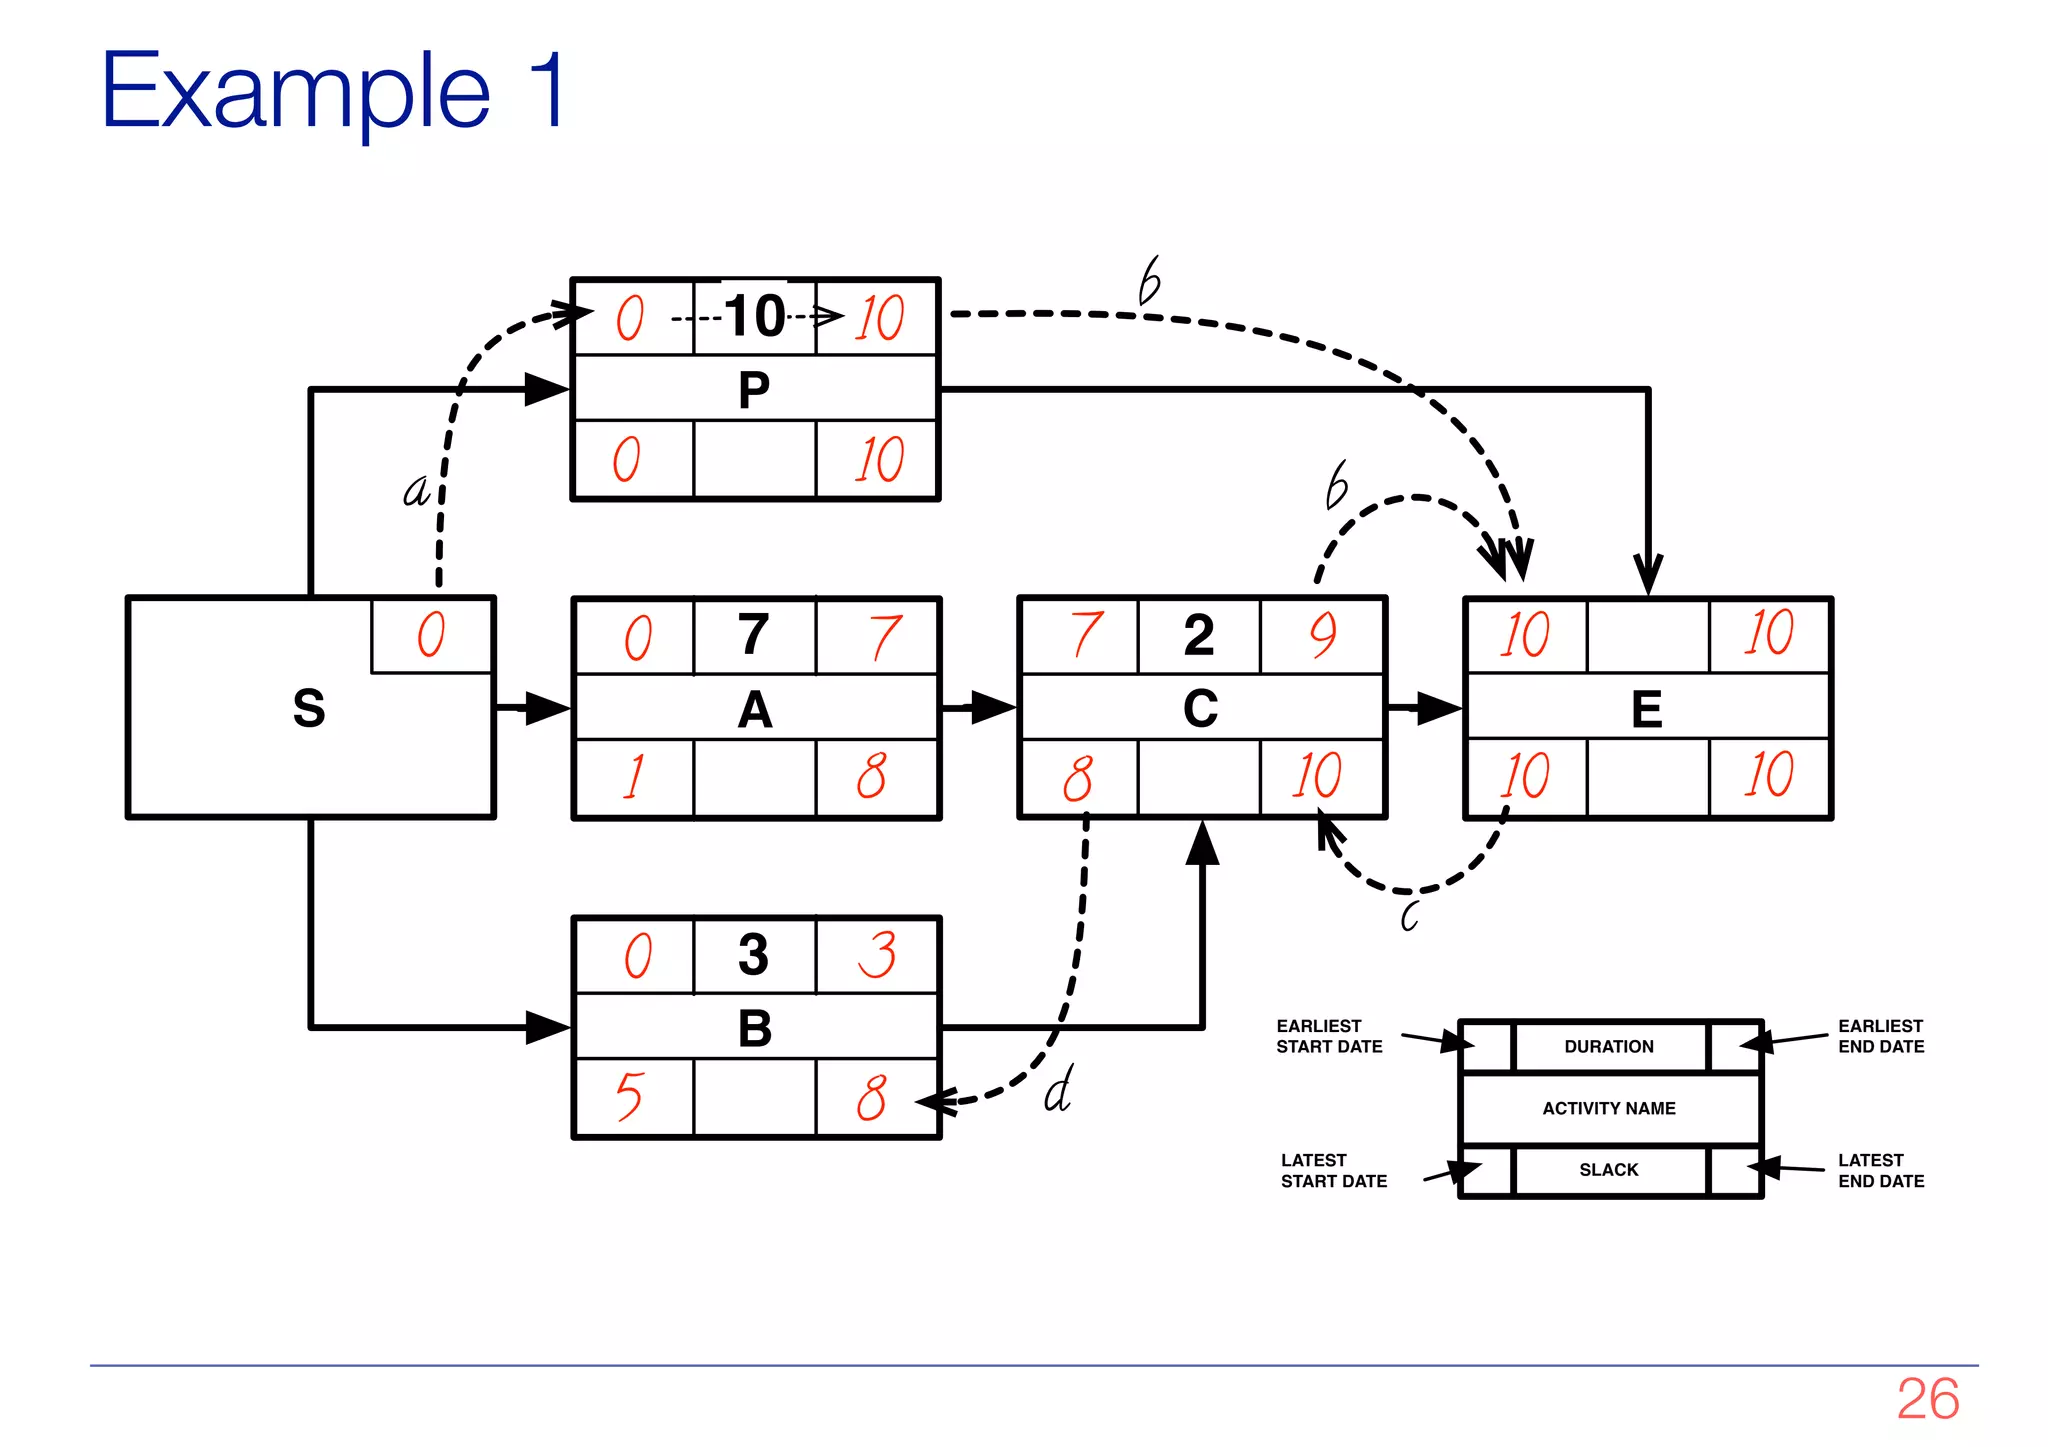
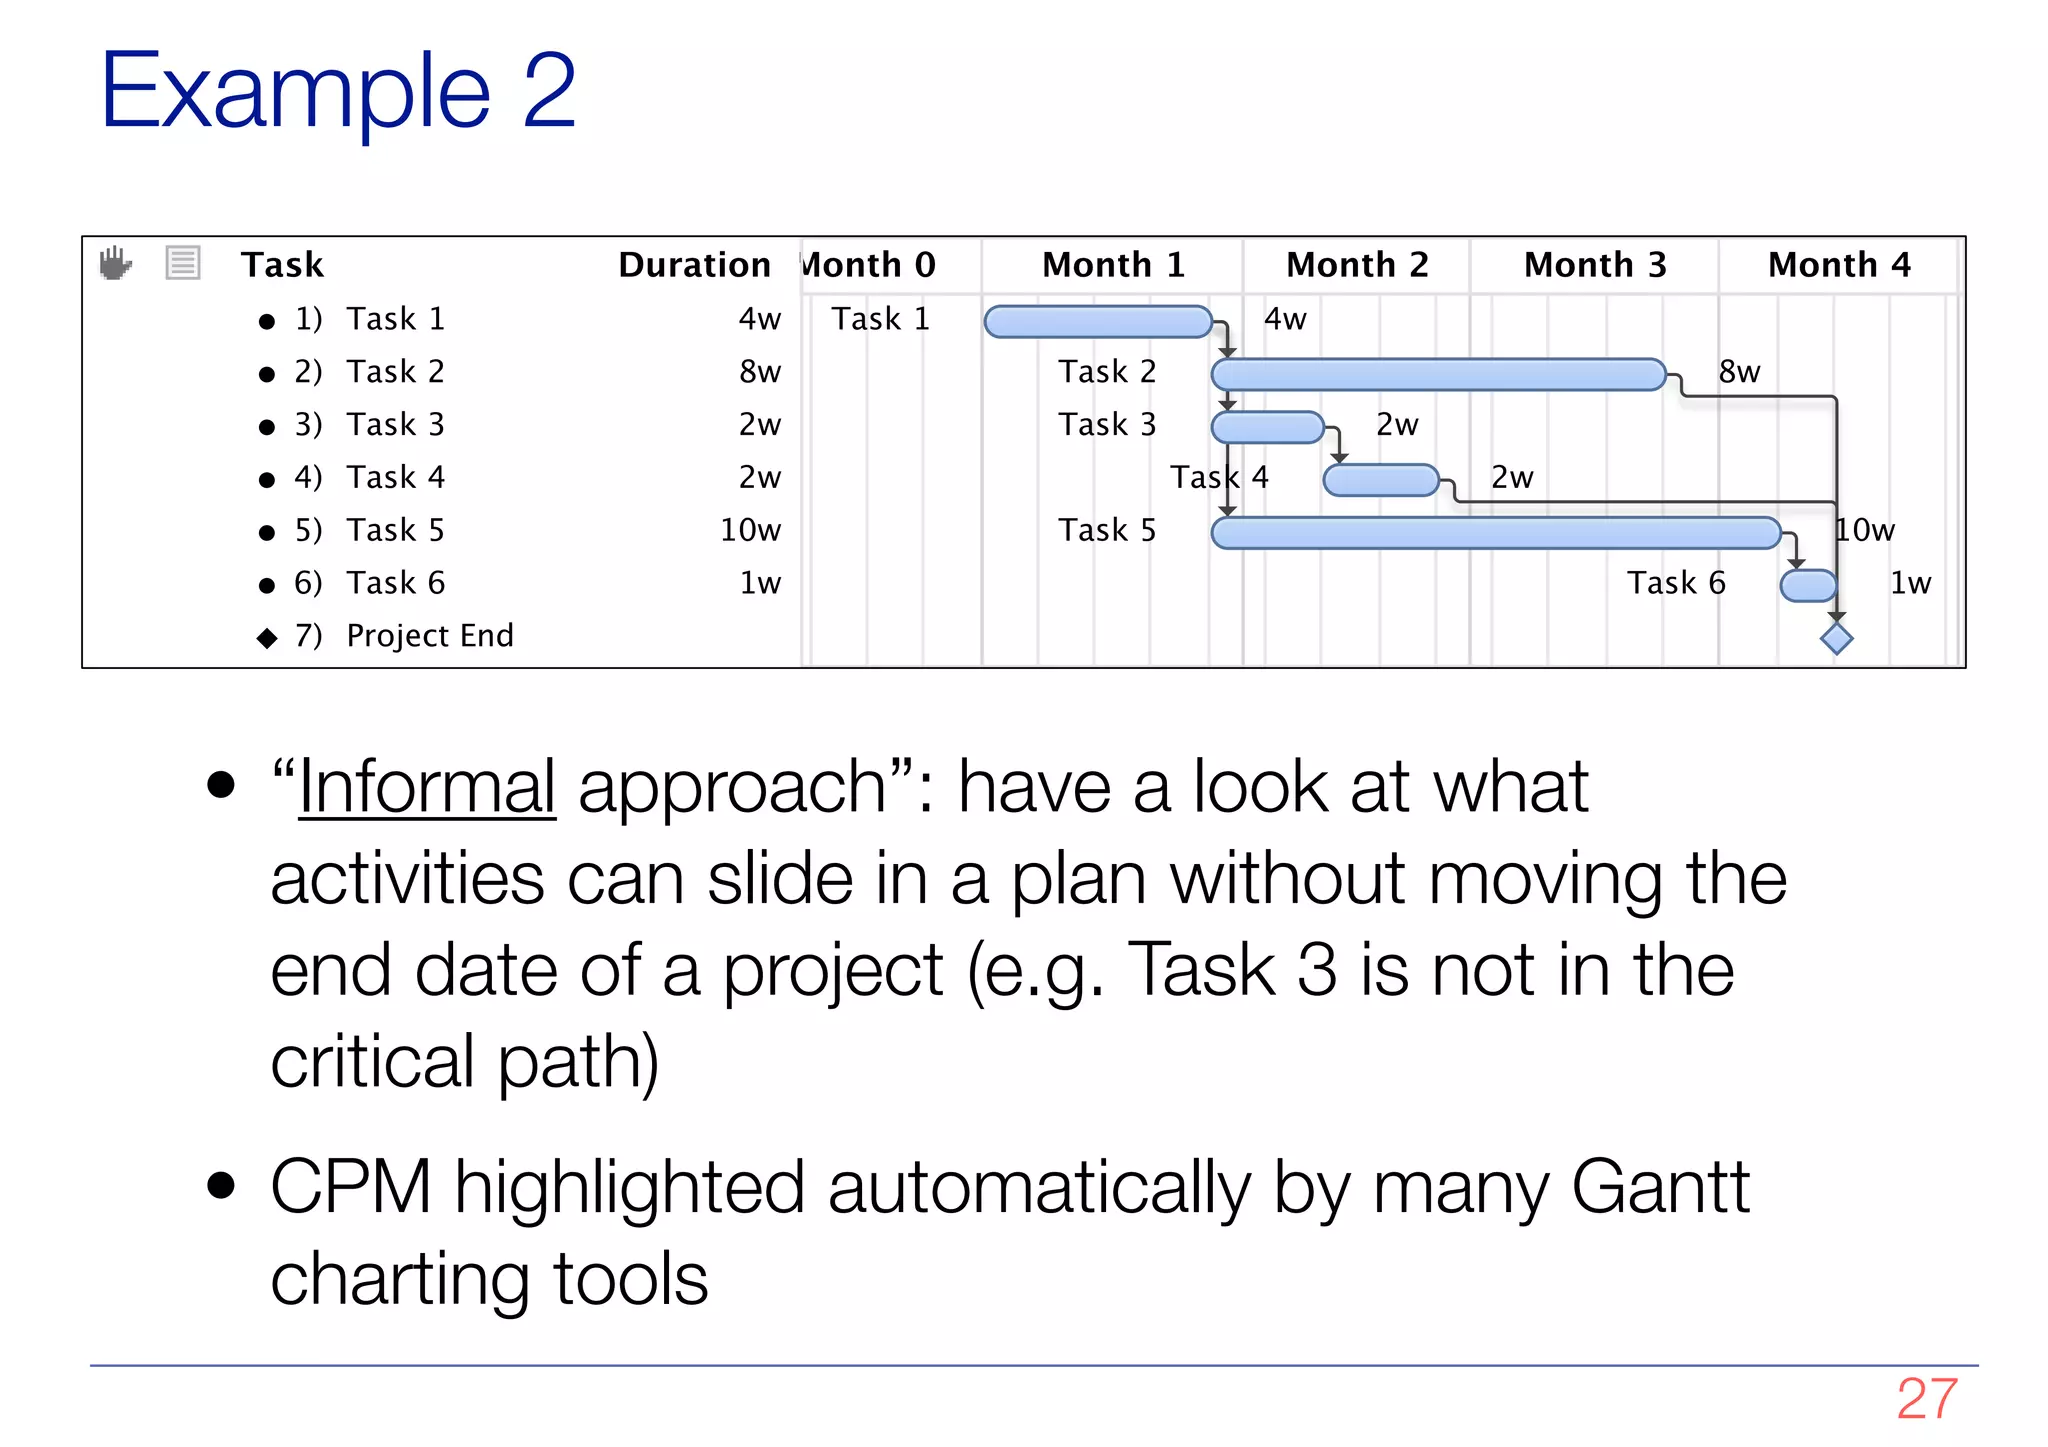
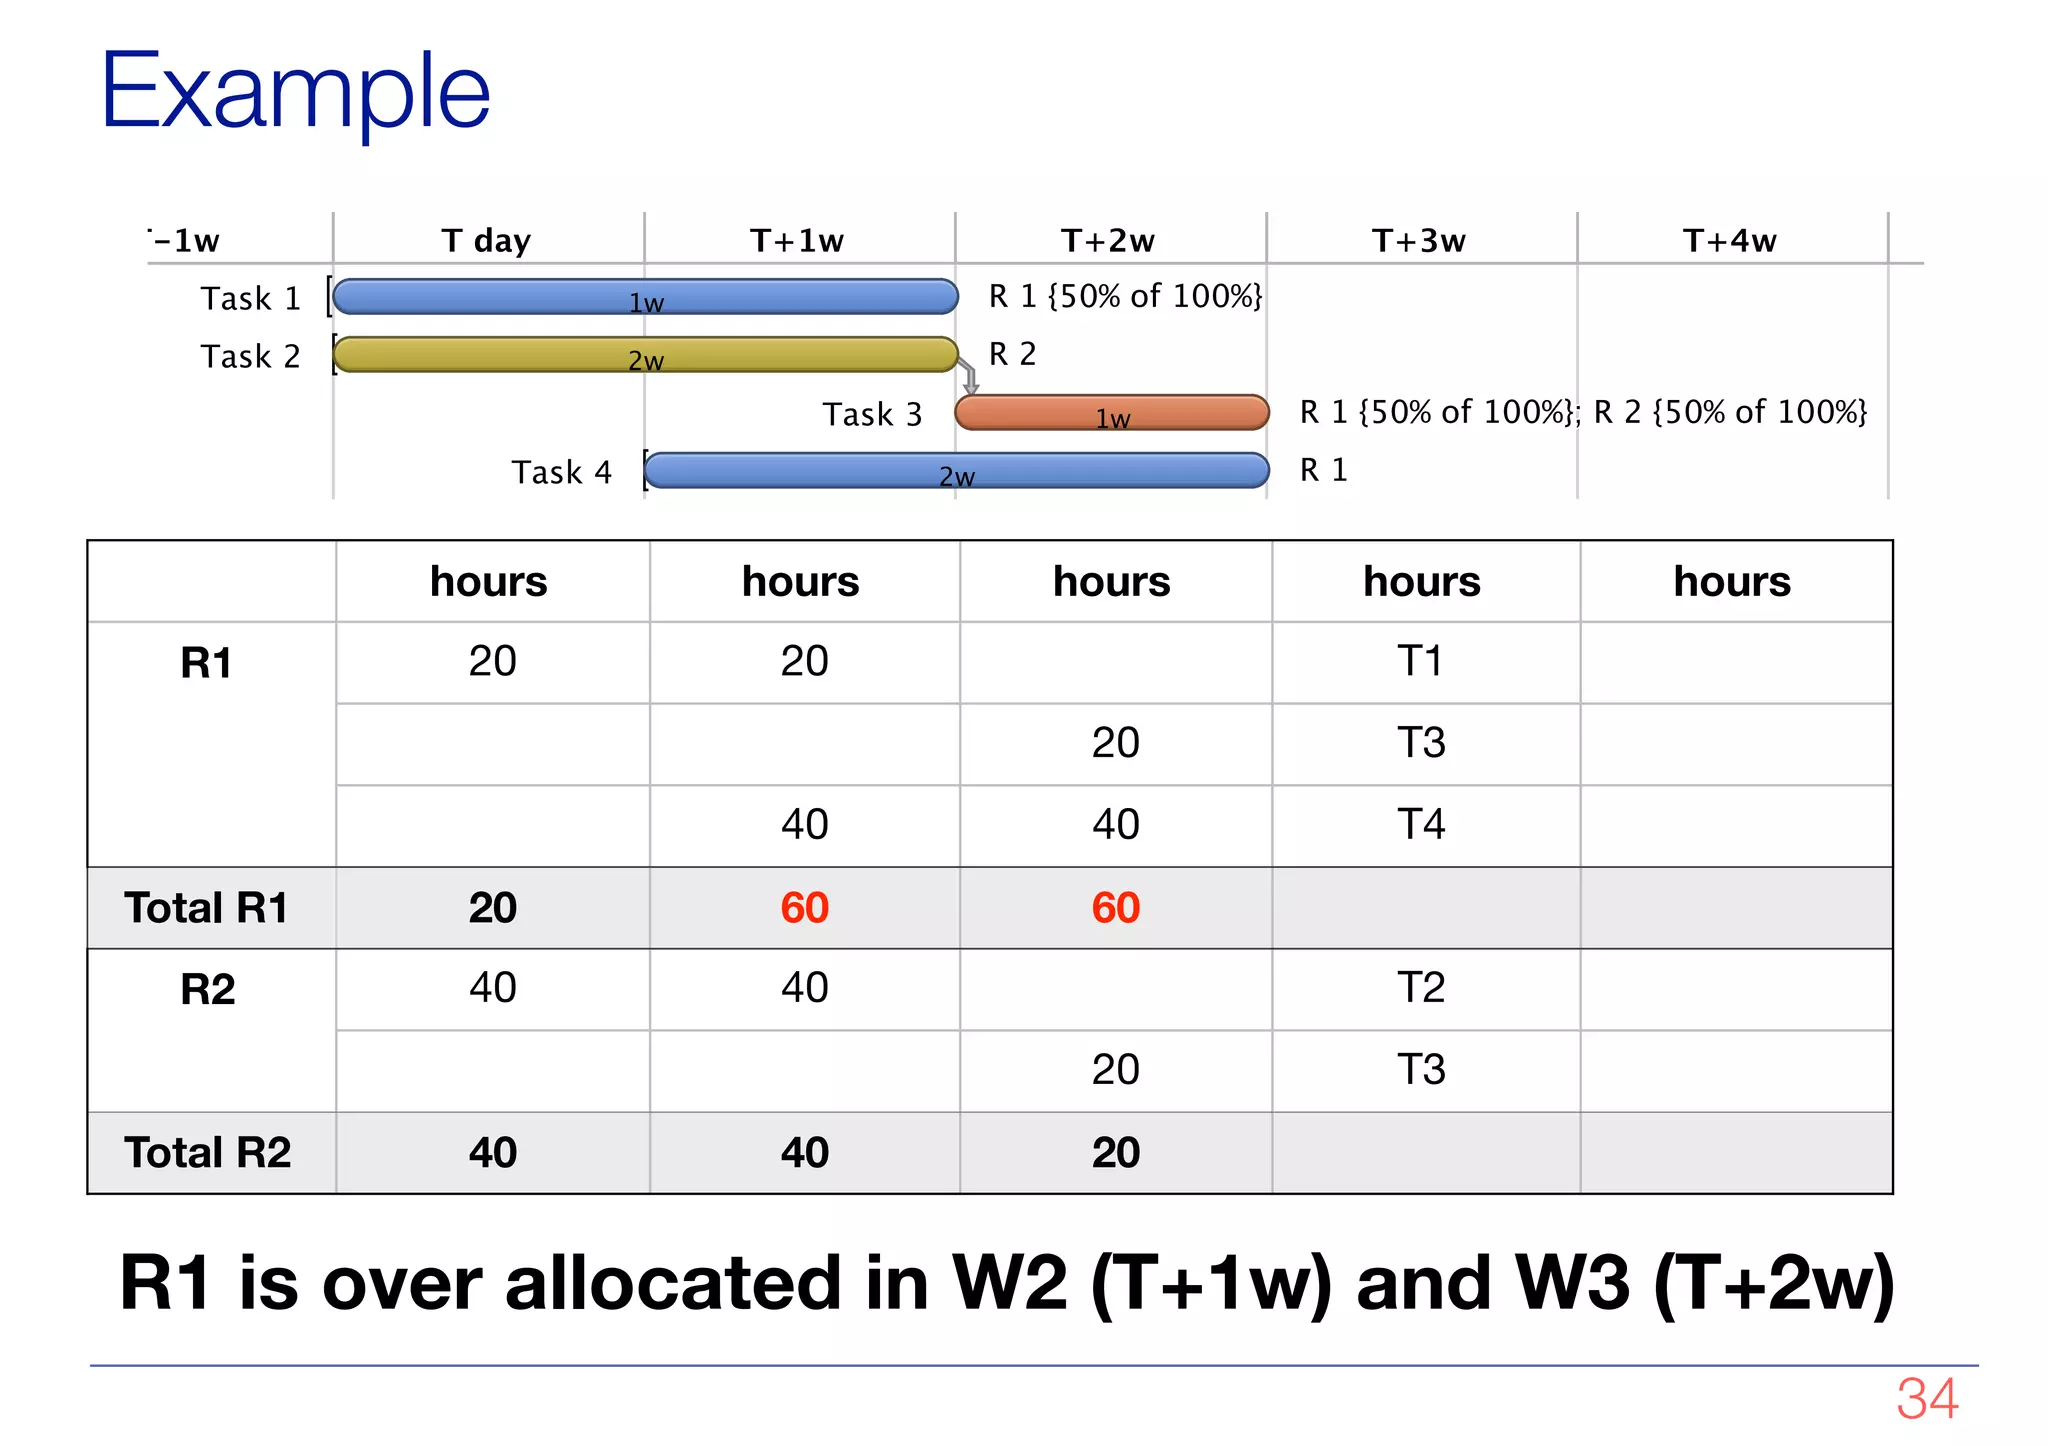
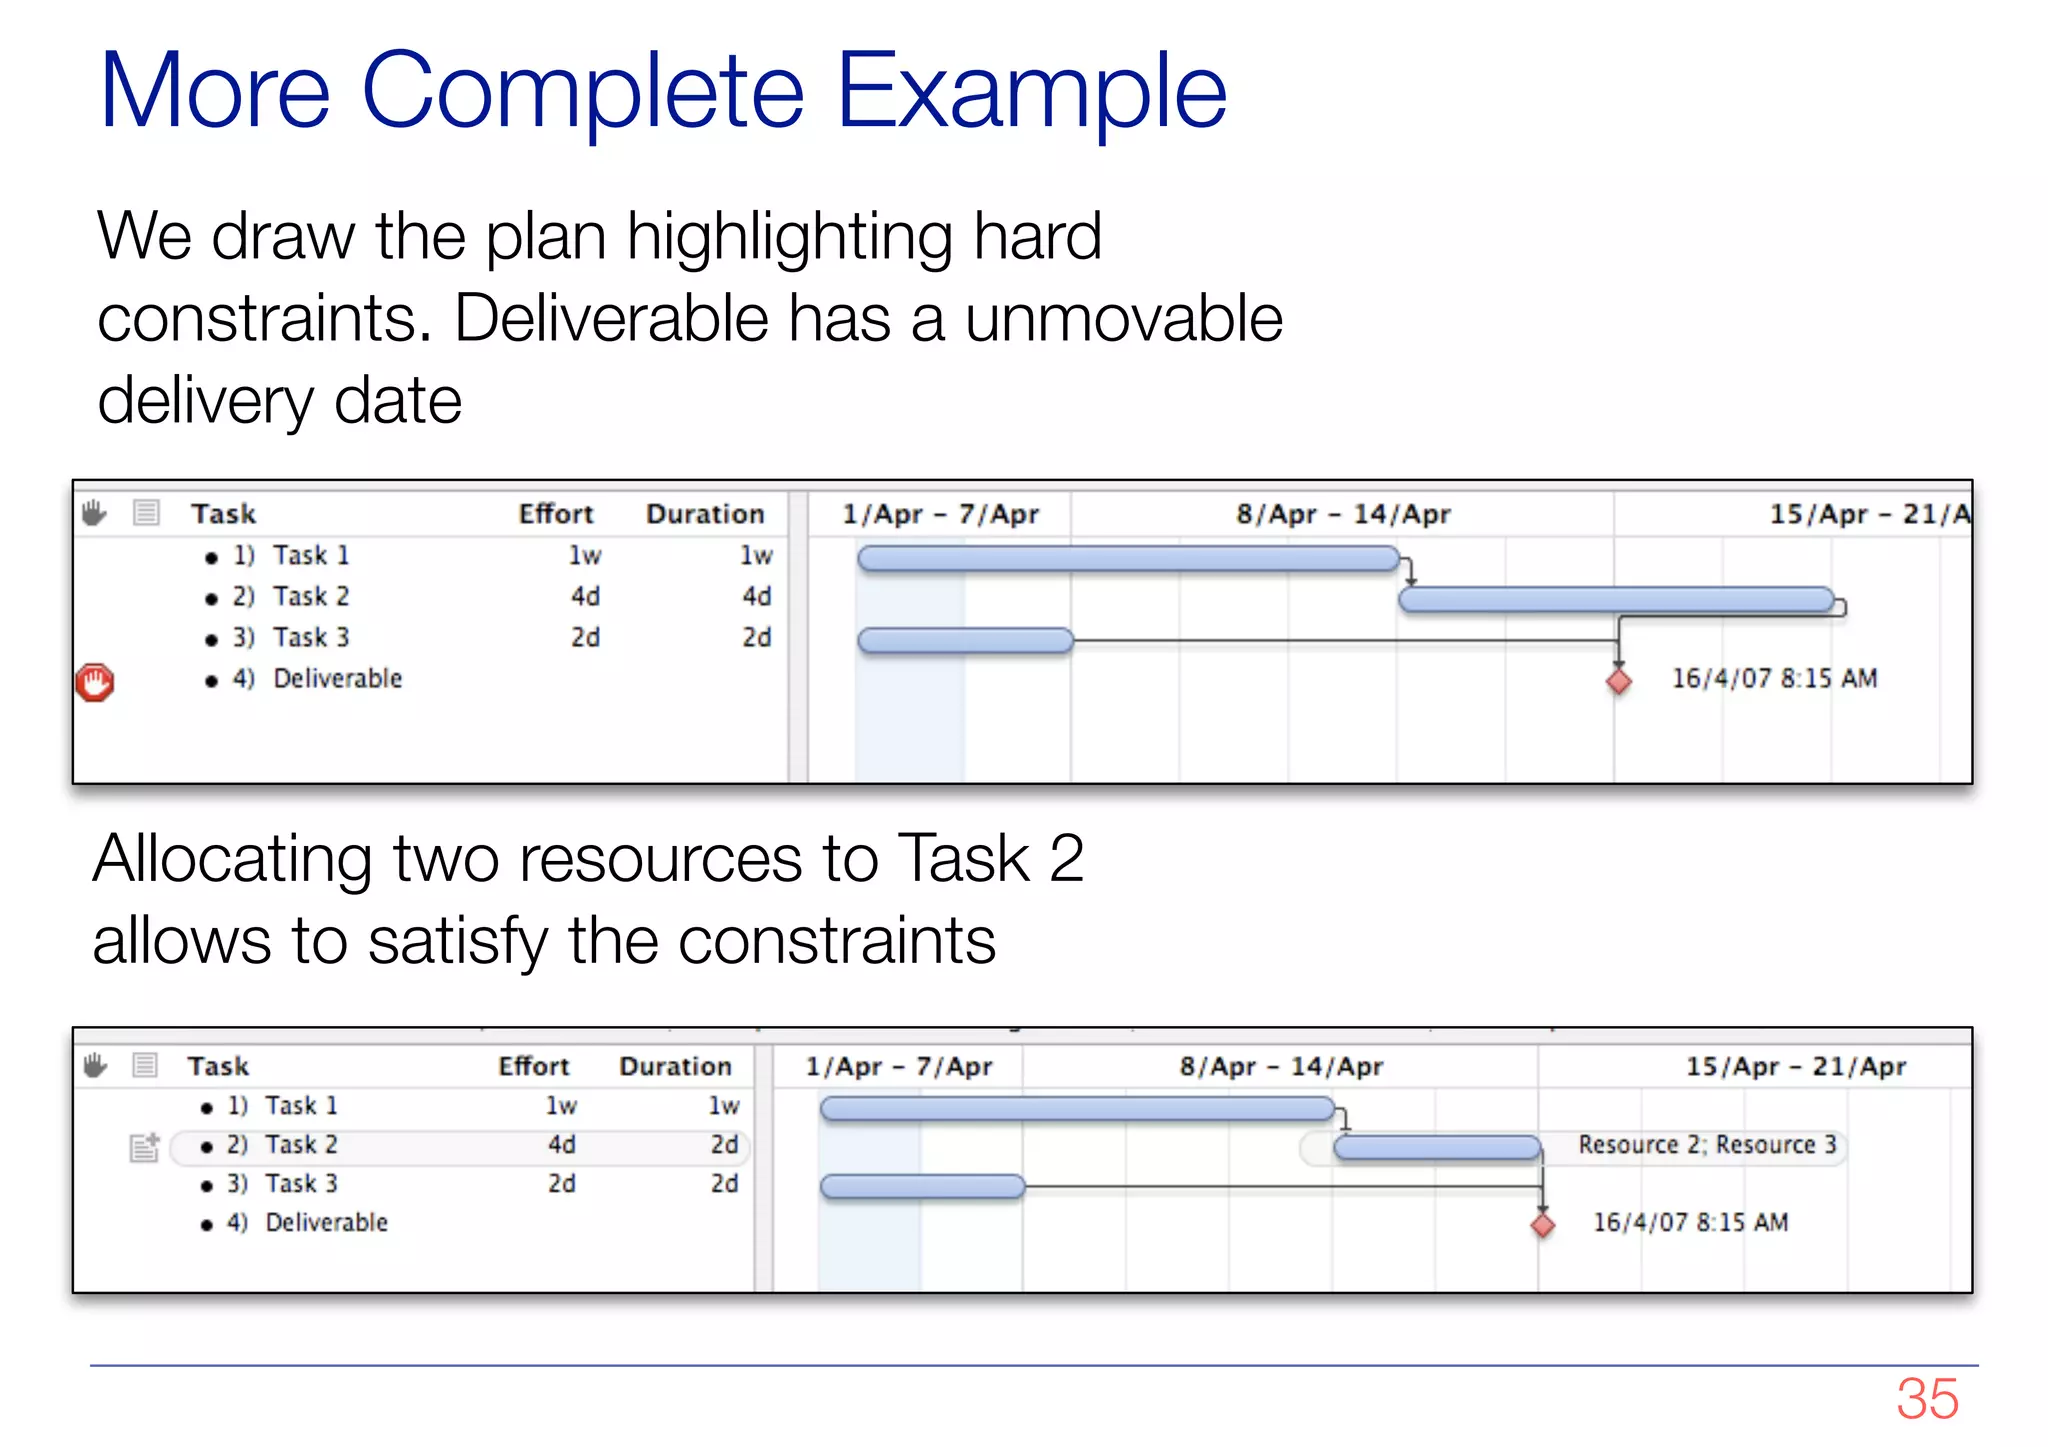
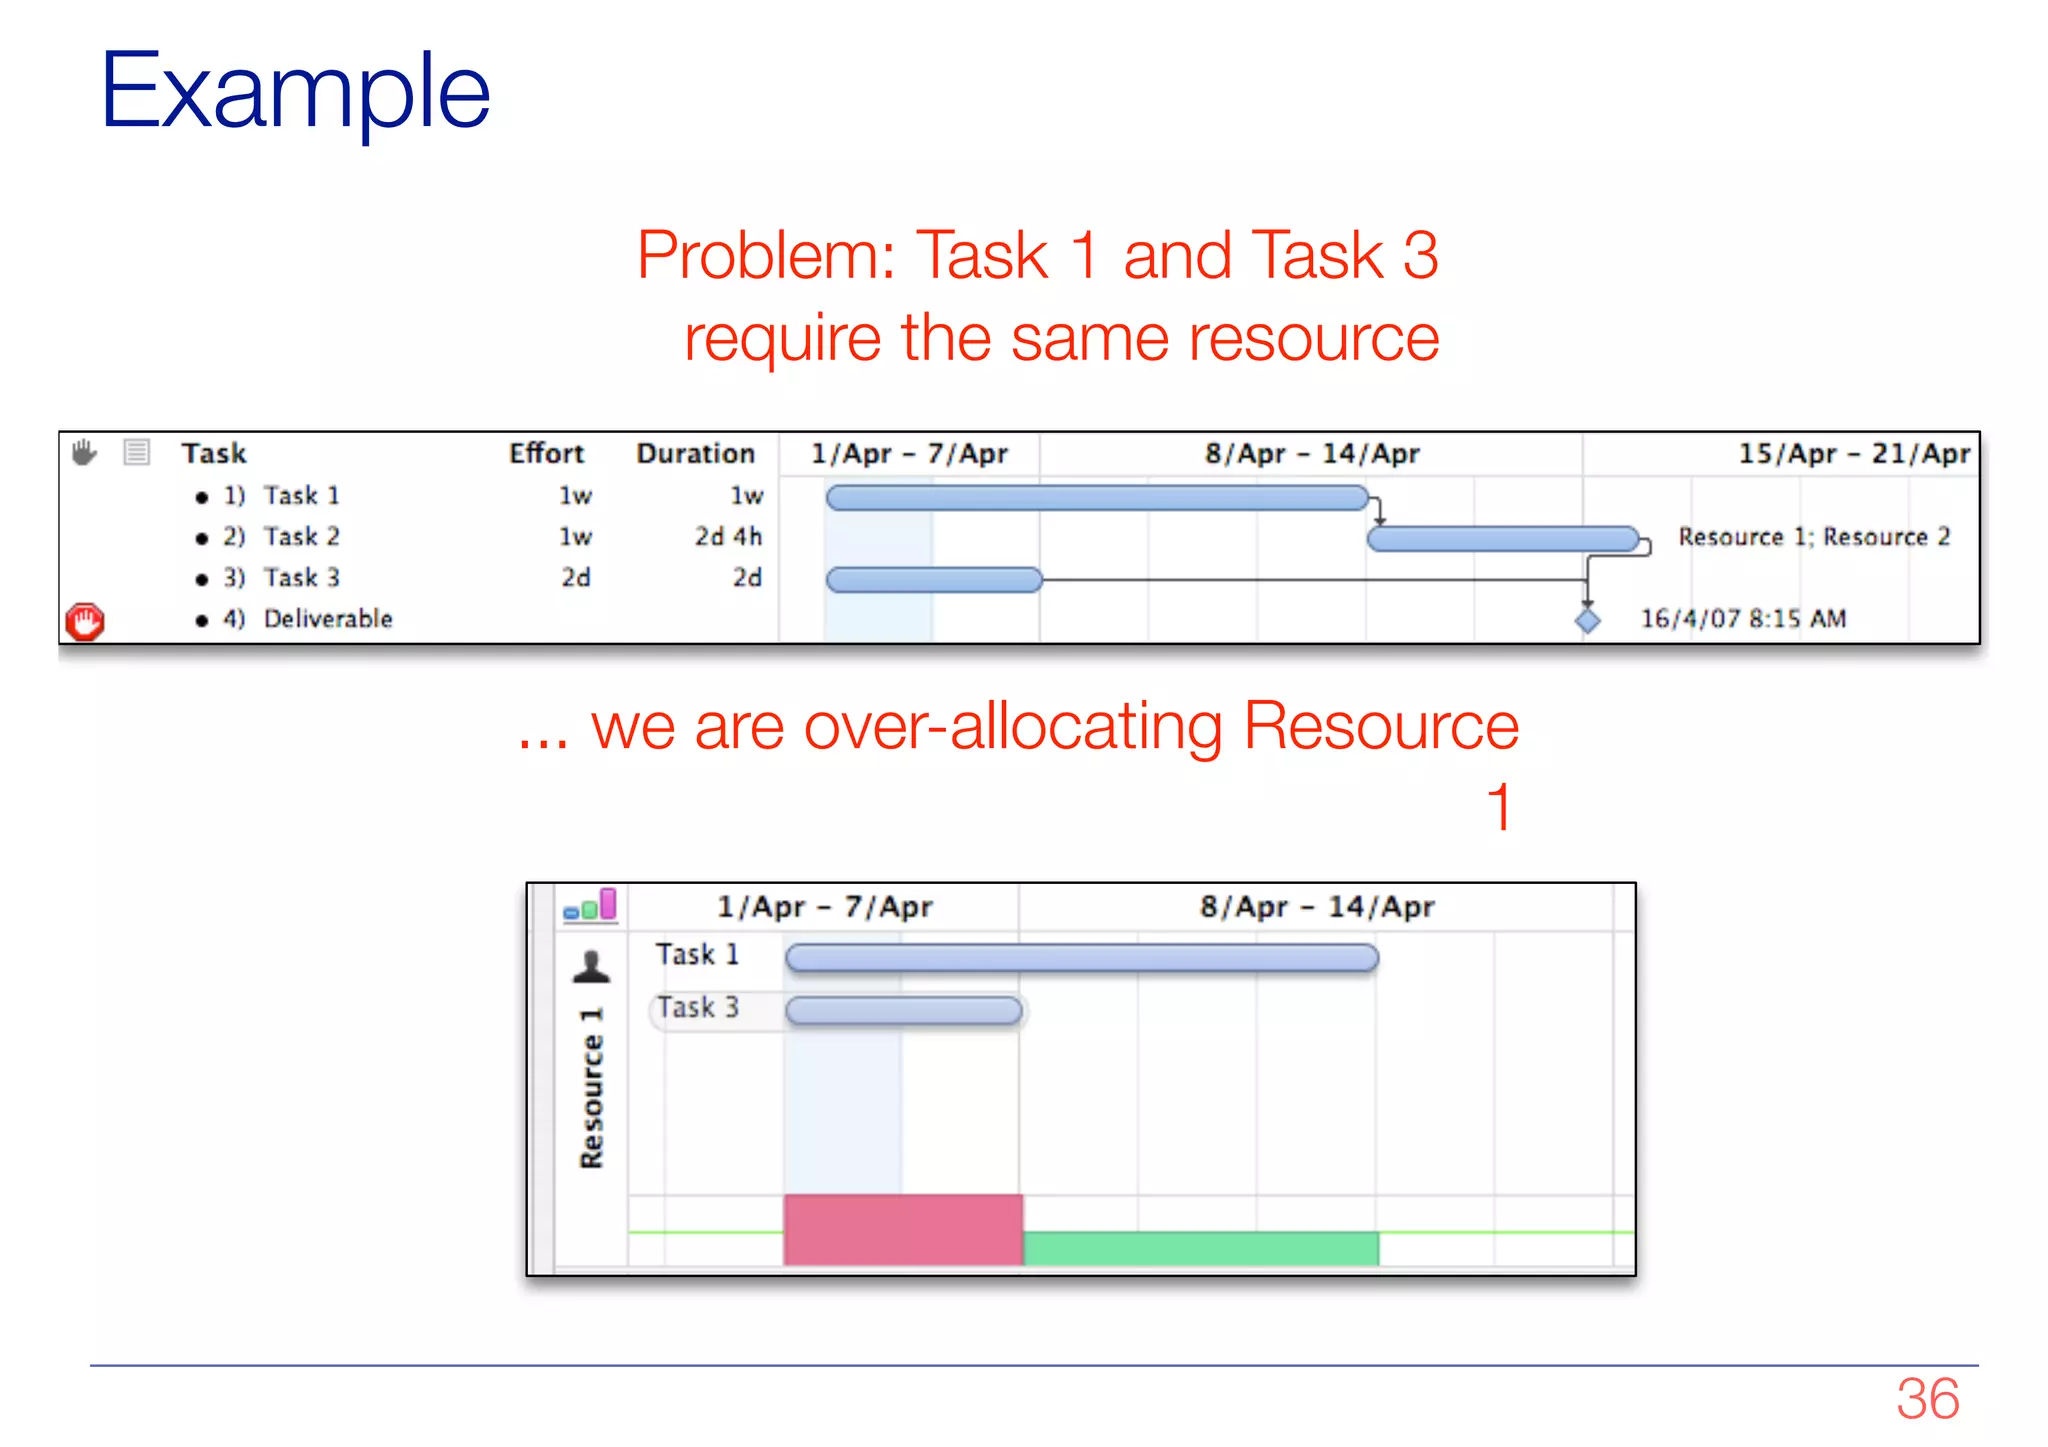
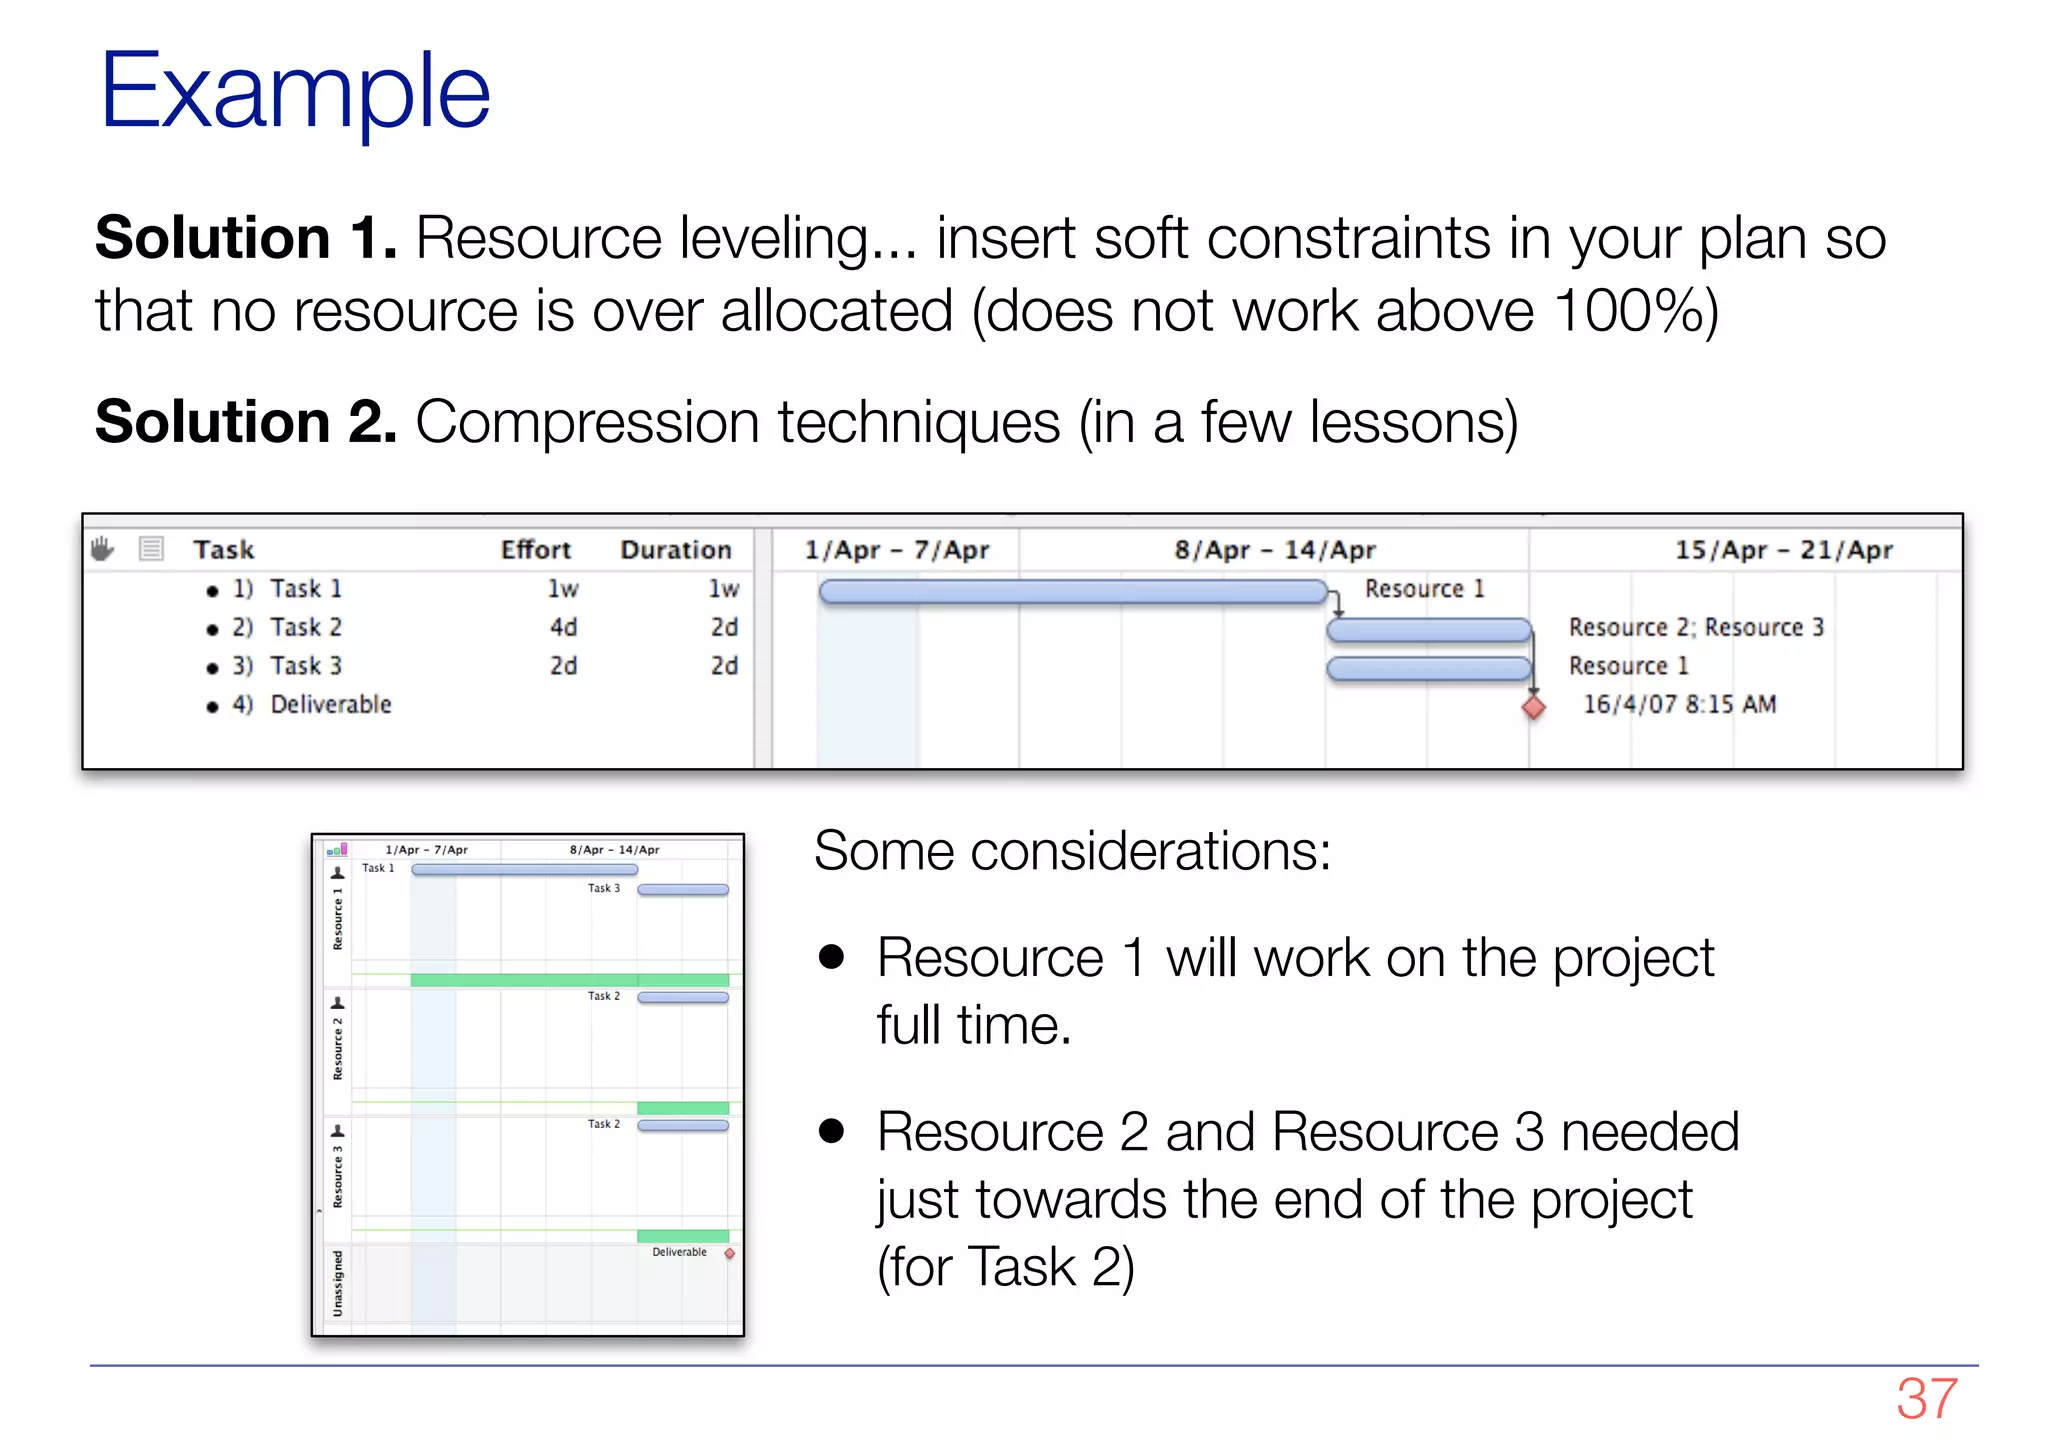
The document discusses project scheduling and the critical path method for scheduling activities in a project. It aims to identify dependencies between activities, allocate resources to activities while avoiding overallocation, and determine the critical path. The critical path is the longest path of activities that determines the minimum project duration. It identifies activities with zero slack that cannot be delayed without delaying the entire project. The document provides examples of how to model a project as a network diagram, perform forward and backward passes to calculate earliest and latest start/finish dates, and identify the critical path and non-critical path activities. It also discusses how to allocate resources to activities and level resources to avoid overallocation.
Chapter 08 of ICT Project Management based on IOE Engineering syllabus. This chapter contains activity definition, decomposition of activities,activity attributes, schedule development and control etc....Provided by Project Management Sir of KU.
MS Project Management (Overviews) | Software Mange Tool | Software Project Ma...Kuldeep Kumar
No Need Thankx! Very Helpful in Software Mange Tools, Software Project Management, I cover all things of MS Project, like History, Purpose Critical Path. Scheduling & Competitors.
MS Project Management (Overviews) | Software Mange Tool | Software Project Ma...Kuldeep Kumar
No Need Thankx! Very Helpful in Software Mange Tools, Software Project Management, I cover all things of MS Project, like History, Purpose Critical Path. Scheduling & Competitors.
Sachpazis:Terzaghi Bearing Capacity Estimation in simple terms with Calculati...Dr.Costas Sachpazis
Terzaghi's soil bearing capacity theory, developed by Karl Terzaghi, is a fundamental principle in geotechnical engineering used to determine the bearing capacity of shallow foundations. This theory provides a method to calculate the ultimate bearing capacity of soil, which is the maximum load per unit area that the soil can support without undergoing shear failure. The Calculation HTML Code included.
Student information management system project report ii.pdfKamal Acharya
Our project explains about the student management. This project mainly explains the various actions related to student details. This project shows some ease in adding, editing and deleting the student details. It also provides a less time consuming process for viewing, adding, editing and deleting the marks of the students.
Hybrid optimization of pumped hydro system and solar- Engr. Abdul-Azeez.pdffxintegritypublishin
Advancements in technology unveil a myriad of electrical and electronic breakthroughs geared towards efficiently harnessing limited resources to meet human energy demands. The optimization of hybrid solar PV panels and pumped hydro energy supply systems plays a pivotal role in utilizing natural resources effectively. This initiative not only benefits humanity but also fosters environmental sustainability. The study investigated the design optimization of these hybrid systems, focusing on understanding solar radiation patterns, identifying geographical influences on solar radiation, formulating a mathematical model for system optimization, and determining the optimal configuration of PV panels and pumped hydro storage. Through a comparative analysis approach and eight weeks of data collection, the study addressed key research questions related to solar radiation patterns and optimal system design. The findings highlighted regions with heightened solar radiation levels, showcasing substantial potential for power generation and emphasizing the system's efficiency. Optimizing system design significantly boosted power generation, promoted renewable energy utilization, and enhanced energy storage capacity. The study underscored the benefits of optimizing hybrid solar PV panels and pumped hydro energy supply systems for sustainable energy usage. Optimizing the design of solar PV panels and pumped hydro energy supply systems as examined across diverse climatic conditions in a developing country, not only enhances power generation but also improves the integration of renewable energy sources and boosts energy storage capacities, particularly beneficial for less economically prosperous regions. Additionally, the study provides valuable insights for advancing energy research in economically viable areas. Recommendations included conducting site-specific assessments, utilizing advanced modeling tools, implementing regular maintenance protocols, and enhancing communication among system components.
Hierarchical Digital Twin of a Naval Power SystemKerry Sado
A hierarchical digital twin of a Naval DC power system has been developed and experimentally verified. Similar to other state-of-the-art digital twins, this technology creates a digital replica of the physical system executed in real-time or faster, which can modify hardware controls. However, its advantage stems from distributing computational efforts by utilizing a hierarchical structure composed of lower-level digital twin blocks and a higher-level system digital twin. Each digital twin block is associated with a physical subsystem of the hardware and communicates with a singular system digital twin, which creates a system-level response. By extracting information from each level of the hierarchy, power system controls of the hardware were reconfigured autonomously. This hierarchical digital twin development offers several advantages over other digital twins, particularly in the field of naval power systems. The hierarchical structure allows for greater computational efficiency and scalability while the ability to autonomously reconfigure hardware controls offers increased flexibility and responsiveness. The hierarchical decomposition and models utilized were well aligned with the physical twin, as indicated by the maximum deviations between the developed digital twin hierarchy and the hardware.
Saudi Arabia stands as a titan in the global energy landscape, renowned for its abundant oil and gas resources. It's the largest exporter of petroleum and holds some of the world's most significant reserves. Let's delve into the top 10 oil and gas projects shaping Saudi Arabia's energy future in 2024.
Cosmetic shop management system project report.pdfKamal Acharya
Buying new cosmetic products is difficult. It can even be scary for those who have sensitive skin and are prone to skin trouble. The information needed to alleviate this problem is on the back of each product, but it's thought to interpret those ingredient lists unless you have a background in chemistry.
Instead of buying and hoping for the best, we can use data science to help us predict which products may be good fits for us. It includes various function programs to do the above mentioned tasks.
Data file handling has been effectively used in the program.
The automated cosmetic shop management system should deal with the automation of general workflow and administration process of the shop. The main processes of the system focus on customer's request where the system is able to search the most appropriate products and deliver it to the customers. It should help the employees to quickly identify the list of cosmetic product that have reached the minimum quantity and also keep a track of expired date for each cosmetic product. It should help the employees to find the rack number in which the product is placed.It is also Faster and more efficient way.
Final project report on grocery store management system..pdfKamal Acharya
In today’s fast-changing business environment, it’s extremely important to be able to respond to client needs in the most effective and timely manner. If your customers wish to see your business online and have instant access to your products or services.
Online Grocery Store is an e-commerce website, which retails various grocery products. This project allows viewing various products available enables registered users to purchase desired products instantly using Paytm, UPI payment processor (Instant Pay) and also can place order by using Cash on Delivery (Pay Later) option. This project provides an easy access to Administrators and Managers to view orders placed using Pay Later and Instant Pay options.
In order to develop an e-commerce website, a number of Technologies must be studied and understood. These include multi-tiered architecture, server and client-side scripting techniques, implementation technologies, programming language (such as PHP, HTML, CSS, JavaScript) and MySQL relational databases. This is a project with the objective to develop a basic website where a consumer is provided with a shopping cart website and also to know about the technologies used to develop such a website.
This document will discuss each of the underlying technologies to create and implement an e- commerce website.
2. Goals of the Unit
• Making the WBS into a schedule
• Understanding dependencies between activities
• Learning the Critical Path technique
• Learning how to level resources
!2
3. Initiate Plan Execute &
Monitor
Close
Develop
Monitor
Goals,
Cost
and
Schedule
Release
Change Control & Configuration Management
Quality Management
Human Resource Management
Kick Off
Activities
Formalize
Goals
Define
Schedule
Define Costs
Assess
Feasibility
Close
Collect
Outputs
[Obtain
Approval]
Risk Management
4. Overview
• We have:
– A WBS (activities)
– Effort (duration) estimations for each element of the WBS
• We want to schedule activities, so that we know when
each activity starts and ends, when we need resources,
when we deliver
• Process:
– Identify constraints (dependencies)
– Allocate and level resources
– Find the critical path and iterate till the plan is satisfactory
• Output: Gantt Chart
!4
5. The modern Gantt chart
• Textual Outline + Calendar Graph
• Activities as bars (possibly annotated with names and
resources)
• Deliverable (as diamonds)
• Activities can be grouped (information of group is derived by
lower level activities)
• Dependencies among tasks
!5
1) Task 1 1d
2) Task 2 1d
3) Deliverable 1
4) Group 2d
4.1) Task 4 1d
4.2) Task 5 1d
Task E!ort
Task 1 Resource 2
Task 2
Task 4
Task 5
2 Mar 3 Mar 4 Mar 5 Mar
6. The modern Gantt chart and the WBS
!6
Project
1. Group 1
1.1 Task 1
2. Group 2
2.1 Task 2
2.2 Task 3
8. Identify Dependencies
• The execution of activities is constrained by the
logic of the plan (you do not build the roof before
the foundations and structure of a house are laid
completed)
• Hard and soft dependencies (definition in the
next two slides).
• When using planning tools:
– Specify only “hard” dependencies
– “Soft” dependencies are typically inserted by the
planning tool
!8
9. Hard Dependencies
• Not much you can do about it...
• They might either derive:
– From the project “logic” (e.g. testing has to come after
coding)
– From external dependencies (e.g. a contract sign-off; a
particular alignment of planets is necessary to launch a
spacecraft)
• Eliminating hard dependencies can be done, at a cost
(e.g., increased risk, re-work)
10. Soft Dependencies
• Due to a choice among all possible alternative plans
• They might either derive:
– From discretionary choices (e.g., the PM chooses the
order in which modules are to be developed)
– From resource availability and leveling (e.g., the PM or the
planning tool sequences two tasks relying on the same
resource)
• Notice that, as time progresses, it might become
difficult or impossible to “undo” soft dependencies
(e.g. a resource is shared by different projects)
11. Task Dependency Relationships
• Finish-to-Start (FS)
– B cannot start till A finishes
– Most commonly used
• Start-to-Start (SS)
– B cannot start till A starts
– Perform experiment; monitor experiment
• Finish-to-Finish (FF)
– B cannot finish till A finishes
• Start-to-Finish (SF)
– B cannot finish till A starts (rare)
Task 1
Task 2
Task 1
Task 2
12. Lead and Lag Time
• Dependencies between activities can have a non zero
duration
• Lag time = delay introduced by the dependency is
positive (some time passes between the two tasks)
• Lead time = the duration of the dependency is
negative (the activities partially overlap)
!12
13. Some rules of the thumb
• Use milestones (and deliverables) to clearly mark “phase”
transitions (or some important transitions from an activity to
another)
• Try and minimize task dependencies (to minimize delays due
to some activities waiting for some other activities to end)
• Evaluate alternatives
• Certain activities might just depend on calendar (and be
constrained by dates)
• Take into account all dimensions (cost, quality, and time):
minimize time might increase costs, risks, and compromise
quality
15. Critical Path
• Not all activities are equally important or critical in a
plan
• The critical path method looks at those activities
which determine the duration of a plan
• These activities constitute the critical path
• Any arbitrarily small delay in any activity in the critical
path will delay the finish date of a project
• The computation is based on Network Diagrams (a
graph representation of the plan)
!15
16. Network Diagrams
• Developed in the 1950’s
• A graphical representation of the tasks necessary to complete a
project (plan as graph)
• Visualize the flow of tasks & relationships
• Two classic formats
– AOA: Activity on Arc (or Activity on Arrow)
– AON: Activity on Node
• Conventions:
– Each task labeled with an identifier and a duration (in std. unit like
days)... variations are possible
– There is one start and one end event
– Time goes from left to right
!16
17. Network Diagrams
• AOA (Activity on Arrow)
a.k.a ADM (Activity Diagramming Method):
– Circles represents Events (e.g. ‘start’ or ‘end’ of a given
task)
– Lines representing Tasks, such as ‘Design’
• AON (Activity on Node)
a.k.a. PDM (Precedence Diagramming Method):
– Tasks are on Nodes
– Arcs represents dependencies between task
!17
18. Graphical Formats
1 2 3
Requirements Design
15 days 5 days
AOA: Activity on Arc
AON: Activity on Node
Requirements
(15 days)
Design
(5 days)
... which one is better?
!18
19. AOA/AON Comparison
• AOA initially used by Walker and Kelly for PERT
• AON more flexible and easier to draw
• AOA simpler to use for certain algorithms
... we will stick
(mostly) to AON
!19
20. Example: AOA/AON Comparison
Activity Predecessors Duration
A None 3 months
B None 4 months
C A 3 months
D A, B 1 month
E B 2 months
Consider the following plan:
!20
21. Example: AOA/AON Comparison
• In the AOA notation,
some dependencies
might require “dummy”
arcs and nodes to be
introduced (*)
1
2
4
5
A
B
C
D
3
E
(*) Notice that, since we can/have to
add nodes and arcs, a plan does not
have a unique AOA associated to it
!21
23. Slack & Float (synonyms)
• Free Slack
– Slack an activity has before it delays next task
• Total Slack
– Slack an activity has before delaying whole project
• Slack Time TS = TL – TE
– TE = earliest time an event can take place
– TL = latest date it can occur w/o extending project’s completion date
or next activity
TE TL
TS
!23
24. DURATION
SLACK
ACTIVITY NAME
EARLIEST
START DATE
EARLIEST
END DATE
LATEST
START DATE
LATEST
END DATE
Critical Path Computation
• Goal: given a plan (activities, duration, and
dependencies), determine Slack, Earliest and
Latest dates of each activity
• Notation: AON with nodes represented as follows
!24
25. Critical Path Computation
• A forward pass determines the earliest start and end
dates of each activity in the plan
• A backward pass determines the latest start and
end dates of each activity in the plan
• The difference between earliest start (end) and latest
start (end) is the slack of an activity
• The critical path is the path in which all activities
have zero slack
• A plan always has a critical path... changing the plan
changes what activities are in the critical path
!25
26. S A
B
E
C
P
2
7
3
0
0
0
0
7 7 9 10
10
10
10
10
10
8
10
0
8
1
8
3
5
10
a
b
b
c
d
DURATION
SLACK
ACTIVITY NAME
EARLIEST
START DATE
EARLIEST
END DATE
LATEST
START DATE
LATEST
END DATE
Example 1
!26
27. 1) Task 1 4w
2) Task 2 8w
3) Task 3 2w
4) Task 4 2w
5) Task 5 10w
6) Task 6 1w
7) Project End
Task Duration
Task 1 4w
Task 2 8w
Task 3 2w
Task 4 2w
Task 5 10w
Task 6 1w
Month 0 Month 1 Month 2 Month 3 Month 4 M
Example 2
• “Informal approach”: have a look at what
activities can slide in a plan without moving the
end date of a project (e.g. Task 3 is not in the
critical path)
• CPM highlighted automatically by many Gantt
charting tools
!27
28. Critical Path Method Remarks
• Critical path refers just to duration and not to other
characteristics such as risk or difficulty
• Activities which are not in the critical path can delay a
plan, if the delay is long enough.
• Watch out for (nearly) critical paths: a delay in an
activity in a non-critical path may make another path
critical
!28
30. A (simplified) Process
• Inputs:
– the plan: activities, constraints, effort for each activity
– project team (number, types, and availability of resources)
– delivery dates (project constraints)
• Resource allocation:
– the process by which a resource is assigned to a task, that is, is
tasked with carrying out part of the work (effort) defined in a task
• Constraints:
– according to availability and needs (e.g. the type of resource required
for a given activity): no over-allocation (above maximum availability)
(resource leveling)
• If no solution is found, if you may, variate some hypotheses
(e.g. increase team size, relax constraints) and iterate
!30
31. Task 1
Task 1 R 1 {50% of 100%}
R 1 {50% of 100%}
1w
Task 2
Task 2 R 2
R 2
2w
Task 3
Task 3 R 1 {50% of 100%}; R 2 {50% of 100%}
R 1 {50% of 100%}; R 2 {50% of 100%}
1w
T-1w T day T+1w T+2w T+3w T+4w T
Resource Allocation Examples
• Legenda:
– each slot: 1week
– R1 assigned to Task 1 at 50% of his time
– R2 allocated full time to Task 2
– R1 and R2 allocated @ 50% of their time to Task 3
• What it means:
– R1 will work 20 hours on week 1 and 2 and 20 hours on week 3
– R2 will work 40 hours on week 1 and 2 and 20 hours on week 3
!31
32. Resource Usage
• For manpower: the amount of time each resource is
needed at a given time
• For equipment: the number of items that are
necessary at any given time
• For material: the amount of material which is required
(consumed) at any given time
!32
33. How is it computed?
• Resource usage is computed by summing the
amount of work required for any given period
• That is a “vertical” sum over work
assignments
!
!
• Overallocation: a situation in which a resource
is used above his/her/its maximum capability
!33
34. Example
!34
Task 1
Task 1 R 1 {50% of 100%}
R 1 {50% of 100%}
1w
Task 2
Task 2 R 2
R 2
2w
Task 3
Task 3 R 1 {50% of 100%}; R 2 {50% of 100%}
R 1 {50% of 100%}; R 2 {50% of 100%}
1w
Task 4
Task 4 R 1
R 1
2w
T-1w T day T+1w T+2w T+3w T+4w T+5
hours hours hours hours hours
R1 20 20 T1
20 T3
40 40 T4
Total R1 20 60 60
R2 40 40 T2
20 T3
Total R2 40 40 20
R1 is over allocated in W2 (T+1w) and W3 (T+2w)
35. More Complete Example
!35
Allocating two resources to Task 2
allows to satisfy the constraints
We draw the plan highlighting hard
constraints. Deliverable has a unmovable
delivery date
37. Example
!37
Solution 1. Resource leveling... insert soft constraints in your plan so
that no resource is over allocated (does not work above 100%)
Solution 2. Compression techniques (in a few lessons)
Some considerations:
• Resource 1 will work on the project
full time.
• Resource 2 and Resource 3 needed
just towards the end of the project
(for Task 2)