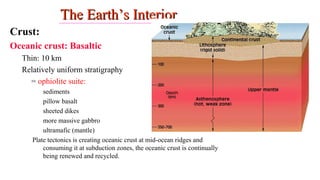
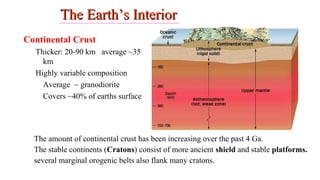
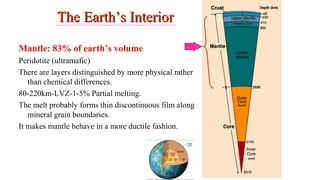
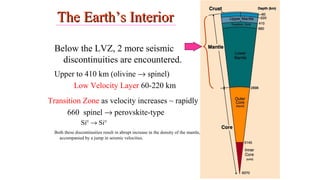
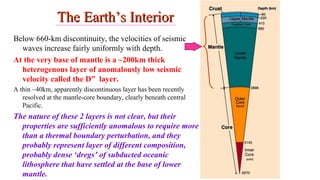
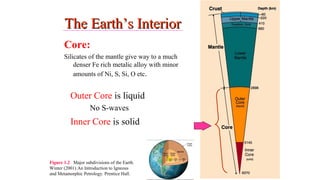
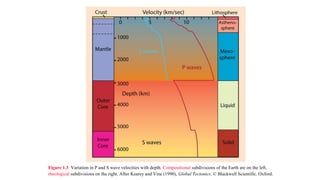
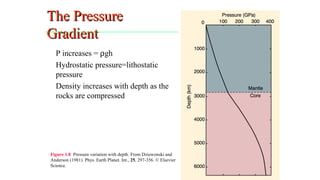
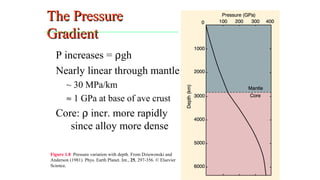
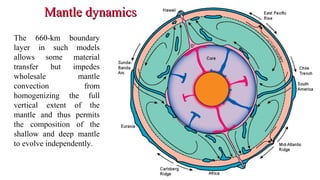
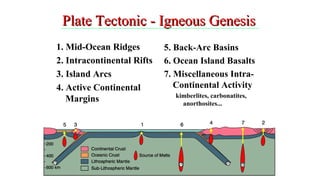
SlideShare a Scribd company logo
IgneousIgneous
PetrologyPetrology
Thanks to John WinterThanks to John Winter
1
IntroductionIntroduction
Igneous petrology is the study of melts (magma) and
the rocks that crystallize from such melts,
encompassing an understanding of the processes
involved in melting and subsequent rise, evolution,
crystallization, and eruption or emplacement of the
eventual rocks.
2
All terrestrial rocks that we now find at earths
surface were derived initially from the mantle,
although some have gone cycles of
sedimentation and metamorphism.
If these rocks have ultimate origin at depth, it
follows that we need to know what makes up the
earth if we want to understand their origin more
fully.
Compositionally there is crust, mantle and core
delineated by seismic discontinuities.
The Earth’s InteriorThe Earth’s Interior
3
The Earth’s InteriorThe Earth’s Interior
Crust:
Oceanic crust: Basaltic
Thin: 10 km
Relatively uniform stratigraphy
= ophiolite suite:
sediments
pillow basalt
sheeted dikes
more massive gabbro
ultramafic (mantle)
Plate tectonics is creating oceanic crust at mid-ocean ridges and
consuming it at subduction zones, the oceanic crust is continually
being renewed and recycled.
4
The Earth’s InteriorThe Earth’s Interior
Continental Crust
Thicker: 20-90 km average ~35
km
Highly variable composition
Average ~ granodiorite
Covers ~40% of earths surface
The amount of continental crust has been increasing over the past 4 Ga.
The stable continents (Cratons) consist of more ancient shield and stable platforms.
several marginal orogenic belts also flank many cratons.
5
The Earth’s InteriorThe Earth’s Interior
Mantle: 83% of earth’s volume
Peridotite (ultramafic)
There are layers distinguished by more physical rather
than chemical differences.
80-220km-LVZ-1-5% Partial melting.
The melt probably forms thin discontinuous film along
mineral grain boundaries.
It makes mantle behave in a more ductile fashion.
6
The Earth’s InteriorThe Earth’s Interior
Below the LVZ, 2 more seismic
discontinuities are encountered.
Upper to 410 km (olivine → spinel)
Low Velocity Layer 60-220 km
Transition Zone as velocity increases ~ rapidly
660 spinel → perovskite-type
SiIV
→ SiVI
Both these discontinuities result in abrupt increase in the density of the mantle,
accompanied by a jump in seismic velocities.
7
The Earth’s InteriorThe Earth’s Interior
Below 660-km discontinuity, the velocities of seismic
waves increase fairly uniformly with depth.
At the very base of mantle is a ~200km thick
heterogenous layer of anomalously low seismic
velocity called the D” layer.
A thin ~40km, apparently discontinuous layer has been recently
resolved at the mantle-core boundary, clearly beneath central
Pacific.
The nature of these 2 layers is not clear, but their
properties are sufficiently anomalous to require more
than a thermal boundary perturbation, and they
probably represent layer of different composition,
probably dense ‘dregs’ of subducted oceanic
lithosphere that have settled at the base of lower
mantle.
8
The Earth’s InteriorThe Earth’s Interior
Core:
Silicates of the mantle give way to a much
denser Fe rich metalic alloy with minor
amounts of Ni, S, Si, O etc.
Outer Core is liquid
No S-waves
Inner Core is solid
Figure 1.2 Major subdivisions of the Earth.
Winter (2001) An Introduction to Igneous
and Metamorphic Petrology. Prentice Hall.
9
Figure 1.3 Variation in P and S wave velocities with depth. Compositional subdivisions of the Earth are on the left,
rheological subdivisions on the right. After Kearey and Vine (1990), Global Tectonics. © Blackwell Scientific. Oxford.
10
The PressureThe Pressure
GradientGradient
P increases = ρgh
Hydrostatic pressure=lithostatic
pressure
Density increases with depth as the
rocks are compressed
Figure 1.8 Pressure variation with depth. From Dziewonski and
Anderson (1981). Phys. Earth Planet. Int., 25, 297-356. © Elsevier
Science.
12
The PressureThe Pressure
GradientGradient
P increases = ρgh
Nearly linear through mantle
~ 30 MPa/km
≈ 1 GPa at base of ave crust
Core: ρ incr. more rapidly
since alloy more dense
Figure 1.8 Pressure variation with depth. From Dziewonski and
Anderson (1981). Phys. Earth Planet. Int., 25, 297-356. © Elsevier
Science.
13
Heat SourcesHeat Sources
in the Earthin the Earth
1. Heat from the early accretion and differentiation of the Earth
(Secular cooling)
Primordial heat developed early in the history of the Earth from the
processes of accretion and gravitational differentiation
Some continued gravitational partitioning of iron in the inner core
may contribute some heat as well.
Estimates are 10-25% of total heat flux
14
Heat SourcesHeat Sources
in the Earthin the Earth
2. Heat released by the radioactive breakdown of unstable
nuclides
• Most of the radioactive elements are concentrated in the continental
crust.
• 75-90% heat is produced that reaches the surface
15
Heat TransferHeat Transfer
1. Radiation: Sufficiently transparent or translucent
material can transfer heat by radiation. It is the movement
of the particles/waves through another medium. Eg. Lamp
losing heat or surface of the earth losing heat.
2. Conduction: Opaque and rigid substances transfer heat
by conduction. It involves transfer of kinetic energy from
hotter atoms to adjacent cooler ones. It is efficient for
metals. Conduction is poor for silicate minerals but
relatively efficient in the core.
16
Heat TransferHeat Transfer
3. Convection: If the material is more ductile and if it can be
moved, this is the process. It is the movement of material due
to density differences caused by thermal or compositional
variations.
17
Heat TransferHeat Transfer
3. Convection: It affects ductile rocks and liquids.
• It may involve flow in a single direction, in which case the
moved hot material will accumulate at the top of the ductile
portion of the system.
• Convection may also occur in a cyclic motion, typically in a
closed cell above a localized heat source.
• Here, the heated material rises and moves laterally as it cools
and is pushed aside by later convective matter.
• Material pushed to the margin cools, contracts, and sinks
towards the heat source, where it becomes heated and cycle
continues. 18
Heat TransferHeat Transfer
3. Advection:
• It involves the transfer of heat with rocks that are otherwise in motion.
• For eg, if a hot region at depth is uplifted by either tectonism, induced flow
or erosion and isostatic rebound, heat rises physically with the rocks.
• All rocks, whether igneous, sedimentary or metamorphic,
owe their origins directly or indirectly to the advective
cooling of the earth.
• The rise of magma into the crust or its extrusion onto the
surface is an obvious example of advection.
19
The Geothermal GradientThe Geothermal Gradient
• Convection works well in the liquid core and in the
somewhat fluid mantle.
• It is also a primary method of heat transfer in hydrothermal
systems above magma bodies.
• Beyond these areas, conduction and advection are the only
available methods of heat transfer.
• Transfer of heat controls metamorphism, melting,
crystallization, as well as the motion, mixing and mechanical
properties of Earth materials.
• We will consider heat transfer later.
20
The Geothermal GradientThe Geothermal Gradient
Diagrammatic cross-section through the
upper 200-300 km of the Earth showing
geothermal gradients reflecting more
efficient adiabatic (constant heat content)
convection of heat in the mobile
asthenosphere (steeper gradient in blue) )
and less efficient conductive heat transfer
through the more rigid lithosphere
(shallower gradient in red). The boundary
layer is a zone across which the transition
in rheology and heat transfer mechanism
occurs (in green). The thickness of the
boundary layer is exaggerated here for
clarity: it is probably less than half the
thickness of the lithosphere.
Convection in the mantle redistributes heat more faster than conduction 21
The Geothermal GradientThe Geothermal Gradient
A similar example for thick
(continental) lithosphere.
The curved part of the
geotherm represents a zone of
gradual transition – boundary
layer – where, as temperature
rises, rocks become
progressively more ductile and
begin to participate in
convection.
22
The Geothermal GradientThe Geothermal Gradient
Notice that thinner lithosphere
allows convective heat transfer to
shallower depths, resulting in a
higher geothermal gradient across
the boundary layer and lithosphere.
TP is the potential temperature. It
permits comparison of (estimated)
temperatures at depth from one
locality to another. Because
temperature varies with depth, one
must select some reference depth. In
this case the surface was chosen.
One simply extrapolates
adiabatically from the T and P in
question to the surface. Potential temperature, is the hypothetical surface temperature a deeply
buried rock would end up at if it were transported to the surface along
the adiabat passing through PT , without melting.
23
The Geothermal GradientThe Geothermal Gradient
Figure 1.10 Temperature contours calculated for an oceanic plate generated at a mid-ocean
ridge (age 0) and thickening as it cools. The 1300o
C isotherm is a reasonable approximation
for the base of the oceanic lithosphere. The plate thickens rapidly from zero to 50 Ma and is
essentially constant beyond 100 Ma. From McKenzie et al. (2005). 26
The Geothermal GradientThe Geothermal Gradient
Figure 1.11 Estimates of
oceanic (blue curves) and
continental shield (red curves)
geotherms to a depth of 300 km.
The thickness of mature (>
100Ma) oceanic lithosphere is
hatched and that of continental
shield lithosphere is yellow.
• Because the thermal
conductivity of shallow crustal
rocks is low, heat transfer is
slow. Extrapolating this leads to
very high geothermal gradient.
27
The Geothermal GradientThe Geothermal Gradient
• Shallow gradients in old oceanic
lithosphere range from about 17-
200
C/Km, gradually steepening to about
70
C/Km with depth.
• Shallow shield gradients range from
about 12-180
C/Km, transitioning to
about 4-60
C/Km below about 30Km.
• The oceanic v/s shield temperature
differences are essentially
restricted to the lithosphere and
boundary layer, so the oceanic and
continental curves converge by
about 250-300Km where
convection has homogenizing
influence.
28
The Geothermal GradientThe Geothermal Gradient
Figure 1.12 Estimate of the geothermal
gradient to the center of the Earth (after
Stacey, 1992). The shallow solid portion is
very close to the Green & Ringwood (1963)
oceanic geotherm in Fig. 1–11 and the
dashed geotherm is the Jaupart & Mareschal
(1999) continental geotherm.
• Nearly adiabatic convective
heat flow deeper than about
300Km results in a linear
geothermal gradient of approx.
0.30
C/Km.
• The gradient shallows across
the D” layer and then becomes
steep in the metallic core,
where the thermal conductivity
and convection is very high.
29
The Geothermal GradientThe Geothermal Gradient
• The density contrast across
the core-mantle boundary
prohibits the core material
from rising into the mantle,
so heat can only be
transferred upward by
conduction, resulting in a
thermal boundary layer
across which the thermal
gradient is estimated to be
300 – 10000
C.
30
The geothermal gradientThe geothermal gradient
The rate of convective flow in the mantle is measured
in terms of cms/year.
Slabs of cooler oceanic lithosphere, mostly mantle
rock, too viscous to convect within themselves, sink
into the underlying hotter and relatively less dense
underlying mantle.
Computed tomography of the Earth using seismic
waves has shown that at least some subducting
lithospheric slabs sink all the way through the mantle
and come to rest on top of the dense metallic core
31
Even though the rate at which the mantle
convects, on the order of a few
centimeters/year, seems minuscule, it is far
greater than the rate of heat transfer by
conduction.
The fact that lithospheric slabs can sink
convectively over tens of millions of years
about 2800 km through the hotter mantle but
still maintain a recognizable cooler T
throughout their approximately 100-km
thickness demonstrates how slowly they are
conductively heated.
Conversely, if heat conduction were more
rapid than convection, the subducting slabs
would absorb heat and lose their density
contrast and identity before sinking very far.
32
33
Dynamic cooling of the earthDynamic cooling of the earth
Previous figure was intended to illustrate the thermal
structure at shallow levels of Earth’s interior in stabilized
areas, similar to a static, chemically and physically
stratified earth with continents and oceans.
The earth is far more dynamic.
Temperature variations that drive convective flow are
concentrated in thin boundary layers that are much smaller
than the overall circulation pattern.
The upper boundary of this system is a cool thermal
boundary layer with low viscosity: the lithosphere.
34
Dynamic cooling of the earthDynamic cooling of the earth
In laboratory models of convecting fluids, cool dense upper
thermal boundary layer descend as either cylindrical
downwellings or as larger networks of partially connected
tabular-shaped downwelling slabs, depending on the
rheology of the material.
It generally leads to slab-like downwelling.
Mantle convection and plate tectonics are inseparable
manifestations of the heat-driven dynamic cooling process of
the Earth, given its present thermal state and rheological
properties.
For the Earth, plate tectonics is mantle convection.
35
Plate tectonicsPlate tectonics
The negative buoyancy of the descending plates has been called slab pull,
dense subducting slab pulls the rest of the plate after it.
The motion of the lithospheric plates down and away from the elevated mid-
oceanic ridges is called as ridge-push.
Both are body forces affecting whole plate.
As the subducting slab descends, the slab cant pull significantly on the rest
of the plate, which would simply fault and break. 36
Plate tectonicsPlate tectonics
Instead, as it sinks, the slab sets up circulation patterns in the mantle that
exert a sort of suction force.
As the slab descends from the surface, the pressure behind it is lowered,
which is immediately compensated by feeding more plate into the
subduction zone.
37
Dynamic cooling of the earthDynamic cooling of the earth
Ridge push is gravitational sliding of a plate off the elevated
ridge, not an active mantle push by ascending mantle flow,
which would buckle the plate.
Plate motion velocities are roughly proportional to the
percentage of plate’s perimeter that corresponds to
subduction zones and not to ridges (Forsyth & Uyeda, 1975)
The predominance of slab pull suggest that mantle
upwelling at divergent plate boundaries, which moves
heat upward, is essentially a passive response to plate
separation and descent.
38
TheThe
GeothermalGeothermal
GradientGradient
Fig 1.13. Pattern of global heat flux variations compiled from
observations at over 20,000 sites and modeled on a spherical
harmonic expansion to degree 12. From Pollack, Hurter and
Johnson. (1993) Rev. Geophys. 31, 267-280.
Cross-section of the mantle based on a seismic tomography model. Arrows represent
plate motions and large-scale mantle flow and subduction zones represented by dipping
line segments. EPR =- East pacific Rise, MAR = Mid-Atlantic Ridge, CBR = Carlsberg
Ridge. Plates: EA = Eurasian, IN = Indian,
PA = Pacific, NA = North American, SA = South American, AF = African, CO = Cocos.
From Li and Romanowicz (1996). J. Geophys. Research, 101, 22,245-72.
39
TheThe
GeothermalGeothermal
GradientGradient
Thermal structure in a 3D spherical mantle
convection model (red is hot, blue is cold).
J. H. Davies and H.-Peter Bunge
http://www.ocean.cf.ac.uk/people/huw/AG
U99/mantlecirc.html
40
Dynamic cooling of the earthDynamic cooling of the earth
What happens at other deeper boundary?
The density more than doubles from lower mantle to the core,
thus preventing convection across the boundary, regardless of
thermal differences.
The liquid outer core must be internally convecting to produce
Earth’s magnetic field.
The D” layer may be the resulting mantle side thermal boundary
layer, across which the temperature gradient is estimated to be
300 to 10000
C.
Convection within the mantle results from thermal instabilities as the
heated by D” layer becomes positively buoyant.
43
Dynamic cooling of the earthDynamic cooling of the earth
The viscosity is much lower than that of the plates at such elevated
temperatures, and the instabilities take the alternative form of rising
cylindrical plumes rather than slabs.
These plumes are more of an active upwelling, in comparison to the more
passive shallow mantle rise in response to plate separation.
The plumes appear to be largely independent of plate tectonics,
but in many cases are sufficiently vigorous to penetrate the
lithosphere and reach the Earth’s surface, where they result in
hotspot activity.
Plate tectonics thus appears to be the method by which a largely internally
heated and viscous mantle cools by convection, whereas plumes essentially
cool the core and have an increasing effect on lower mantle.
44
Dynamic cooling of the earthDynamic cooling of the earth
Even general model of mantle convection depends on the
influence of 660-km phase transition.
Some investigators consider the density contrast across the
boundary insufficient to impede convection, so there is whole
mantle convection.
Others believe the 660-km transition can impede convection,
so that warm, buoyant mantle material in rising portions of
deep convection cells would be less buoyant than the material
above transition, causing the rising material to spread laterally
instead.
If so, heat can transfer across the boundary only by
conduction, inducing convection in the upper mantle. 45
Figure 1.14. Schematic diagram of a 2-
layer dynamic mantle model in which the
660 km transition is a sufficient density
barrier to separate lower mantle convection
(arrows represent flow patterns) from upper
mantle flow, largely a response to plate
separation. The only significant things that
can penetrate this barrier are vigorous
rising hotspot plumes and subducted
lithosphere (which sink to become
incorporated in the D" layer where they
may be heated by the core and return as
plumes). Plumes in core represent relatively
vigorous convection (see Chapter 14). After
Silver et al. (1988).
Mantle dynamicsMantle dynamics
Is the 660 km transition a
barrier to whole-mantle
convection?
Maybe?
Partly?
No?
46
Mantle dynamicsMantle dynamics
The 660-km boundary
layer in such models
allows some material
transfer but impedes
wholesale mantle
convection from
homogenizing the full
vertical extent of the
mantle and thus permits
the composition of the
shallow and deep mantle
to evolve independently.
47
Plate Tectonic - Igneous GenesisPlate Tectonic - Igneous Genesis
1. Mid-Ocean Ridges
2. Intracontinental Rifts
3. Island Arcs
4. Active Continental
Margins
5. Back-Arc Basins
6. Ocean Island Basalts
7. Miscellaneous Intra-
Continental Activity
kimberlites, carbonatites,
anorthosites...
49

More Related Content

What's hot

Fluids inclusion of metamorphic rocks
Fluids inclusion of metamorphic rocksFluids inclusion of metamorphic rocks
Fluids inclusion of metamorphic rocks
Pramoda Raj
 
Carbonatites
CarbonatitesCarbonatites
Carbonatites
Pramoda Raj
 
STRATIGRAPHIC CORRELATION
STRATIGRAPHIC CORRELATION STRATIGRAPHIC CORRELATION
STRATIGRAPHIC CORRELATION
SANDEEP PATRE
 
Tectonic control of sediments
Tectonic control of sedimentsTectonic control of sediments
Tectonic control of sediments
Arshad Ayub
 
Stereographic projection
Stereographic projection Stereographic projection
Stereographic projection
PurvaPandey3
 
Kimberlites
KimberlitesKimberlites
Kimberlites
Pramoda Raj
 
Migmatites
MigmatitesMigmatites
Migmatites
Shalini Palanivel
 
9atharva pawar
9atharva pawar9atharva pawar
9atharva pawar
Shivam Jain
 
Ore deposits
Ore depositsOre deposits
Metamorphic facies
Metamorphic faciesMetamorphic facies
Metamorphic faciesAbid Ali
 
Dharwar super group
Dharwar super groupDharwar super group
Dharwar super group
haroon97123
 
Anorthosite
Anorthosite Anorthosite
Anorthosite
Pramoda Raj
 
Ch 10 magma generation
Ch 10 magma generationCh 10 magma generation
Ch 10 magma generation
Raghav Gadgil
 
A seminar on ramsay classification of fold
A seminar on ramsay classification of foldA seminar on ramsay classification of fold
A seminar on ramsay classification of fold
Darshan Malviya
 
Ore texture and paragenesis krishanu
Ore texture and paragenesis krishanuOre texture and paragenesis krishanu
Ore texture and paragenesis krishanu
krishanunath1
 
Igneous textures and structures
Igneous textures and structuresIgneous textures and structures
Igneous textures and structuresBadal Mathur
 
Sedimentary depositional environments
Sedimentary depositional environmentsSedimentary depositional environments
Sedimentary depositional environmentsuos
 
Stratigraphy i
Stratigraphy iStratigraphy i
Stratigraphy i
04799saran
 

What's hot (20)

Fluids inclusion of metamorphic rocks
Fluids inclusion of metamorphic rocksFluids inclusion of metamorphic rocks
Fluids inclusion of metamorphic rocks
 
Carbonatites
CarbonatitesCarbonatites
Carbonatites
 
STRATIGRAPHIC CORRELATION
STRATIGRAPHIC CORRELATION STRATIGRAPHIC CORRELATION
STRATIGRAPHIC CORRELATION
 
Tectonic control of sediments
Tectonic control of sedimentsTectonic control of sediments
Tectonic control of sediments
 
Stereographic projection
Stereographic projection Stereographic projection
Stereographic projection
 
Kimberlites
KimberlitesKimberlites
Kimberlites
 
Migmatites
MigmatitesMigmatites
Migmatites
 
9atharva pawar
9atharva pawar9atharva pawar
9atharva pawar
 
Ore deposits
Ore depositsOre deposits
Ore deposits
 
Metamorphic facies
Metamorphic faciesMetamorphic facies
Metamorphic facies
 
volcanic exhalative process
volcanic exhalative processvolcanic exhalative process
volcanic exhalative process
 
Dharwar super group
Dharwar super groupDharwar super group
Dharwar super group
 
Anorthosite
Anorthosite Anorthosite
Anorthosite
 
Ch 10 magma generation
Ch 10 magma generationCh 10 magma generation
Ch 10 magma generation
 
A seminar on ramsay classification of fold
A seminar on ramsay classification of foldA seminar on ramsay classification of fold
A seminar on ramsay classification of fold
 
Ore texture and paragenesis krishanu
Ore texture and paragenesis krishanuOre texture and paragenesis krishanu
Ore texture and paragenesis krishanu
 
Igneous textures and structures
Igneous textures and structuresIgneous textures and structures
Igneous textures and structures
 
Sedimentary depositional environments
Sedimentary depositional environmentsSedimentary depositional environments
Sedimentary depositional environments
 
Ophiolite ppt
Ophiolite pptOphiolite ppt
Ophiolite ppt
 
Stratigraphy i
Stratigraphy iStratigraphy i
Stratigraphy i
 

Similar to Ch 01 intro

EARTH'S MECHANISM.pptx
EARTH'S MECHANISM.pptxEARTH'S MECHANISM.pptx
EARTH'S MECHANISM.pptx
GladysFloresBarrion
 
Lithosphere
LithosphereLithosphere
Lithosphere
angelabentley
 
Geology
GeologyGeology
Geology
Jelyn Tecson
 
Earth layers
Earth layersEarth layers
Earth layers
Anabelle Montevirgen
 
Internal Structure of The Earth? Major Structural unit of the earth
Internal Structure of The Earth? Major  Structural unit of the earthInternal Structure of The Earth? Major  Structural unit of the earth
Internal Structure of The Earth? Major Structural unit of the earth
Uday Kumar Shil
 
sharlene ppt.pptx
sharlene ppt.pptxsharlene ppt.pptx
sharlene ppt.pptx
AnneRoshelleAlpuerto
 
Chapter 2.in geomorphology
Chapter 2.in geomorphologyChapter 2.in geomorphology
Chapter 2.in geomorphology
MohamedAbdulkadirMoh1
 
Ii. c. endogenic processes
Ii. c. endogenic processesIi. c. endogenic processes
Ii. c. endogenic processes
Marian Santos
 
earthsinternalstructure-191119103943.pptx
earthsinternalstructure-191119103943.pptxearthsinternalstructure-191119103943.pptx
earthsinternalstructure-191119103943.pptx
cjoypingaron
 
Kuliah GL-3 (Plate Tec).ppt
Kuliah GL-3  (Plate Tec).pptKuliah GL-3  (Plate Tec).ppt
Kuliah GL-3 (Plate Tec).ppt
RudinyFaraby
 
L3 EARTH'S INTERNAL HEAT.pptx
L3 EARTH'S INTERNAL HEAT.pptxL3 EARTH'S INTERNAL HEAT.pptx
L3 EARTH'S INTERNAL HEAT.pptx
Learni Escote
 
Mantle melting and Magmatic processes
Mantle melting and Magmatic processesMantle melting and Magmatic processes
Mantle melting and Magmatic processes
Ananya21Mittal
 
Plate tectonics and Magma genesis
Plate tectonics and Magma genesisPlate tectonics and Magma genesis
Plate tectonics and Magma genesis
FUCKAGAIN
 
Module 5-ELS.pptx
Module 5-ELS.pptxModule 5-ELS.pptx
Module 5-ELS.pptx
RAQUELSODOSO
 
Plate tectonics and magma genesis
Plate tectonics and magma genesisPlate tectonics and magma genesis
Plate tectonics and magma genesis
Pramoda Raj
 
Plate tectonics and magma genesis
Plate tectonics and magma genesisPlate tectonics and magma genesis
Plate tectonics and magma genesis
Pramoda Raj
 
Plate tectonics and magma genesis
Plate tectonics and magma genesisPlate tectonics and magma genesis
Plate tectonics and magma genesis
Pramoda Raj
 
The Crust [11EES - Dynamic Earth]
The Crust [11EES - Dynamic Earth]The Crust [11EES - Dynamic Earth]
The Crust [11EES - Dynamic Earth]
tharding-nbcs
 
Geophysics
GeophysicsGeophysics
Geophysics
KAZEMBETVOnline
 
EALS_Earth's Internal Heat.pdf
EALS_Earth's Internal Heat.pdfEALS_Earth's Internal Heat.pdf
EALS_Earth's Internal Heat.pdf
mydelcampehios1
 

Similar to Ch 01 intro (20)

EARTH'S MECHANISM.pptx
EARTH'S MECHANISM.pptxEARTH'S MECHANISM.pptx
EARTH'S MECHANISM.pptx
 
Lithosphere
LithosphereLithosphere
Lithosphere
 
Geology
GeologyGeology
Geology
 
Earth layers
Earth layersEarth layers
Earth layers
 
Internal Structure of The Earth? Major Structural unit of the earth
Internal Structure of The Earth? Major  Structural unit of the earthInternal Structure of The Earth? Major  Structural unit of the earth
Internal Structure of The Earth? Major Structural unit of the earth
 
sharlene ppt.pptx
sharlene ppt.pptxsharlene ppt.pptx
sharlene ppt.pptx
 
Chapter 2.in geomorphology
Chapter 2.in geomorphologyChapter 2.in geomorphology
Chapter 2.in geomorphology
 
Ii. c. endogenic processes
Ii. c. endogenic processesIi. c. endogenic processes
Ii. c. endogenic processes
 
earthsinternalstructure-191119103943.pptx
earthsinternalstructure-191119103943.pptxearthsinternalstructure-191119103943.pptx
earthsinternalstructure-191119103943.pptx
 
Kuliah GL-3 (Plate Tec).ppt
Kuliah GL-3  (Plate Tec).pptKuliah GL-3  (Plate Tec).ppt
Kuliah GL-3 (Plate Tec).ppt
 
L3 EARTH'S INTERNAL HEAT.pptx
L3 EARTH'S INTERNAL HEAT.pptxL3 EARTH'S INTERNAL HEAT.pptx
L3 EARTH'S INTERNAL HEAT.pptx
 
Mantle melting and Magmatic processes
Mantle melting and Magmatic processesMantle melting and Magmatic processes
Mantle melting and Magmatic processes
 
Plate tectonics and Magma genesis
Plate tectonics and Magma genesisPlate tectonics and Magma genesis
Plate tectonics and Magma genesis
 
Module 5-ELS.pptx
Module 5-ELS.pptxModule 5-ELS.pptx
Module 5-ELS.pptx
 
Plate tectonics and magma genesis
Plate tectonics and magma genesisPlate tectonics and magma genesis
Plate tectonics and magma genesis
 
Plate tectonics and magma genesis
Plate tectonics and magma genesisPlate tectonics and magma genesis
Plate tectonics and magma genesis
 
Plate tectonics and magma genesis
Plate tectonics and magma genesisPlate tectonics and magma genesis
Plate tectonics and magma genesis
 
The Crust [11EES - Dynamic Earth]
The Crust [11EES - Dynamic Earth]The Crust [11EES - Dynamic Earth]
The Crust [11EES - Dynamic Earth]
 
Geophysics
GeophysicsGeophysics
Geophysics
 
EALS_Earth's Internal Heat.pdf
EALS_Earth's Internal Heat.pdfEALS_Earth's Internal Heat.pdf
EALS_Earth's Internal Heat.pdf
 

More from Raghav Gadgil

7 slopes and slope stability
7 slopes and slope stability7 slopes and slope stability
7 slopes and slope stability
Raghav Gadgil
 
3 geological materials for construction
3 geological materials for construction3 geological materials for construction
3 geological materials for construction
Raghav Gadgil
 
6 site investigation
6 site investigation6 site investigation
6 site investigation
Raghav Gadgil
 
4 foundation geology
4 foundation geology4 foundation geology
4 foundation geology
Raghav Gadgil
 
5 rock properties
5 rock properties5 rock properties
5 rock properties
Raghav Gadgil
 
2 tunnels
2 tunnels2 tunnels
2 tunnels
Raghav Gadgil
 
Ch 11 diversification
Ch 11 diversificationCh 11 diversification
Ch 11 diversification
Raghav Gadgil
 
Ch 03 igneous textures
Ch 03 igneous texturesCh 03 igneous textures
Ch 03 igneous textures
Raghav Gadgil
 
Ch 04 field relationships
Ch 04 field relationshipsCh 04 field relationships
Ch 04 field relationships
Raghav Gadgil
 
Ch 02 igneous classification
Ch 02 igneous classificationCh 02 igneous classification
Ch 02 igneous classification
Raghav Gadgil
 

More from Raghav Gadgil (11)

7 slopes and slope stability
7 slopes and slope stability7 slopes and slope stability
7 slopes and slope stability
 
3 geological materials for construction
3 geological materials for construction3 geological materials for construction
3 geological materials for construction
 
6 site investigation
6 site investigation6 site investigation
6 site investigation
 
4 foundation geology
4 foundation geology4 foundation geology
4 foundation geology
 
5 rock properties
5 rock properties5 rock properties
5 rock properties
 
2 tunnels
2 tunnels2 tunnels
2 tunnels
 
1 dams
1 dams1 dams
1 dams
 
Ch 11 diversification
Ch 11 diversificationCh 11 diversification
Ch 11 diversification
 
Ch 03 igneous textures
Ch 03 igneous texturesCh 03 igneous textures
Ch 03 igneous textures
 
Ch 04 field relationships
Ch 04 field relationshipsCh 04 field relationships
Ch 04 field relationships
 
Ch 02 igneous classification
Ch 02 igneous classificationCh 02 igneous classification
Ch 02 igneous classification
 

Recently uploaded

Comparing Evolved Extractive Text Summary Scores of Bidirectional Encoder Rep...
Comparing Evolved Extractive Text Summary Scores of Bidirectional Encoder Rep...Comparing Evolved Extractive Text Summary Scores of Bidirectional Encoder Rep...
Comparing Evolved Extractive Text Summary Scores of Bidirectional Encoder Rep...
University of Maribor
 
Remote Sensing and Computational, Evolutionary, Supercomputing, and Intellige...
Remote Sensing and Computational, Evolutionary, Supercomputing, and Intellige...Remote Sensing and Computational, Evolutionary, Supercomputing, and Intellige...
Remote Sensing and Computational, Evolutionary, Supercomputing, and Intellige...
University of Maribor
 
DERIVATION OF MODIFIED BERNOULLI EQUATION WITH VISCOUS EFFECTS AND TERMINAL V...
DERIVATION OF MODIFIED BERNOULLI EQUATION WITH VISCOUS EFFECTS AND TERMINAL V...DERIVATION OF MODIFIED BERNOULLI EQUATION WITH VISCOUS EFFECTS AND TERMINAL V...
DERIVATION OF MODIFIED BERNOULLI EQUATION WITH VISCOUS EFFECTS AND TERMINAL V...
Wasswaderrick3
 
Nucleophilic Addition of carbonyl compounds.pptx
Nucleophilic Addition of carbonyl  compounds.pptxNucleophilic Addition of carbonyl  compounds.pptx
Nucleophilic Addition of carbonyl compounds.pptx
SSR02
 
Toxic effects of heavy metals : Lead and Arsenic
Toxic effects of heavy metals : Lead and ArsenicToxic effects of heavy metals : Lead and Arsenic
Toxic effects of heavy metals : Lead and Arsenic
sanjana502982
 
NuGOweek 2024 Ghent programme overview flyer
NuGOweek 2024 Ghent programme overview flyerNuGOweek 2024 Ghent programme overview flyer
NuGOweek 2024 Ghent programme overview flyer
pablovgd
 
Orion Air Quality Monitoring Systems - CWS
Orion Air Quality Monitoring Systems - CWSOrion Air Quality Monitoring Systems - CWS
Orion Air Quality Monitoring Systems - CWS
Columbia Weather Systems
 
如何办理(uvic毕业证书)维多利亚大学毕业证本科学位证书原版一模一样
如何办理(uvic毕业证书)维多利亚大学毕业证本科学位证书原版一模一样如何办理(uvic毕业证书)维多利亚大学毕业证本科学位证书原版一模一样
如何办理(uvic毕业证书)维多利亚大学毕业证本科学位证书原版一模一样
yqqaatn0
 
The use of Nauplii and metanauplii artemia in aquaculture (brine shrimp).pptx
The use of Nauplii and metanauplii artemia in aquaculture (brine shrimp).pptxThe use of Nauplii and metanauplii artemia in aquaculture (brine shrimp).pptx
The use of Nauplii and metanauplii artemia in aquaculture (brine shrimp).pptx
MAGOTI ERNEST
 
Unveiling the Energy Potential of Marshmallow Deposits.pdf
Unveiling the Energy Potential of Marshmallow Deposits.pdfUnveiling the Energy Potential of Marshmallow Deposits.pdf
Unveiling the Energy Potential of Marshmallow Deposits.pdf
Erdal Coalmaker
 
What is greenhouse gasses and how many gasses are there to affect the Earth.
What is greenhouse gasses and how many gasses are there to affect the Earth.What is greenhouse gasses and how many gasses are there to affect the Earth.
What is greenhouse gasses and how many gasses are there to affect the Earth.
moosaasad1975
 
Eukaryotic Transcription Presentation.pptx
Eukaryotic Transcription Presentation.pptxEukaryotic Transcription Presentation.pptx
Eukaryotic Transcription Presentation.pptx
RitabrataSarkar3
 
mô tả các thí nghiệm về đánh giá tác động dòng khí hóa sau đốt
mô tả các thí nghiệm về đánh giá tác động dòng khí hóa sau đốtmô tả các thí nghiệm về đánh giá tác động dòng khí hóa sau đốt
mô tả các thí nghiệm về đánh giá tác động dòng khí hóa sau đốt
HongcNguyn6
 
BREEDING METHODS FOR DISEASE RESISTANCE.pptx
BREEDING METHODS FOR DISEASE RESISTANCE.pptxBREEDING METHODS FOR DISEASE RESISTANCE.pptx
BREEDING METHODS FOR DISEASE RESISTANCE.pptx
RASHMI M G
 
3D Hybrid PIC simulation of the plasma expansion (ISSS-14)
3D Hybrid PIC simulation of the plasma expansion (ISSS-14)3D Hybrid PIC simulation of the plasma expansion (ISSS-14)
3D Hybrid PIC simulation of the plasma expansion (ISSS-14)
David Osipyan
 
THEMATIC APPERCEPTION TEST(TAT) cognitive abilities, creativity, and critic...
THEMATIC  APPERCEPTION  TEST(TAT) cognitive abilities, creativity, and critic...THEMATIC  APPERCEPTION  TEST(TAT) cognitive abilities, creativity, and critic...
THEMATIC APPERCEPTION TEST(TAT) cognitive abilities, creativity, and critic...
Abdul Wali Khan University Mardan,kP,Pakistan
 
原版制作(carleton毕业证书)卡尔顿大学毕业证硕士文凭原版一模一样
原版制作(carleton毕业证书)卡尔顿大学毕业证硕士文凭原版一模一样原版制作(carleton毕业证书)卡尔顿大学毕业证硕士文凭原版一模一样
原版制作(carleton毕业证书)卡尔顿大学毕业证硕士文凭原版一模一样
yqqaatn0
 
ANAMOLOUS SECONDARY GROWTH IN DICOT ROOTS.pptx
ANAMOLOUS SECONDARY GROWTH IN DICOT ROOTS.pptxANAMOLOUS SECONDARY GROWTH IN DICOT ROOTS.pptx
ANAMOLOUS SECONDARY GROWTH IN DICOT ROOTS.pptx
RASHMI M G
 
Travis Hills' Endeavors in Minnesota: Fostering Environmental and Economic Pr...
Travis Hills' Endeavors in Minnesota: Fostering Environmental and Economic Pr...Travis Hills' Endeavors in Minnesota: Fostering Environmental and Economic Pr...
Travis Hills' Endeavors in Minnesota: Fostering Environmental and Economic Pr...
Travis Hills MN
 
DMARDs Pharmacolgy Pharm D 5th Semester.pdf
DMARDs Pharmacolgy Pharm D 5th Semester.pdfDMARDs Pharmacolgy Pharm D 5th Semester.pdf
DMARDs Pharmacolgy Pharm D 5th Semester.pdf
fafyfskhan251kmf
 

Recently uploaded (20)

Comparing Evolved Extractive Text Summary Scores of Bidirectional Encoder Rep...
Comparing Evolved Extractive Text Summary Scores of Bidirectional Encoder Rep...Comparing Evolved Extractive Text Summary Scores of Bidirectional Encoder Rep...
Comparing Evolved Extractive Text Summary Scores of Bidirectional Encoder Rep...
 
Remote Sensing and Computational, Evolutionary, Supercomputing, and Intellige...
Remote Sensing and Computational, Evolutionary, Supercomputing, and Intellige...Remote Sensing and Computational, Evolutionary, Supercomputing, and Intellige...
Remote Sensing and Computational, Evolutionary, Supercomputing, and Intellige...
 
DERIVATION OF MODIFIED BERNOULLI EQUATION WITH VISCOUS EFFECTS AND TERMINAL V...
DERIVATION OF MODIFIED BERNOULLI EQUATION WITH VISCOUS EFFECTS AND TERMINAL V...DERIVATION OF MODIFIED BERNOULLI EQUATION WITH VISCOUS EFFECTS AND TERMINAL V...
DERIVATION OF MODIFIED BERNOULLI EQUATION WITH VISCOUS EFFECTS AND TERMINAL V...
 
Nucleophilic Addition of carbonyl compounds.pptx
Nucleophilic Addition of carbonyl  compounds.pptxNucleophilic Addition of carbonyl  compounds.pptx
Nucleophilic Addition of carbonyl compounds.pptx
 
Toxic effects of heavy metals : Lead and Arsenic
Toxic effects of heavy metals : Lead and ArsenicToxic effects of heavy metals : Lead and Arsenic
Toxic effects of heavy metals : Lead and Arsenic
 
NuGOweek 2024 Ghent programme overview flyer
NuGOweek 2024 Ghent programme overview flyerNuGOweek 2024 Ghent programme overview flyer
NuGOweek 2024 Ghent programme overview flyer
 
Orion Air Quality Monitoring Systems - CWS
Orion Air Quality Monitoring Systems - CWSOrion Air Quality Monitoring Systems - CWS
Orion Air Quality Monitoring Systems - CWS
 
如何办理(uvic毕业证书)维多利亚大学毕业证本科学位证书原版一模一样
如何办理(uvic毕业证书)维多利亚大学毕业证本科学位证书原版一模一样如何办理(uvic毕业证书)维多利亚大学毕业证本科学位证书原版一模一样
如何办理(uvic毕业证书)维多利亚大学毕业证本科学位证书原版一模一样
 
The use of Nauplii and metanauplii artemia in aquaculture (brine shrimp).pptx
The use of Nauplii and metanauplii artemia in aquaculture (brine shrimp).pptxThe use of Nauplii and metanauplii artemia in aquaculture (brine shrimp).pptx
The use of Nauplii and metanauplii artemia in aquaculture (brine shrimp).pptx
 
Unveiling the Energy Potential of Marshmallow Deposits.pdf
Unveiling the Energy Potential of Marshmallow Deposits.pdfUnveiling the Energy Potential of Marshmallow Deposits.pdf
Unveiling the Energy Potential of Marshmallow Deposits.pdf
 
What is greenhouse gasses and how many gasses are there to affect the Earth.
What is greenhouse gasses and how many gasses are there to affect the Earth.What is greenhouse gasses and how many gasses are there to affect the Earth.
What is greenhouse gasses and how many gasses are there to affect the Earth.
 
Eukaryotic Transcription Presentation.pptx
Eukaryotic Transcription Presentation.pptxEukaryotic Transcription Presentation.pptx
Eukaryotic Transcription Presentation.pptx
 
mô tả các thí nghiệm về đánh giá tác động dòng khí hóa sau đốt
mô tả các thí nghiệm về đánh giá tác động dòng khí hóa sau đốtmô tả các thí nghiệm về đánh giá tác động dòng khí hóa sau đốt
mô tả các thí nghiệm về đánh giá tác động dòng khí hóa sau đốt
 
BREEDING METHODS FOR DISEASE RESISTANCE.pptx
BREEDING METHODS FOR DISEASE RESISTANCE.pptxBREEDING METHODS FOR DISEASE RESISTANCE.pptx
BREEDING METHODS FOR DISEASE RESISTANCE.pptx
 
3D Hybrid PIC simulation of the plasma expansion (ISSS-14)
3D Hybrid PIC simulation of the plasma expansion (ISSS-14)3D Hybrid PIC simulation of the plasma expansion (ISSS-14)
3D Hybrid PIC simulation of the plasma expansion (ISSS-14)
 
THEMATIC APPERCEPTION TEST(TAT) cognitive abilities, creativity, and critic...
THEMATIC  APPERCEPTION  TEST(TAT) cognitive abilities, creativity, and critic...THEMATIC  APPERCEPTION  TEST(TAT) cognitive abilities, creativity, and critic...
THEMATIC APPERCEPTION TEST(TAT) cognitive abilities, creativity, and critic...
 
原版制作(carleton毕业证书)卡尔顿大学毕业证硕士文凭原版一模一样
原版制作(carleton毕业证书)卡尔顿大学毕业证硕士文凭原版一模一样原版制作(carleton毕业证书)卡尔顿大学毕业证硕士文凭原版一模一样
原版制作(carleton毕业证书)卡尔顿大学毕业证硕士文凭原版一模一样
 
ANAMOLOUS SECONDARY GROWTH IN DICOT ROOTS.pptx
ANAMOLOUS SECONDARY GROWTH IN DICOT ROOTS.pptxANAMOLOUS SECONDARY GROWTH IN DICOT ROOTS.pptx
ANAMOLOUS SECONDARY GROWTH IN DICOT ROOTS.pptx
 
Travis Hills' Endeavors in Minnesota: Fostering Environmental and Economic Pr...
Travis Hills' Endeavors in Minnesota: Fostering Environmental and Economic Pr...Travis Hills' Endeavors in Minnesota: Fostering Environmental and Economic Pr...
Travis Hills' Endeavors in Minnesota: Fostering Environmental and Economic Pr...
 
DMARDs Pharmacolgy Pharm D 5th Semester.pdf
DMARDs Pharmacolgy Pharm D 5th Semester.pdfDMARDs Pharmacolgy Pharm D 5th Semester.pdf
DMARDs Pharmacolgy Pharm D 5th Semester.pdf
 

Ch 01 intro

  • 1. IgneousIgneous PetrologyPetrology Thanks to John WinterThanks to John Winter 1
  • 2. IntroductionIntroduction Igneous petrology is the study of melts (magma) and the rocks that crystallize from such melts, encompassing an understanding of the processes involved in melting and subsequent rise, evolution, crystallization, and eruption or emplacement of the eventual rocks. 2
  • 3. All terrestrial rocks that we now find at earths surface were derived initially from the mantle, although some have gone cycles of sedimentation and metamorphism. If these rocks have ultimate origin at depth, it follows that we need to know what makes up the earth if we want to understand their origin more fully. Compositionally there is crust, mantle and core delineated by seismic discontinuities. The Earth’s InteriorThe Earth’s Interior 3
  • 4. The Earth’s InteriorThe Earth’s Interior Crust: Oceanic crust: Basaltic Thin: 10 km Relatively uniform stratigraphy = ophiolite suite: sediments pillow basalt sheeted dikes more massive gabbro ultramafic (mantle) Plate tectonics is creating oceanic crust at mid-ocean ridges and consuming it at subduction zones, the oceanic crust is continually being renewed and recycled. 4
  • 5. The Earth’s InteriorThe Earth’s Interior Continental Crust Thicker: 20-90 km average ~35 km Highly variable composition Average ~ granodiorite Covers ~40% of earths surface The amount of continental crust has been increasing over the past 4 Ga. The stable continents (Cratons) consist of more ancient shield and stable platforms. several marginal orogenic belts also flank many cratons. 5
  • 6. The Earth’s InteriorThe Earth’s Interior Mantle: 83% of earth’s volume Peridotite (ultramafic) There are layers distinguished by more physical rather than chemical differences. 80-220km-LVZ-1-5% Partial melting. The melt probably forms thin discontinuous film along mineral grain boundaries. It makes mantle behave in a more ductile fashion. 6
  • 7. The Earth’s InteriorThe Earth’s Interior Below the LVZ, 2 more seismic discontinuities are encountered. Upper to 410 km (olivine → spinel) Low Velocity Layer 60-220 km Transition Zone as velocity increases ~ rapidly 660 spinel → perovskite-type SiIV → SiVI Both these discontinuities result in abrupt increase in the density of the mantle, accompanied by a jump in seismic velocities. 7
  • 8. The Earth’s InteriorThe Earth’s Interior Below 660-km discontinuity, the velocities of seismic waves increase fairly uniformly with depth. At the very base of mantle is a ~200km thick heterogenous layer of anomalously low seismic velocity called the D” layer. A thin ~40km, apparently discontinuous layer has been recently resolved at the mantle-core boundary, clearly beneath central Pacific. The nature of these 2 layers is not clear, but their properties are sufficiently anomalous to require more than a thermal boundary perturbation, and they probably represent layer of different composition, probably dense ‘dregs’ of subducted oceanic lithosphere that have settled at the base of lower mantle. 8
  • 9. The Earth’s InteriorThe Earth’s Interior Core: Silicates of the mantle give way to a much denser Fe rich metalic alloy with minor amounts of Ni, S, Si, O etc. Outer Core is liquid No S-waves Inner Core is solid Figure 1.2 Major subdivisions of the Earth. Winter (2001) An Introduction to Igneous and Metamorphic Petrology. Prentice Hall. 9
  • 10. Figure 1.3 Variation in P and S wave velocities with depth. Compositional subdivisions of the Earth are on the left, rheological subdivisions on the right. After Kearey and Vine (1990), Global Tectonics. © Blackwell Scientific. Oxford. 10
  • 11. The PressureThe Pressure GradientGradient P increases = ρgh Hydrostatic pressure=lithostatic pressure Density increases with depth as the rocks are compressed Figure 1.8 Pressure variation with depth. From Dziewonski and Anderson (1981). Phys. Earth Planet. Int., 25, 297-356. © Elsevier Science. 12
  • 12. The PressureThe Pressure GradientGradient P increases = ρgh Nearly linear through mantle ~ 30 MPa/km ≈ 1 GPa at base of ave crust Core: ρ incr. more rapidly since alloy more dense Figure 1.8 Pressure variation with depth. From Dziewonski and Anderson (1981). Phys. Earth Planet. Int., 25, 297-356. © Elsevier Science. 13
  • 13. Heat SourcesHeat Sources in the Earthin the Earth 1. Heat from the early accretion and differentiation of the Earth (Secular cooling) Primordial heat developed early in the history of the Earth from the processes of accretion and gravitational differentiation Some continued gravitational partitioning of iron in the inner core may contribute some heat as well. Estimates are 10-25% of total heat flux 14
  • 14. Heat SourcesHeat Sources in the Earthin the Earth 2. Heat released by the radioactive breakdown of unstable nuclides • Most of the radioactive elements are concentrated in the continental crust. • 75-90% heat is produced that reaches the surface 15
  • 15. Heat TransferHeat Transfer 1. Radiation: Sufficiently transparent or translucent material can transfer heat by radiation. It is the movement of the particles/waves through another medium. Eg. Lamp losing heat or surface of the earth losing heat. 2. Conduction: Opaque and rigid substances transfer heat by conduction. It involves transfer of kinetic energy from hotter atoms to adjacent cooler ones. It is efficient for metals. Conduction is poor for silicate minerals but relatively efficient in the core. 16
  • 16. Heat TransferHeat Transfer 3. Convection: If the material is more ductile and if it can be moved, this is the process. It is the movement of material due to density differences caused by thermal or compositional variations. 17
  • 17. Heat TransferHeat Transfer 3. Convection: It affects ductile rocks and liquids. • It may involve flow in a single direction, in which case the moved hot material will accumulate at the top of the ductile portion of the system. • Convection may also occur in a cyclic motion, typically in a closed cell above a localized heat source. • Here, the heated material rises and moves laterally as it cools and is pushed aside by later convective matter. • Material pushed to the margin cools, contracts, and sinks towards the heat source, where it becomes heated and cycle continues. 18
  • 18. Heat TransferHeat Transfer 3. Advection: • It involves the transfer of heat with rocks that are otherwise in motion. • For eg, if a hot region at depth is uplifted by either tectonism, induced flow or erosion and isostatic rebound, heat rises physically with the rocks. • All rocks, whether igneous, sedimentary or metamorphic, owe their origins directly or indirectly to the advective cooling of the earth. • The rise of magma into the crust or its extrusion onto the surface is an obvious example of advection. 19
  • 19. The Geothermal GradientThe Geothermal Gradient • Convection works well in the liquid core and in the somewhat fluid mantle. • It is also a primary method of heat transfer in hydrothermal systems above magma bodies. • Beyond these areas, conduction and advection are the only available methods of heat transfer. • Transfer of heat controls metamorphism, melting, crystallization, as well as the motion, mixing and mechanical properties of Earth materials. • We will consider heat transfer later. 20
  • 20. The Geothermal GradientThe Geothermal Gradient Diagrammatic cross-section through the upper 200-300 km of the Earth showing geothermal gradients reflecting more efficient adiabatic (constant heat content) convection of heat in the mobile asthenosphere (steeper gradient in blue) ) and less efficient conductive heat transfer through the more rigid lithosphere (shallower gradient in red). The boundary layer is a zone across which the transition in rheology and heat transfer mechanism occurs (in green). The thickness of the boundary layer is exaggerated here for clarity: it is probably less than half the thickness of the lithosphere. Convection in the mantle redistributes heat more faster than conduction 21
  • 21. The Geothermal GradientThe Geothermal Gradient A similar example for thick (continental) lithosphere. The curved part of the geotherm represents a zone of gradual transition – boundary layer – where, as temperature rises, rocks become progressively more ductile and begin to participate in convection. 22
  • 22. The Geothermal GradientThe Geothermal Gradient Notice that thinner lithosphere allows convective heat transfer to shallower depths, resulting in a higher geothermal gradient across the boundary layer and lithosphere. TP is the potential temperature. It permits comparison of (estimated) temperatures at depth from one locality to another. Because temperature varies with depth, one must select some reference depth. In this case the surface was chosen. One simply extrapolates adiabatically from the T and P in question to the surface. Potential temperature, is the hypothetical surface temperature a deeply buried rock would end up at if it were transported to the surface along the adiabat passing through PT , without melting. 23
  • 23. The Geothermal GradientThe Geothermal Gradient Figure 1.10 Temperature contours calculated for an oceanic plate generated at a mid-ocean ridge (age 0) and thickening as it cools. The 1300o C isotherm is a reasonable approximation for the base of the oceanic lithosphere. The plate thickens rapidly from zero to 50 Ma and is essentially constant beyond 100 Ma. From McKenzie et al. (2005). 26
  • 24. The Geothermal GradientThe Geothermal Gradient Figure 1.11 Estimates of oceanic (blue curves) and continental shield (red curves) geotherms to a depth of 300 km. The thickness of mature (> 100Ma) oceanic lithosphere is hatched and that of continental shield lithosphere is yellow. • Because the thermal conductivity of shallow crustal rocks is low, heat transfer is slow. Extrapolating this leads to very high geothermal gradient. 27
  • 25. The Geothermal GradientThe Geothermal Gradient • Shallow gradients in old oceanic lithosphere range from about 17- 200 C/Km, gradually steepening to about 70 C/Km with depth. • Shallow shield gradients range from about 12-180 C/Km, transitioning to about 4-60 C/Km below about 30Km. • The oceanic v/s shield temperature differences are essentially restricted to the lithosphere and boundary layer, so the oceanic and continental curves converge by about 250-300Km where convection has homogenizing influence. 28
  • 26. The Geothermal GradientThe Geothermal Gradient Figure 1.12 Estimate of the geothermal gradient to the center of the Earth (after Stacey, 1992). The shallow solid portion is very close to the Green & Ringwood (1963) oceanic geotherm in Fig. 1–11 and the dashed geotherm is the Jaupart & Mareschal (1999) continental geotherm. • Nearly adiabatic convective heat flow deeper than about 300Km results in a linear geothermal gradient of approx. 0.30 C/Km. • The gradient shallows across the D” layer and then becomes steep in the metallic core, where the thermal conductivity and convection is very high. 29
  • 27. The Geothermal GradientThe Geothermal Gradient • The density contrast across the core-mantle boundary prohibits the core material from rising into the mantle, so heat can only be transferred upward by conduction, resulting in a thermal boundary layer across which the thermal gradient is estimated to be 300 – 10000 C. 30
  • 28. The geothermal gradientThe geothermal gradient The rate of convective flow in the mantle is measured in terms of cms/year. Slabs of cooler oceanic lithosphere, mostly mantle rock, too viscous to convect within themselves, sink into the underlying hotter and relatively less dense underlying mantle. Computed tomography of the Earth using seismic waves has shown that at least some subducting lithospheric slabs sink all the way through the mantle and come to rest on top of the dense metallic core 31
  • 29. Even though the rate at which the mantle convects, on the order of a few centimeters/year, seems minuscule, it is far greater than the rate of heat transfer by conduction. The fact that lithospheric slabs can sink convectively over tens of millions of years about 2800 km through the hotter mantle but still maintain a recognizable cooler T throughout their approximately 100-km thickness demonstrates how slowly they are conductively heated. Conversely, if heat conduction were more rapid than convection, the subducting slabs would absorb heat and lose their density contrast and identity before sinking very far. 32
  • 30. 33
  • 31. Dynamic cooling of the earthDynamic cooling of the earth Previous figure was intended to illustrate the thermal structure at shallow levels of Earth’s interior in stabilized areas, similar to a static, chemically and physically stratified earth with continents and oceans. The earth is far more dynamic. Temperature variations that drive convective flow are concentrated in thin boundary layers that are much smaller than the overall circulation pattern. The upper boundary of this system is a cool thermal boundary layer with low viscosity: the lithosphere. 34
  • 32. Dynamic cooling of the earthDynamic cooling of the earth In laboratory models of convecting fluids, cool dense upper thermal boundary layer descend as either cylindrical downwellings or as larger networks of partially connected tabular-shaped downwelling slabs, depending on the rheology of the material. It generally leads to slab-like downwelling. Mantle convection and plate tectonics are inseparable manifestations of the heat-driven dynamic cooling process of the Earth, given its present thermal state and rheological properties. For the Earth, plate tectonics is mantle convection. 35
  • 33. Plate tectonicsPlate tectonics The negative buoyancy of the descending plates has been called slab pull, dense subducting slab pulls the rest of the plate after it. The motion of the lithospheric plates down and away from the elevated mid- oceanic ridges is called as ridge-push. Both are body forces affecting whole plate. As the subducting slab descends, the slab cant pull significantly on the rest of the plate, which would simply fault and break. 36
  • 34. Plate tectonicsPlate tectonics Instead, as it sinks, the slab sets up circulation patterns in the mantle that exert a sort of suction force. As the slab descends from the surface, the pressure behind it is lowered, which is immediately compensated by feeding more plate into the subduction zone. 37
  • 35. Dynamic cooling of the earthDynamic cooling of the earth Ridge push is gravitational sliding of a plate off the elevated ridge, not an active mantle push by ascending mantle flow, which would buckle the plate. Plate motion velocities are roughly proportional to the percentage of plate’s perimeter that corresponds to subduction zones and not to ridges (Forsyth & Uyeda, 1975) The predominance of slab pull suggest that mantle upwelling at divergent plate boundaries, which moves heat upward, is essentially a passive response to plate separation and descent. 38
  • 36. TheThe GeothermalGeothermal GradientGradient Fig 1.13. Pattern of global heat flux variations compiled from observations at over 20,000 sites and modeled on a spherical harmonic expansion to degree 12. From Pollack, Hurter and Johnson. (1993) Rev. Geophys. 31, 267-280. Cross-section of the mantle based on a seismic tomography model. Arrows represent plate motions and large-scale mantle flow and subduction zones represented by dipping line segments. EPR =- East pacific Rise, MAR = Mid-Atlantic Ridge, CBR = Carlsberg Ridge. Plates: EA = Eurasian, IN = Indian, PA = Pacific, NA = North American, SA = South American, AF = African, CO = Cocos. From Li and Romanowicz (1996). J. Geophys. Research, 101, 22,245-72. 39
  • 37. TheThe GeothermalGeothermal GradientGradient Thermal structure in a 3D spherical mantle convection model (red is hot, blue is cold). J. H. Davies and H.-Peter Bunge http://www.ocean.cf.ac.uk/people/huw/AG U99/mantlecirc.html 40
  • 38. Dynamic cooling of the earthDynamic cooling of the earth What happens at other deeper boundary? The density more than doubles from lower mantle to the core, thus preventing convection across the boundary, regardless of thermal differences. The liquid outer core must be internally convecting to produce Earth’s magnetic field. The D” layer may be the resulting mantle side thermal boundary layer, across which the temperature gradient is estimated to be 300 to 10000 C. Convection within the mantle results from thermal instabilities as the heated by D” layer becomes positively buoyant. 43
  • 39. Dynamic cooling of the earthDynamic cooling of the earth The viscosity is much lower than that of the plates at such elevated temperatures, and the instabilities take the alternative form of rising cylindrical plumes rather than slabs. These plumes are more of an active upwelling, in comparison to the more passive shallow mantle rise in response to plate separation. The plumes appear to be largely independent of plate tectonics, but in many cases are sufficiently vigorous to penetrate the lithosphere and reach the Earth’s surface, where they result in hotspot activity. Plate tectonics thus appears to be the method by which a largely internally heated and viscous mantle cools by convection, whereas plumes essentially cool the core and have an increasing effect on lower mantle. 44
  • 40. Dynamic cooling of the earthDynamic cooling of the earth Even general model of mantle convection depends on the influence of 660-km phase transition. Some investigators consider the density contrast across the boundary insufficient to impede convection, so there is whole mantle convection. Others believe the 660-km transition can impede convection, so that warm, buoyant mantle material in rising portions of deep convection cells would be less buoyant than the material above transition, causing the rising material to spread laterally instead. If so, heat can transfer across the boundary only by conduction, inducing convection in the upper mantle. 45
  • 41. Figure 1.14. Schematic diagram of a 2- layer dynamic mantle model in which the 660 km transition is a sufficient density barrier to separate lower mantle convection (arrows represent flow patterns) from upper mantle flow, largely a response to plate separation. The only significant things that can penetrate this barrier are vigorous rising hotspot plumes and subducted lithosphere (which sink to become incorporated in the D" layer where they may be heated by the core and return as plumes). Plumes in core represent relatively vigorous convection (see Chapter 14). After Silver et al. (1988). Mantle dynamicsMantle dynamics Is the 660 km transition a barrier to whole-mantle convection? Maybe? Partly? No? 46
  • 42. Mantle dynamicsMantle dynamics The 660-km boundary layer in such models allows some material transfer but impedes wholesale mantle convection from homogenizing the full vertical extent of the mantle and thus permits the composition of the shallow and deep mantle to evolve independently. 47
  • 43. Plate Tectonic - Igneous GenesisPlate Tectonic - Igneous Genesis 1. Mid-Ocean Ridges 2. Intracontinental Rifts 3. Island Arcs 4. Active Continental Margins 5. Back-Arc Basins 6. Ocean Island Basalts 7. Miscellaneous Intra- Continental Activity kimberlites, carbonatites, anorthosites... 49

Editor's Notes

  1. Myron Best: The difference in T between adjacent hotter and cooler masses, called the thermal gradient, is reduced and may eventually be eliminated over sufficient time, provided heat is not restored to the hotter mass. The rate at which heat is conducted over time from a unit surface area, called the heat flux or heat flow, is the product of the thermal gradient and the thermal conductivity, or heat flow = thermal conductivity x thermal gradient. Because of their extremely low thermal conductivity, compared with that of familiar metals, rocks are considered to be thermal insulators. All other factors being equal, copper conducts heat nearly 200 times faster than rock. Because of the low thermal conductivity of rock and the large dimension of the Earth (radius about 6370 km), little heat has been conducted from the deep interior over the lifetime (4.5 Ga) of the Earth (Verhoogen, 1980).
  2. 1. Radiation Requires transparent medium Rocks aren’t (except perhaps at great depth) 2. Conduction Rocks are poor conductors Very slow 3. Convection Material movement (requires ductility) Heat-induced expansion and buoyancy Much more efficient than conduction
  3. Convection from Myron Best: Movement of material having contrasting temperatures from one place to another is convection. Movement is caused by significant differences in density of different parts of the material so that, under the influence of gravity, less dense expanded material rises and more dense sinks. Density contrasts driving convection can also be related to contrasts in composition. For example, surface evaporation of water in saline lakes in hot arid regions increases the surface salt concentration, making the water more dense and causing it to sink, even though it may be warmer than underlying less saline water. It should be emphasized that, unlike heat transfer by radiation and conduction, convection depends upon gravity. Without gravity, there is no buoyancy force to act on density contrasts that move matter.
  4. But so is the development of contact metamorphic minerals through endothermic reactions. Similarly cold, crustal rocks that are buried and undergo regional metamorphism, which is largely endothermic, and then return to the surface of the earth provide another means of advectively removing heat from planet’s interior. Most metamorphic reactions involve the liberation of fluids. The upward flux of these hot fluids from metamorphic terranes is still another means of advectively cooling of earth. (Chapter 23 of Anthony R Philpotts) Advection: (Myron Best): Advection involves flow of a liquid through openings in a rock whose T is different from that of the liquid. Because all rocks near the surface of the Earth are fractured on some scale and because these fractures are, at least partly, filled with water, advection is a significant heat transfer process. For eg, hot water heated by nearby magmatic intrusion advects through cracks in cooler rocks, heating it while moderating the T of water. The greater heat capacity of water than of rock makes advective heat transport more effective. Advective heat transfer is also important where magma invades a cooler rock.
  5. Continental Gradient higher than Oceanic Gradient Range for both Highest at Surface water and cold surface In the future we will often use average values rather than the ranges
  6. The passage of seismic waves through the mantle demonstrates that it reacts as a solid to abrupt stress changes. The mantle is therefore solid, but the sub-lithospheric mantle is capable of flow when subject to slower stress changes, such as those associated with heating. Heat is thus transported more effectively by convection at depth but only by conduction across the stagnant rigid lithosphere. Both the conductive and convective geothermal gradients are nearly constant (linear) but of different magnitudes. Deep convection is sufficiently rapid that no heat is lost by conduction to the surroundings, so heat is retained within the rising material. Processes in which heat is neither lost nor gained are called adiabatic processes. Rheology (/riːˈɒlədʒi/; from Greek ῥέω rhéō, "flow" and -λoγία, -logia, "study of") is the study of the flow of matter, primarily in a liquid state, but also as 'soft solids' or solids under conditions in which they respond with plastic flow rather than deforming elastically in response to an applied force.
  7. Continental Gradient higher than Oceanic Gradient Range for both Highest at Surface water and cold surface In the future we will often use average values rather than the ranges
  8. Continental Gradient higher than Oceanic Gradient Range for both Highest at Surface water and cold surface In the future we will often use average values rather than the ranges
  9. The transition from rigid (lithospheric) to ductile (aesthenospheric) behavior is in the 1300 to 14000C range so the 13000C isotherm can be used as an approximation for the base of the oceanic lithospheric plate. The plate thus thickens from about 50 km at the ridge to about ~110 km at “maturity” of ~100 Ma, beyond which it essentially remains constant in thickness and thermal structure.
  10. As expected, the geothermal gradient is higher in the ocean setting than in the continental cratons because the oceanic lithosphere is thinner.
  11. As expected, the geothermal gradient is higher in the ocean setting than in the continental cratons because the oceanic lithosphere is thinner.
  12. Continental Gradient higher than Oceanic Gradient Range for both Highest at Surface water and cold surface In the future we will often use average values rather than the ranges
  13. Continental Gradient higher than Oceanic Gradient Range for both Highest at Surface water and cold surface In the future we will often use average values rather than the ranges
  14. Top text from Myron Best pg. 6-7
  15. Myron Best
  16. Plate tectonics by Wolfgang, Meschede and Blakey pg26
  17. Calculations of the excess heat required to create such swells have yeilded estimates of the total heat transported by plumes, which agree with the estimates of the heat flux from the core to the mantle (10%) plate tectonics thus appears to be the method by which a largely internally heated and viscous mantle cools by convection, whereas plumes essentially cool the core and have an increasing effect on lower mantle.
  18. From Alexander McBirney: The mantle is thought to turn over slowly, transferring heat generated in the core and in the mantle itself to the asthenosphere and to the lithosphere. The temperature within any convecting horizon is probably close to an adiabatic gradient. That is to say, the heat content of the rocks remains nearly constant while temperature varies with pressure, much as it does in Earth’s atmosphere, where the temperature descreases as air rises and expands but it increases as it descends and is compressed. And just as the temperature of air is buffered by the heat absorbed or released when water vaporizes or condenses, the temperature of the mantle must be moderated by the heat absorbed or released when minerals melt, crystallize or change their crystalline structure in response to changes in pressure.
  19. Continental Gradient higher than Oceanic Gradient Range for both Highest at Surface water and cold surface In the future we will often use average values rather than the ranges
  20. Myron Best: Associated with focused magmatic activity is the concept of petrotectonic associations: that specific types of rocks are found together in specific tectonic regimes. Although basaltic rocks composed mostly of plagioclase and pyroxene are created in most of the tectonic settings, there are significant differences from one tectonic regime to another in their chemical compositions, particularly in so-called trace elements such as Sr, Ba, Ta, and Nb. Also, the types of associated rocks are different. For example, andesites are common in convergent plate subduction zones but are essentially absent at oceanic spreading ridges. Rhyolites and their plutonic granitic rock counterparts are widespread along continental margin subduction zones but rare where two oceanic lithospheric plates converge, as in the island arcs of the western Pacific.