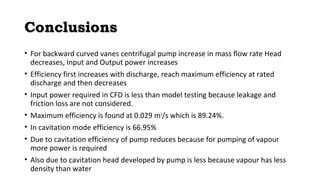
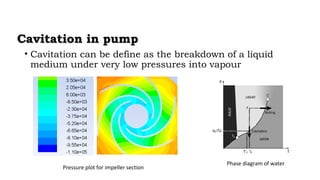
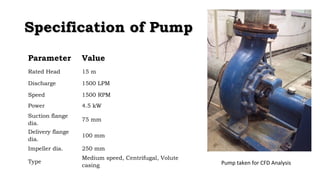
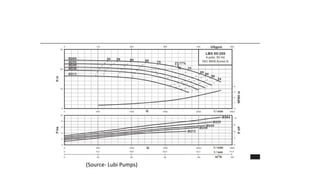
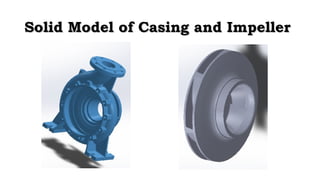
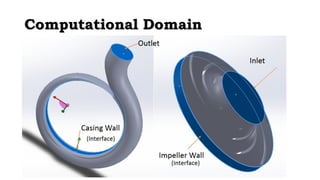
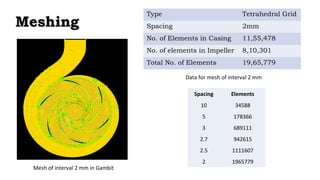
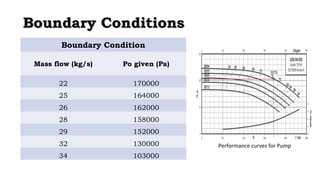
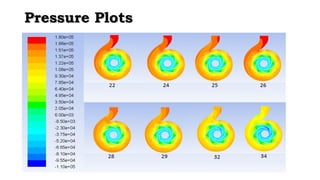
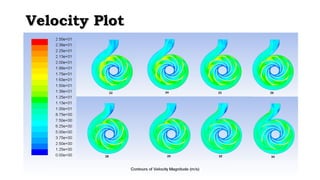
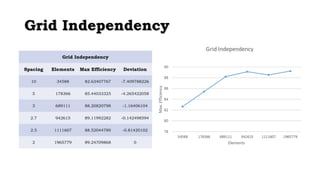
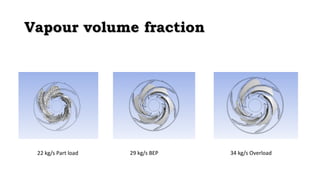
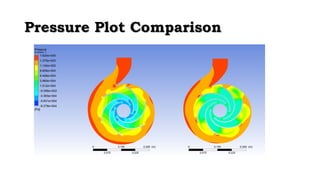
This document summarizes a CFD analysis of a centrifugal pump. The objectives were to analyze the pump at different flow conditions, plot characteristic curves, and analyze cavitation. The analysis used ANSYS Fluent and CFX to model the solid pump components with over 19 million mesh elements. Boundary conditions were applied to simulate flow rates from 22 to 34 kg/s. Results showed maximum efficiency of 89.24% occurring at the design flow rate, and lower efficiency under cavitation due to higher power needs to pump vapor. Pressure and velocity plots as well as performance curves matched published literature values.
![PPeerrffoorrmmaannccee CCuurrvveess
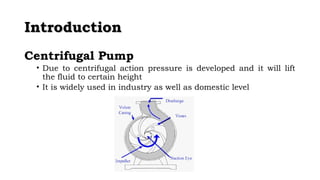
Patel and Ramakrishnan [1]](https://image.slidesharecdn.com/gcsag64mrsw984vkagmo-signature-c3408ada46d31d2e554f3c61098f6a1bad7d3f8ca15c3e282c2a2b332035b172-poli-141002230724-phpapp01/85/Cfd-analysis-of_centrifugal_pump-17-320.jpg)
![PPeerrffoorrmmaannccee CCuurrvveess
Patel and Ramakrishnan [1]](https://image.slidesharecdn.com/gcsag64mrsw984vkagmo-signature-c3408ada46d31d2e554f3c61098f6a1bad7d3f8ca15c3e282c2a2b332035b172-poli-141002230724-phpapp01/85/Cfd-analysis-of_centrifugal_pump-18-320.jpg)
![PPeerrffoorrmmaannccee CCuurrvveess
Patel and Ramakrishnan [1]](https://image.slidesharecdn.com/gcsag64mrsw984vkagmo-signature-c3408ada46d31d2e554f3c61098f6a1bad7d3f8ca15c3e282c2a2b332035b172-poli-141002230724-phpapp01/85/Cfd-analysis-of_centrifugal_pump-19-320.jpg)