Download to read offline
![International Journal of Modern Engineering Research (IJMER)
www.ijmer.com Vol.3, Issue.2, March-April. 2013 pp-944-948 ISSN: 2249-6645
Water Susceptible Properties of Silt Loam Soil in Sub grades
in South West Pennsylvania
Robert M. Brooks, 1 Mehmet Cetin2
1
Corresponding Author, Associate Professor, Department of Civil and Environmental Engineering, Temple University, USA,
2
Ph.D. Student, Department of Civil and Environmental Engineering, Temple University, USA,
Abstract: Water susceptible properties of subgrade soils play important role in the structural design of highways. In this
research study laboratory investigations were conducted on subgrade soil samples for determining the influence of water
susceptible properties on Natural moisture content, Optimum moisture content, Compaction, California Bearing Ratio
(CBR)-soaked and unsoaked, and Unconfined Compression Strength (UCS). All tests were done using appropriate ASTM
standards. Relationships were developed using regression equations for predicting the performance of seven engineering
variables.
Key Words: Water Absorption characteristics, Engineering Properties, Optimum Moisture Content, CBR, UCS.
I. INTRODUCTION
Water is an enemy of road materials. This is because water plays an important role in causing cumulative damage of
road structure over time. Because of high water absorption property silt loam poses performance problems especially under
heavy loads over longer periods of time. The problem is aggravated during rainy season because of significant loss of
bearing capacity and shear strength of the subgrade material [1, 2, 3]. These losses in the subgrade material will translate into
the loss of structural performance of the road itself. Silt loam soils are found on and around the river beds in Southwest
Pennsylvania. In these regions many rural roads are usually constructed on compacted silt loam soils. Therefore, there is
need to study in detail the influence of water susceptibility on various engineering properties of this material as applicable to
Southwest Pennsylvania. This research study attempts to determine relationship between the degree of water absorption of
loam soils at subgrade level and essential engineering properties.
II. MATERIALS AND METHODS
Twenty samples were collected at 3 feet depth of the subgrade soil of US 19 near Pittsburg.
The following laboratory tests were conducted on the soil according to the ASTM standards.
1. Grain size distribution (wet/dry sieving),
2. Soil classification, ASTM D2487 – 11 [4]
3. Natural moisture content, ASTM D2216 – 10 [5]
4. Optimum moisture content ASTM D558 – 11 [6]
5. Compaction test, ASTM D 698, D 1557 [7]
6. California Bearing Ratio (CBR) – soaked and unsoaked, ASTM D1883 - 07e2 and [8]
7. Unconfined Compression Strength (UCS). ASTM D2166 – 06 [9]
The following statistical tests were conducted to establish the mean values and associated variances of the parameters. The
variances were determined for inter and intra-groups of samples at a statistical significance of α = 0.05.
1. One-way Analysis of Variance (ANOVA)
2. Two-way ANOVA
Seven regression equations were established showing the influence of independent variable on the dependent variable.
For each regression equation correlation coefficient was determined. The correlation coefficient was significant at α = 0.05
level for the following correlated quantities: Swell and UCS, Swell and CBR (soaked), Void Ratio and MDD, Shrinkage
limit and liquid limit, Clay content and NMC.
The correlation coefficient was significant at α = 0.01 level for the following correlated quantities: Swell and CBR
(unsoaked), Plasticity index, and Shrinkage limit. All the significance tests were done at 2 tailed tests.
III. RESULTS AND DISCUSSIONS
3.1 Soil Classification
As per the ASTM D 2487 [4] standard the Unified Soil Classification System was used in classifying the soils. 57%
of the samples were classified as inorganic sandy clays of low to medium plasticity (CL). Others were classified as elastic
silt (MH).
www.ijmer.com 944 | Page](https://image.slidesharecdn.com/ce32944948-130405014851-phpapp02/85/Ce32944948-1-320.jpg)
![International Journal of Modern Engineering Research (IJMER)
www.ijmer.com Vol.3, Issue.2, March-April. 2013 pp-944-948 ISSN: 2249-6645
3.2 Comparison of Sections
Comparison of the mean values of many of the geotechnical properties of soils beneath the stable and unstable
sections of roads in the region revealed that there was significant differences shown in the results of California Bearing Ratio
(CBR) and Maximum Dry Density (MDD), swell and UCS.The high values for these properties were due to the presence of
high clay content (though statistically insignificant in difference) and low degree of compaction of the subgrade.
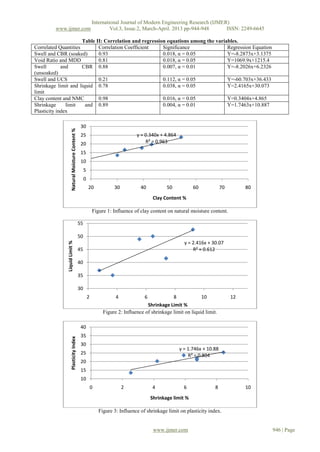
3.3 Natural Moisture and Clay Contents
The minimum and maximum natural moisture contents were 10% and 24% respectively as shown in Table I. The
mean moisture content was 17%. The minimum and maximum clay contents were18 and 54% respectively. The mean clay
content was 38%. Alinear correlation with R = 0.98 was established between the clay content and the natural moisture
content as shown in Table II and Fig. 1. The correlations between shrinkage limit and liquid limit; and shrinkage limit and
plasticity index were R = 0.78 and R = 0.89 [10,11,12] respectively as shown in Fig. 2 and Fig.3.The correlation established
in this study indicates that the clay content has a strong positive influence on water content. Other researchers established
that there is strong attraction between the water and the clay particles. This is because the high ratio of particles surface to
particle mass for clay soils attracts large amount of water [13].
3.4 Void Ratio and MDD
The minimum and maximum void ratio was 0.44 and 0.65 respectively as shown in Table I. The mean void ratio
was 0.52. The minimum and maximum MDD were 1594 kg/m3 and 1884 kg/m3respectively. The mean MDD was 1788
kg/m3. A linear correlation with R = 0.81 was established between the void ratio and MDD as shown in Table II and Fig.4.
The void ratio has a linear relationship with the Maximum Dry Density (MDD). The core The soil void increased rather than
decrease as shown by the laboratory compaction tests ASTM D 698 and D 1557 [7] as shown in Fig. 4. The results indicate
that adequate field compaction was not obtained.
3.5 Swell, CBR and UCS
The minimum and maximum Swell were 0.02 and 0.267 respectively as shown in Table I. The mean Swell was
0.14. The minimum and maximum CBR unsoaked were 3% and 6% respectively. The mean CBR unsoaked was 4%. A
linear correlation with R = 0.88 was established between Swell and CBR unsoaked as sown in Table II and Fig. 5. The
minimum and maximum CBR soaked were 1% and 3% respectively. The mean CBR soaked was 2%. A linear correlation
with R = 0.93 was established between Swell and CBR soaked as shown in Fig. 6.
The minimum and maximum UCS were 16 KN/m2 and 63 KN/m2 respectively. The mean Swell was 28 KN/m2. A
linear correlation with R = 0.21 was established between Swell and UCS as shown in Fig. 7.
It is important to note that swell has a negative influence on the CBR unsoaked and CBR soaked. This means that a
swell % increased both CBR unsoaked and CBR soaked decreased indicating strength loss. Similarly swell has negative
influence on the UCS indicating strength loss while swell % increased.
Table I: Comparison of ranges and mean values of various geotechnical properties of subgrade soils.
Properties Stable Location Unstable Differences Mean Value
Range Location Range
Clay content (%) 18-48 22-54 Insignificant 38
Natural Moisture 10-19 12-24 Insignificant 17
Cont. (%)
OMC (%) 10-18 13-20 Insignificant 18
Shrinkage limit 2-9 2-9 Insignificant 6
Plastic Limit (%) 13-21 16-25 Insignificant 21
Liquid Limit (%) 36-48 38-52 Insignificant 44
Absorption Limit 17-39 21-42 Insignificant 32
(%)
Max. Dry Density 1742-1884 1594-1676 Significant 1788
(kg/m3)
CBR (%)-unsoaked 4-6 3-4 Significant 4
CBR (%)-soaked 2-3 1-2 Significant 2
Void Ratio 0.44-0.58 0.56-0.65 Significant 0.52
UCS (KN/m2) 20-63 16-43 Significant 28
Swell 0.02-0.18 0.10-0.267 Significant 0.14
www.ijmer.com 945 | Page](https://image.slidesharecdn.com/ce32944948-130405014851-phpapp02/85/Ce32944948-2-320.jpg)

![International Journal of Modern Engineering Research (IJMER)
www.ijmer.com Vol.3, Issue.2, March-April. 2013 pp-944-948 ISSN: 2249-6645
Similar results were found by Alayaki F. M. (2012) [14].
When an engineer is encountered with subgrade soils with high water absorption properties it is important for him
or her to consider improving the drainage condition of the pavement. Additionally, the engineer should also consider
improving the soil performance by adding admixtures such as lime, fly ash, cement.
IV. CONCLUSIONS
The following seven regression relationships were found with statistically significant correlation coefficients for
predicting the performance of several engineering variables.
1. Clay is content is directly proportional to the moisture content of the soil with a linear correlation with R = 0.98.
2. Shrinkage Limit is directly proportional to the Liquid Limit of the soil with a linear correlation with R = 0.78.
3. Shrinkage Limit is directly proportional to the Plasticity Index of the soil with a linear correlation with R = 0.89.
4. Void Ratio is directly proportional to the Maximum Dry Density of the soil with a linear correlation with R = 0.81.
5. Swell percentage is inversely proportional to the Unsoaked California Bearing Ratio of the soil with a negative linear
correlation with R = 0.88.
6. Swell percentage is inversely proportional to the Soaked California Bearing Ratio of the soil with a negative linear
correlation with R = 0.93.
7. Swell percentage is inversely proportional to the Unconfined Compressive Strength of the soil with a negative linear
correlation with R = 0.21.
ACKNOWLEDGMENTS
The Republic Of Turkey, Ministry Of National Education Scholarships is duly acknowledged for providing
scholarship.
REFERENCES
[1] Brooks, R. M., Soil stabilization with RHA and Flyash, International Journal of Research and Reviews in Applied Sciences. Volume
1, Issue 3, 2009, pp. 209-217.
[2] Brooks, R. M., Soil stabilization with Lime and RHA, International Journal of Applied Engineering, Volume 5, Number 7, 2010, pp.
1077-1086.
[3] Liu C., and Evett J. B., Soils and foundations (The University of North Carolina at Charlotte. Pearson Prentice Hall. Seventh
Edition, 2008).
[4] ASTM D2487 - 11 Standard Practice for Classification of Soils for Engineering Purposes (Unified Soil Classification System)
[5] ASTM D2216 - 10 Standard Test Methods for Laboratory Determination of Water (Moisture) Content of Soil and Rock by Mass
[6] ASTM D558 - 11 Standard Test Methods for Moisture-Density (Unit Weight) Relations of Soil-Cement Mixtures
[7] ASTM D 698, D 1557- Laboratory Compaction Tests
[8] ASTM D1883 - 07e2 Standard Test Method for CBR (California Bearing Ratio) of Laboratory-Compacted Soils
[9] ASTM D2166 - 06 Standard Test Method for Unconfined Compressive Strength of Cohesive Soil.
[10] Moore D. S., McCabe G. P., and Craig, B. A., Introduction to the practice of statistics (W H Freeman & Co (Sd),7th Edition, New
York., 2005).
[11] Devore J. L., and Farnum N. R., Applied statistics for engineers and scientists (Duxbury Press. ISBN 05435601X, 1stedition, 2004).
[12] Montgomery, D. C. Design and analysis of experiments (John Wiley & Sons Inc. 7th edition, 2008).
[13] McCarthy, D. F., Essential of soil mechanics and foundations (Basic Geotechnics. Pearson Prentice Hall. New Jersey. 2007).
[14] Alayaki F. M., Water absorption properties of laterite soil in road pavement: a case study If-Ilesha Highway, South Western Nigeria,
International Journal of Emerging Technology and advanced Engineering. Volume 2, issue 11, November, 2012.
www.ijmer.com 948 | Page](https://image.slidesharecdn.com/ce32944948-130405014851-phpapp02/85/Ce32944948-5-320.jpg)

This study analyzed the water susceptible properties of silt loam subgrade soils in southwest Pennsylvania. Laboratory tests were conducted on 20 soil samples to determine properties like natural moisture content, optimum moisture content, compaction, CBR soaked and unsoaked, and unconfined compression strength. Regression analyses found correlations between various properties. For example, clay content was directly proportional to natural moisture content, void ratio was directly proportional to maximum dry density, and swell percentage was inversely proportional to CBR soaked and unsoaked. The results provide relationships to predict soil performance based on water absorption characteristics.


