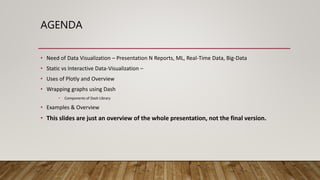
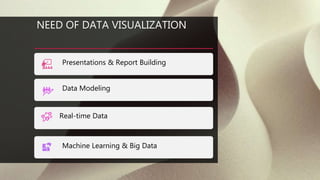
This presentation provides an overview of interactive data visualization using the Dash-Plotly libraries. It discusses the need for data visualization in presentations, reports, machine learning and real-time data. It contrasts static versus interactive graphs and how Dash allows for changing views and updating graphs automatically from multiple sources. An overview of the Plotly and Dash libraries is given, including the basic components of graphs, figures, data and layout. Examples of interactive graphs and dashboards using these libraries will be provided.


![Hacking-Uncovered-How-People-Get-Hacked-and-How-to-Stay-Safe[1].pptx](https://cdn.slidesharecdn.com/ss_thumbnails/hacking-uncovered-how-people-get-hacked-and-how-to-stay-safe1-260130170011-4883a9c7-thumbnail.jpg?width=640&height=640&fit=bounds)


![제 23회 보아즈(BOAZ) 빅데이터 컨퍼런스 - [MBOAX] : ABSA를 활용한 소비자 반응 분석 기반 운영 효율화 대시보드 설계](https://cdn.slidesharecdn.com/ss_thumbnails/3-1boaz23rdconferencemboax-260203102709-9d519923-thumbnail.jpg?width=640&height=640&fit=bounds)