Downloaded 47 times


![Prof. Pier Luca Lanzi
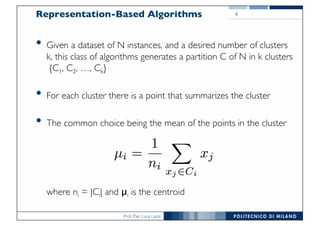
The BFR Algorithm
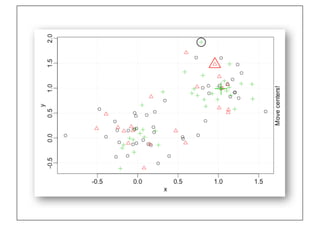
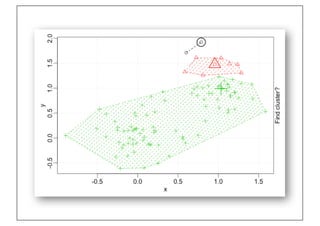
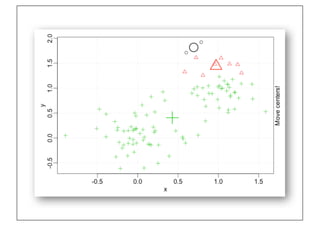
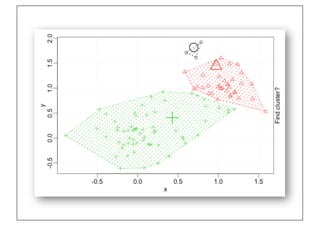
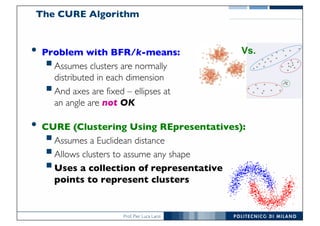
• BFR [Bradley-Fayyad-Reina] is a variant of k-means designed to
handle very large (disk-resident) data sets
• Assumes that clusters are normally distributed around a centroid
in a Euclidean space
• Standard deviations in different dimensions may vary
• Clusters are axis-aligned ellipses
• Efficient way to summarize clusters (want
memory required O(clusters) and not O(data))
48](https://image.slidesharecdn.com/dmtm2017-13-representativebasedclustering-170902110553/85/DMTM-Lecture-13-Representative-based-clustering-48-320.jpg)


![Prof. Pier Luca Lanzi
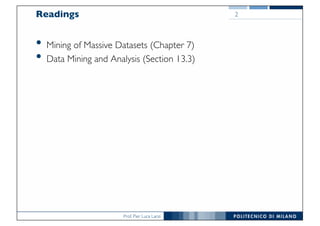
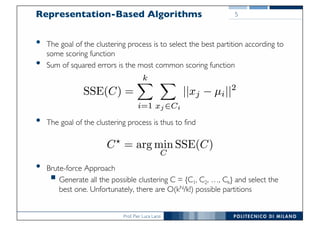
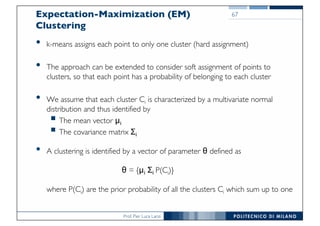
k-Means Clustering in R
set.seed(1234)
# random generated points
x<-rnorm(12, mean=rep(1:3,each=4), sd=0.2)
y<-rnorm(12, mean=rep(c(1,2,1),each=4), sd=0.2)
plot(x,y,pch=19,cex=2,col="blue")
# distance matrix
d <- data.frame(x,y)
km <- kmeans(d, 3)
names(km)
plot(x,y,pch=19,cex=2,col="blue")
par(new=TRUE)
plot(km$centers[,1], km$centers[,2], pch=19, cex=2, col="red")
72](https://image.slidesharecdn.com/dmtm2017-13-representativebasedclustering-170902110553/85/DMTM-Lecture-13-Representative-based-clustering-72-320.jpg)
![Prof. Pier Luca Lanzi
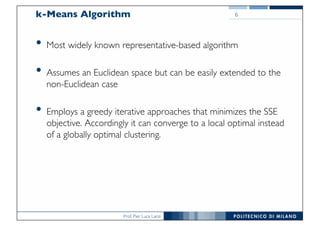
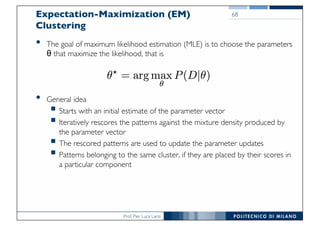
k-Means Clustering in R
# generate other random centroids to start with
km <- kmeans(d, 3, centers=cbind(runif(3,0,3),runif(3,0,2)))
plot(x,y,pch=19,cex=2,col="blue")
par(new=TRUE)
plot(km$centers[,1], km$centers[,2], pch=19, cex=2, col="red")
73](https://image.slidesharecdn.com/dmtm2017-13-representativebasedclustering-170902110553/85/DMTM-Lecture-13-Representative-based-clustering-73-320.jpg)
![Prof. Pier Luca Lanzi
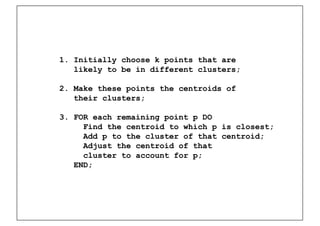
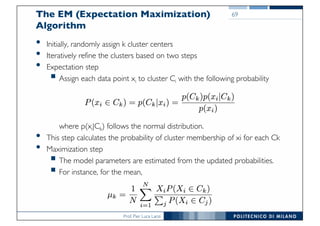
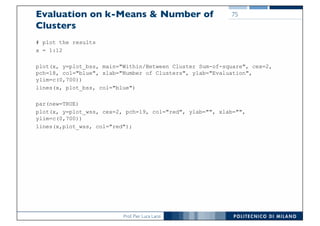
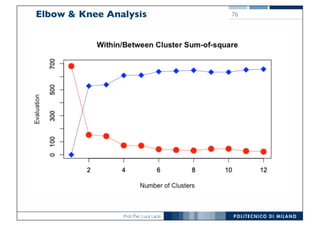
Evaluation on k-Means & Number of
Clusters
###
### Evaluate clustering in kmeans using elbow/knee analysis
###
library(foreign)
library(GMD)
iris = read.arff("iris.arff")
# init two vectors that will contain the evaluation
# in terms of within and between sum of squares
plot_wss = rep(0,12)
plot_bss = rep(0,12)
# evaluate every clustering
for(i in 1:12)
{
cl <- kmeans(iris[,1:4],i)
plot_wss[i] <- cl$tot.withinss
plot_bss[i] <- cl$betweenss;
}
74](https://image.slidesharecdn.com/dmtm2017-13-representativebasedclustering-170902110553/85/DMTM-Lecture-13-Representative-based-clustering-74-320.jpg)

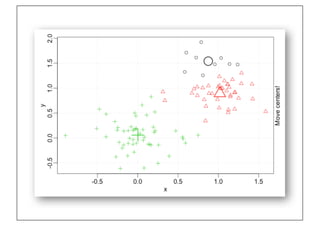
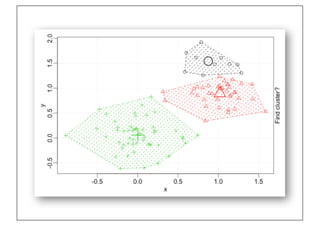
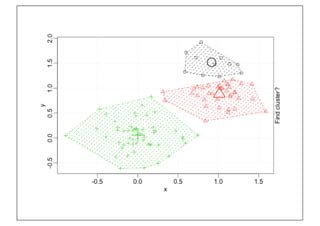
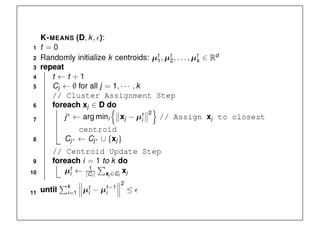
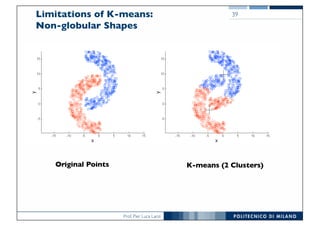
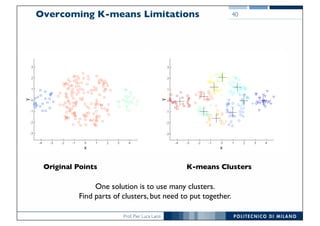
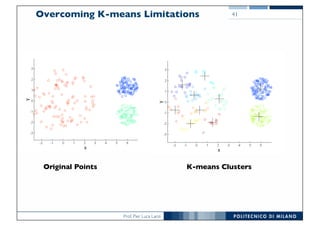
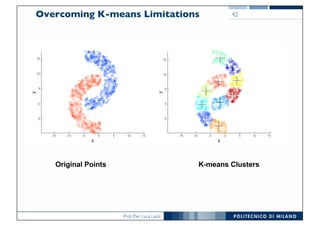
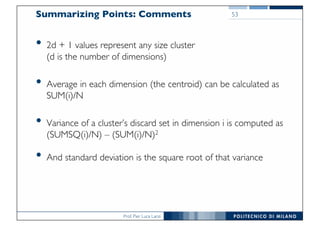
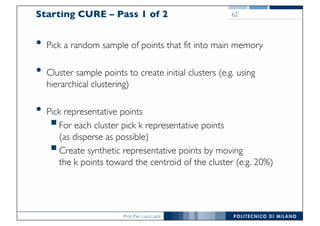
The document discusses representation-based clustering algorithms, focusing primarily on the well-known k-means algorithm. It addresses the challenges of choosing initial centroids, the limitations of k-means, and introduces the BFR algorithm for handling large datasets. Variations of k-means, such as k-modes and k-prototypes, are also mentioned, demonstrating adaptability to different data types.