Downloaded 104 times
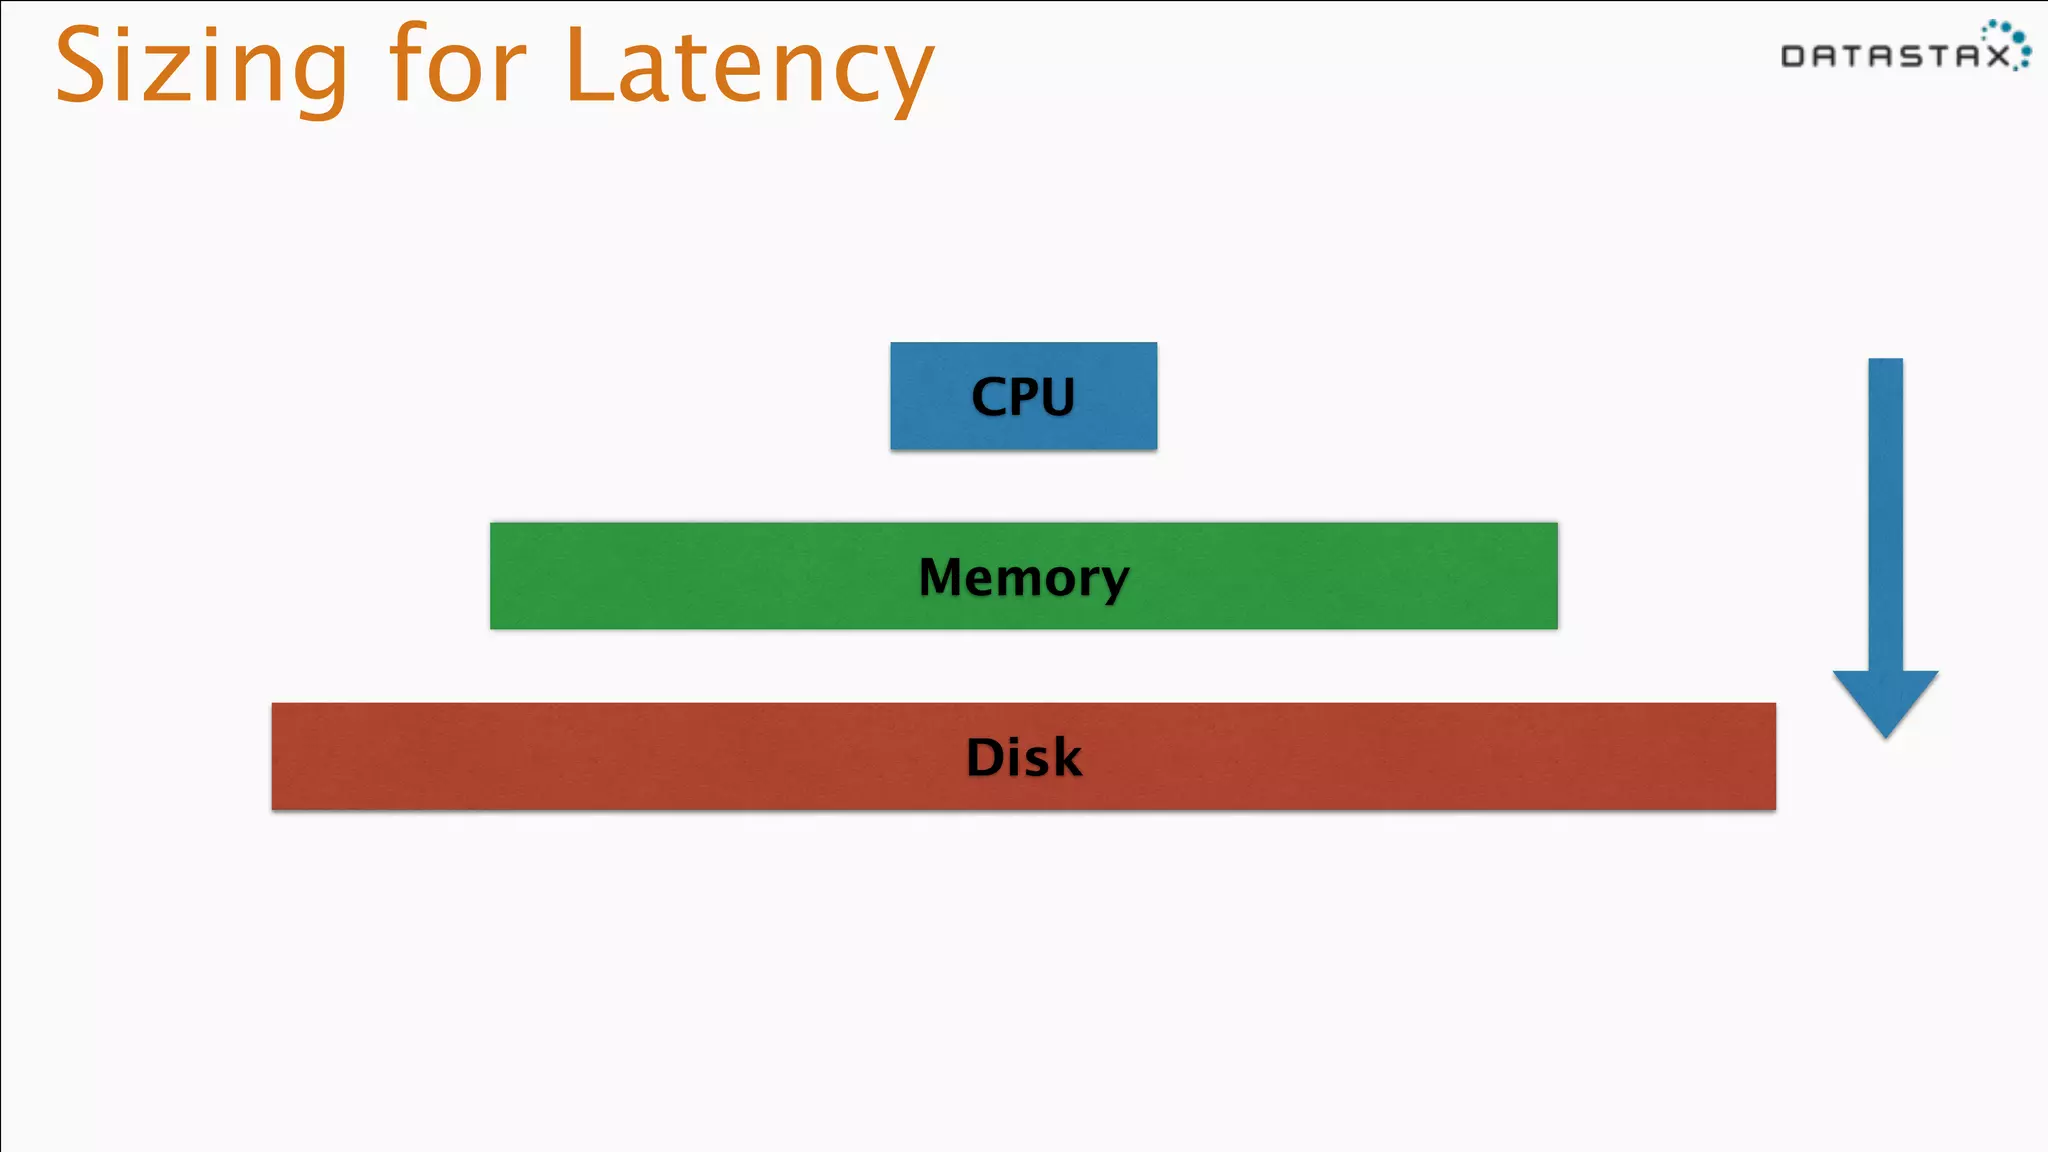
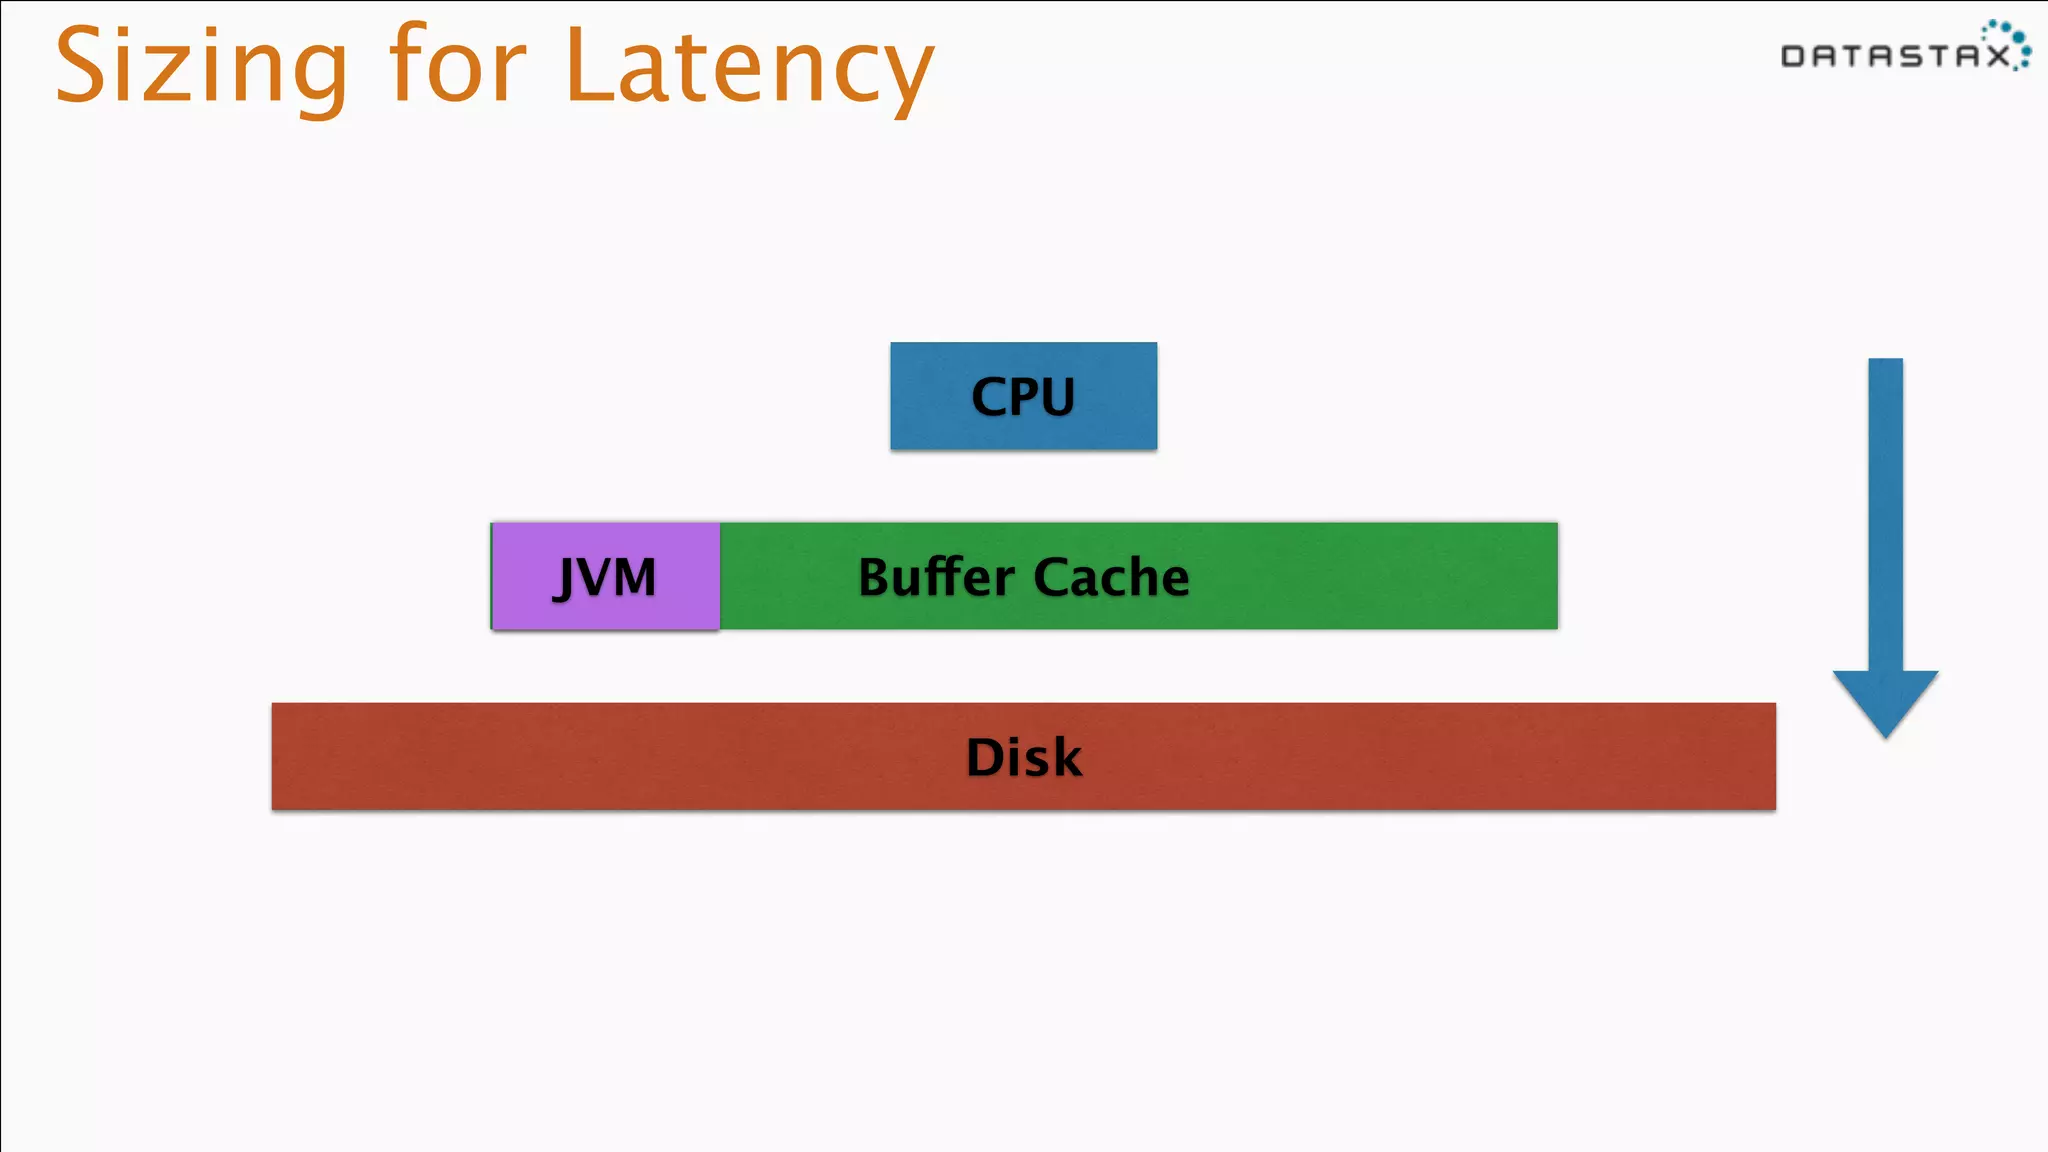
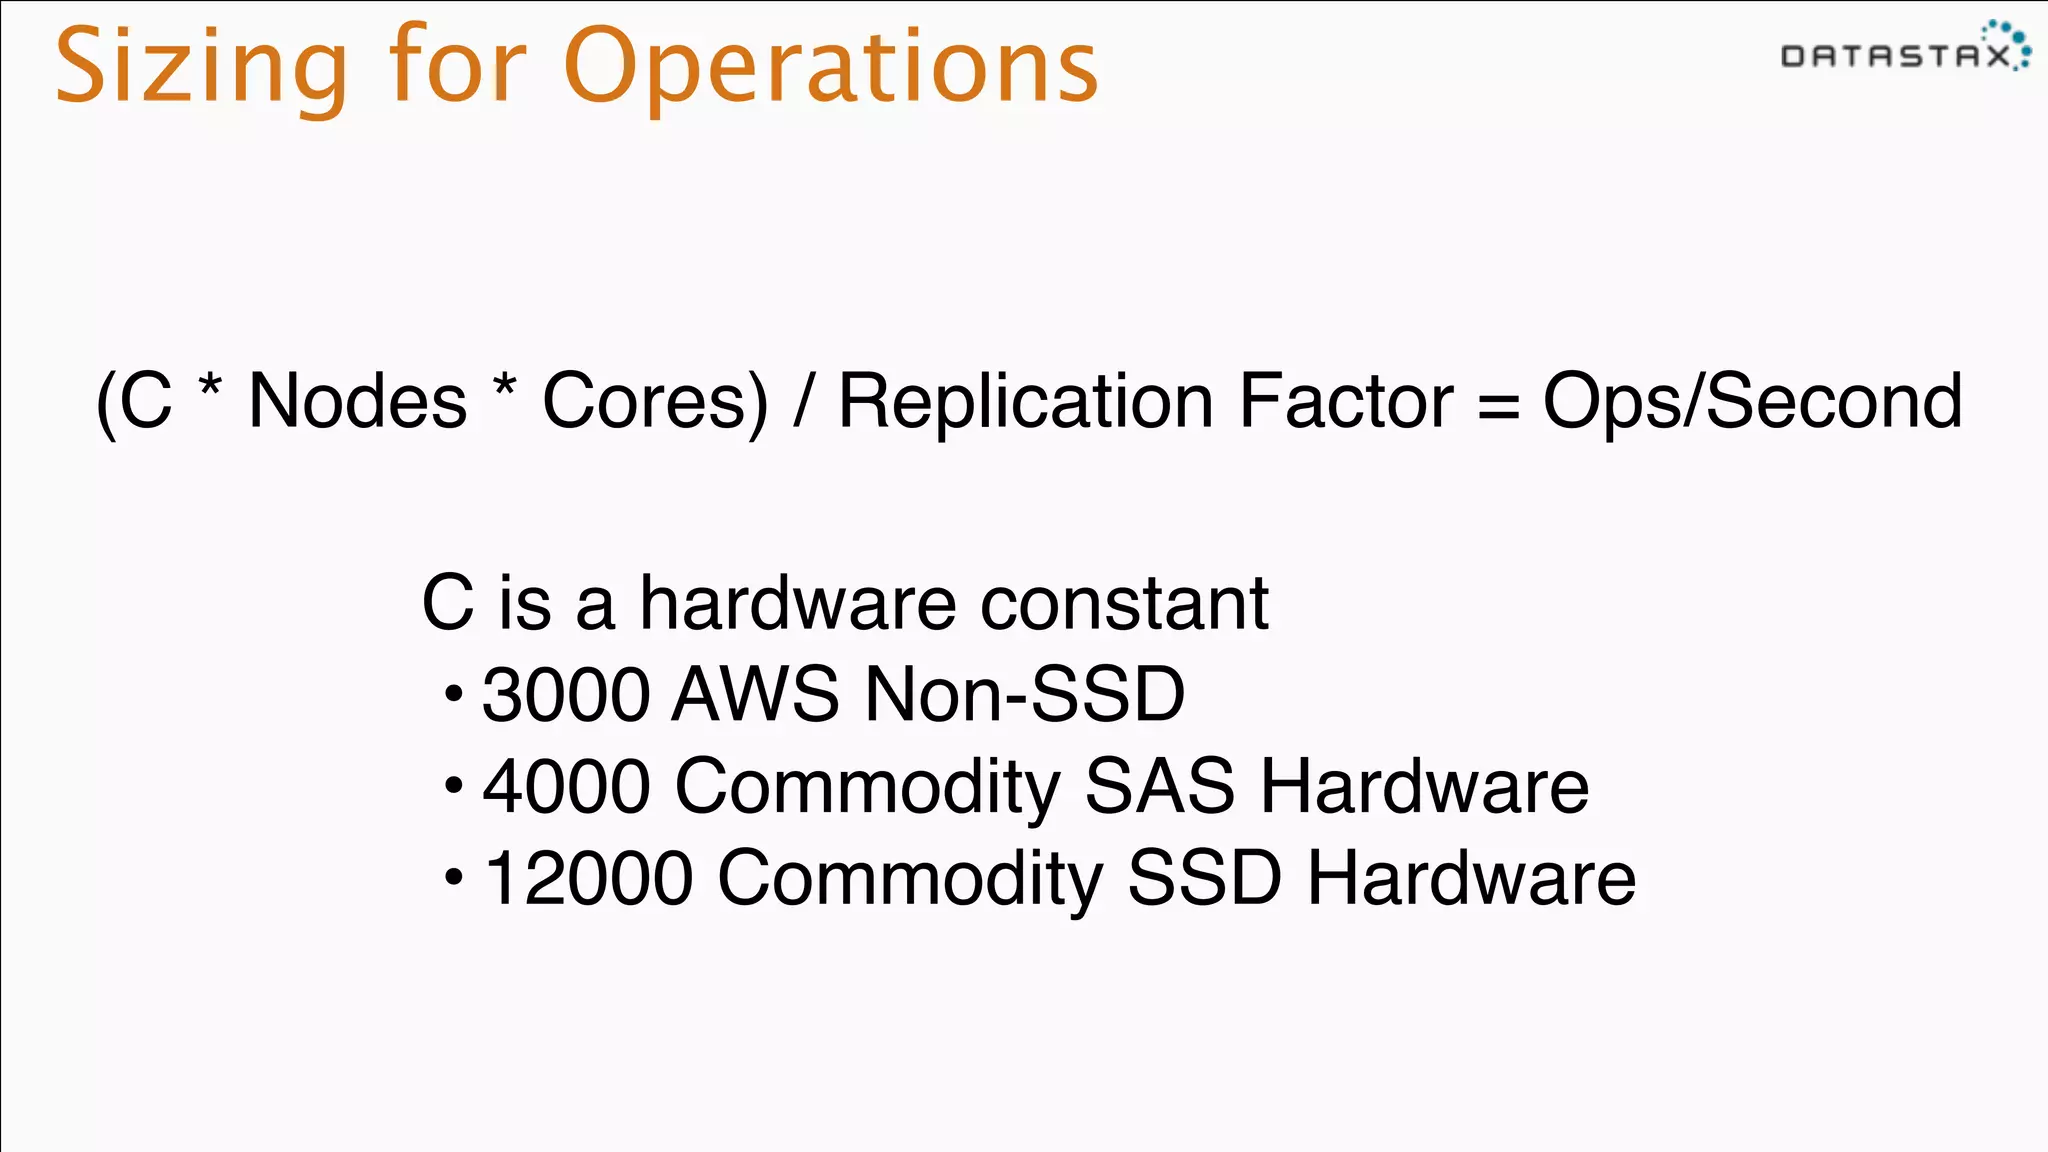
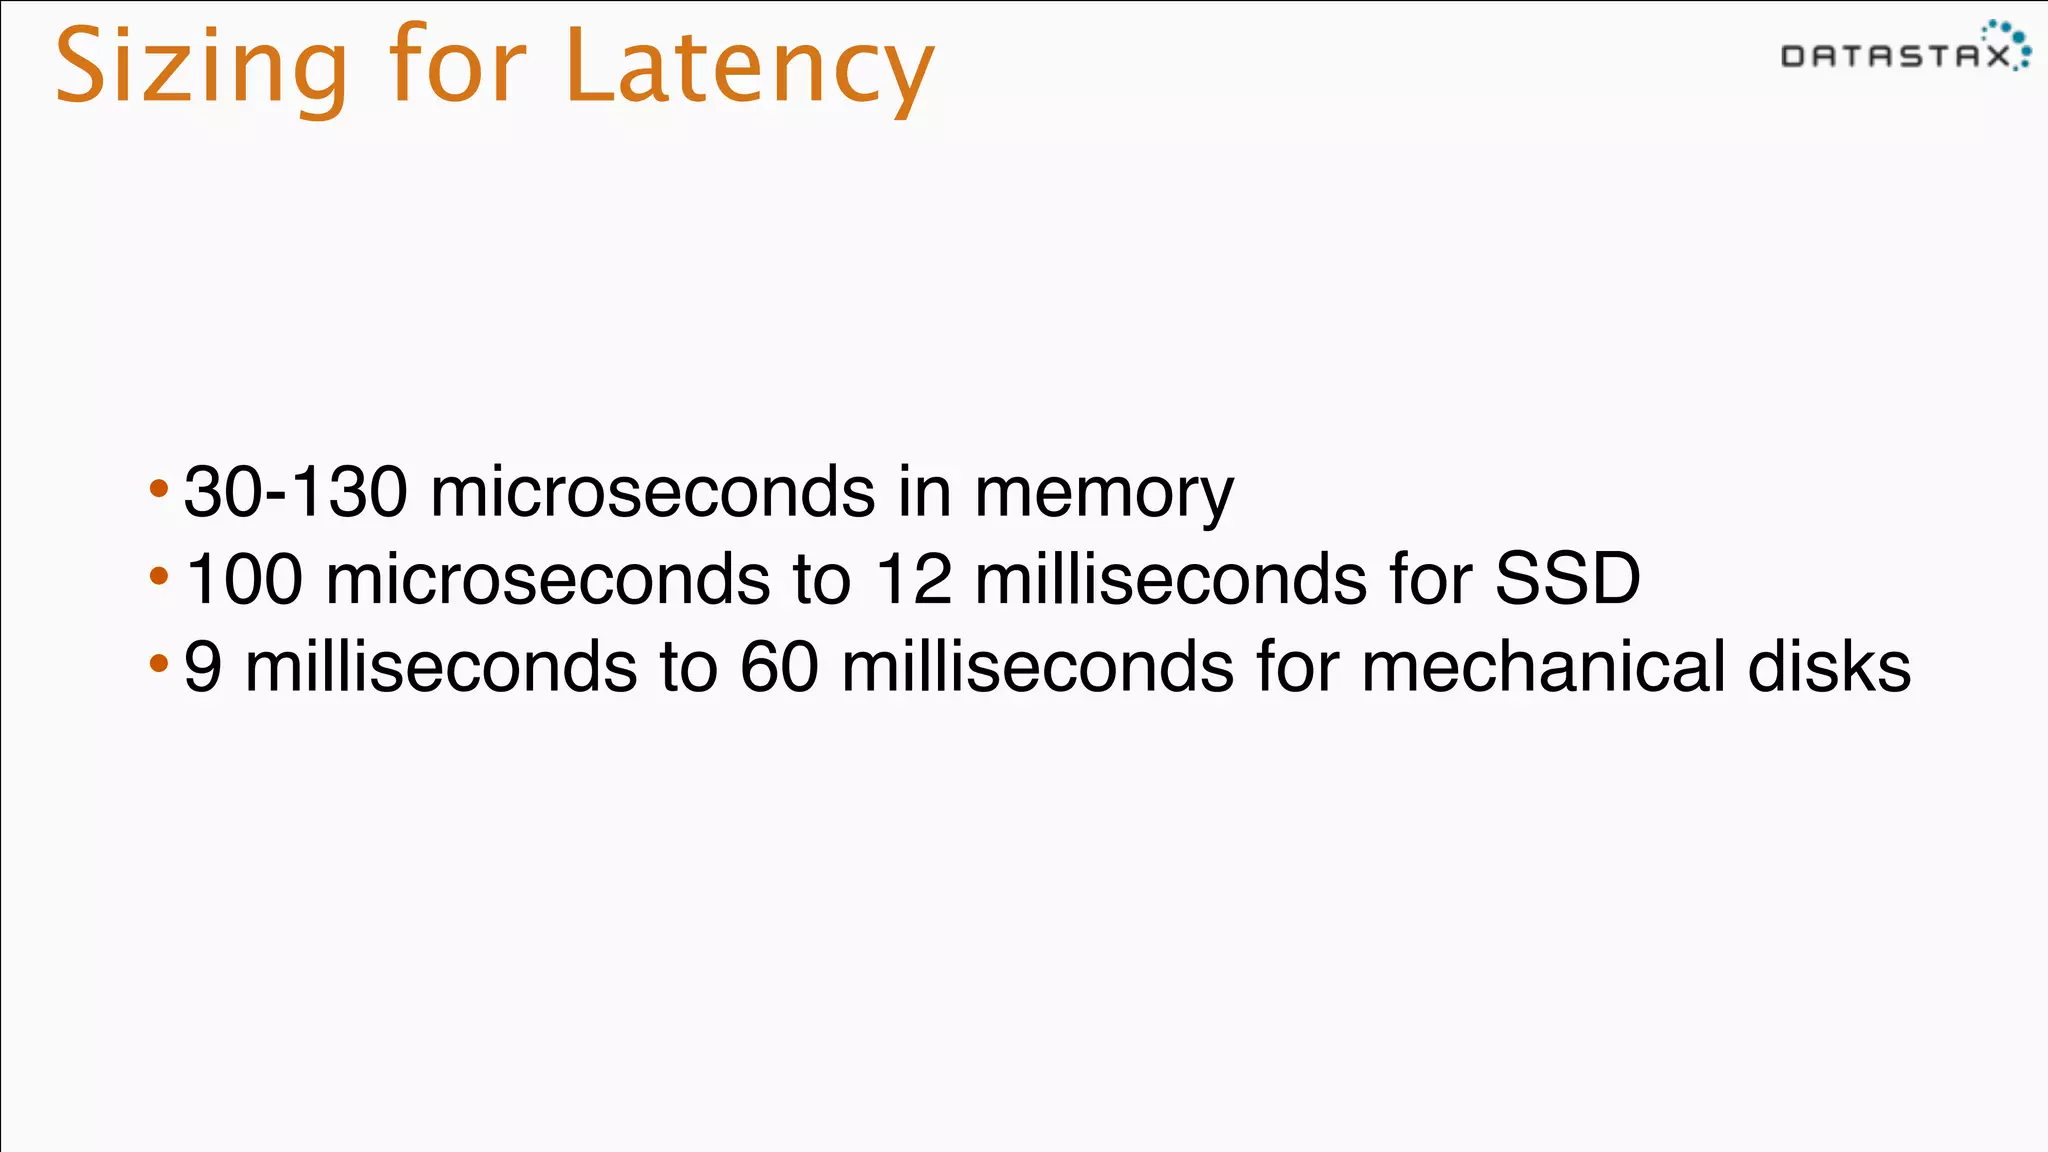

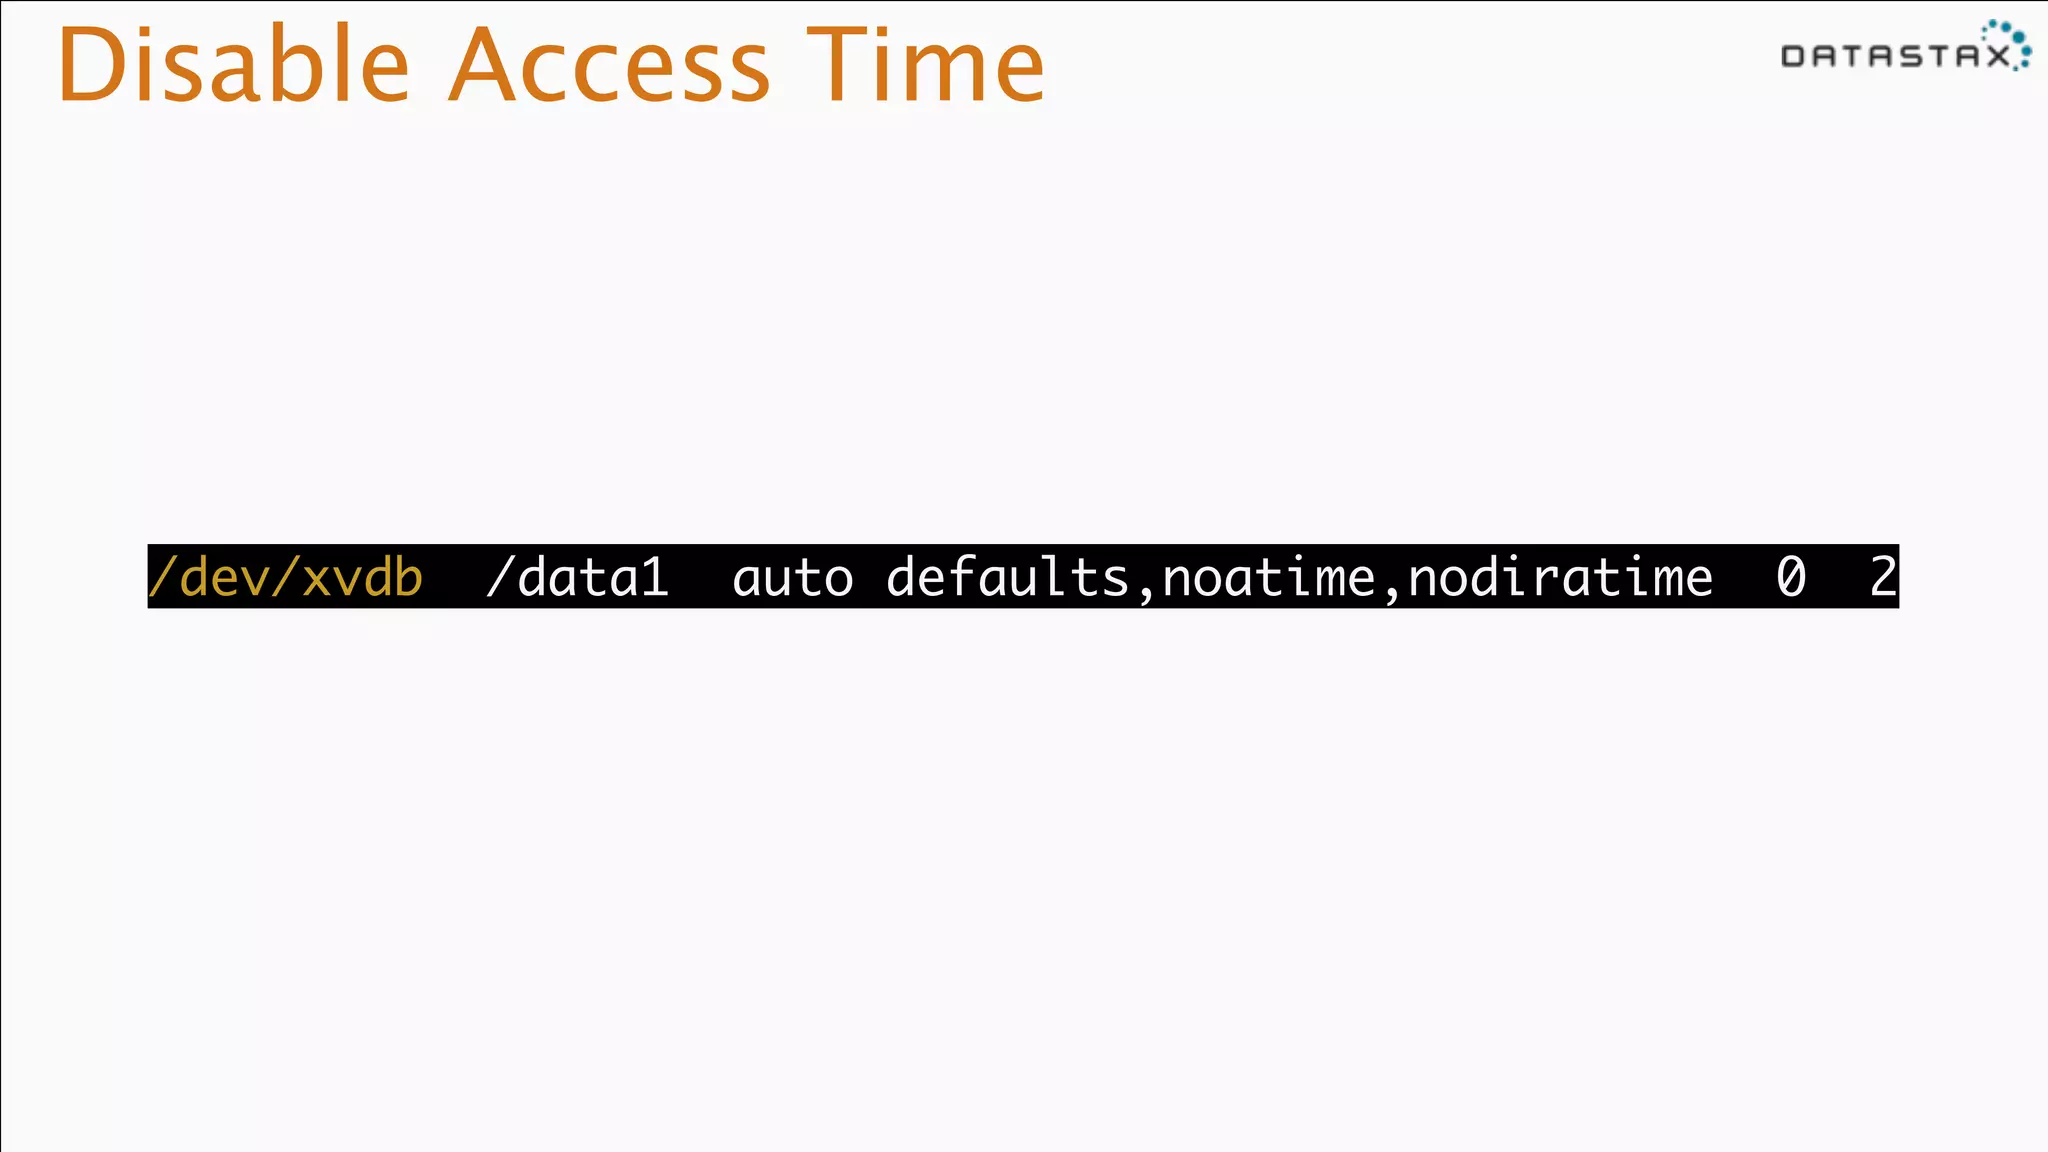
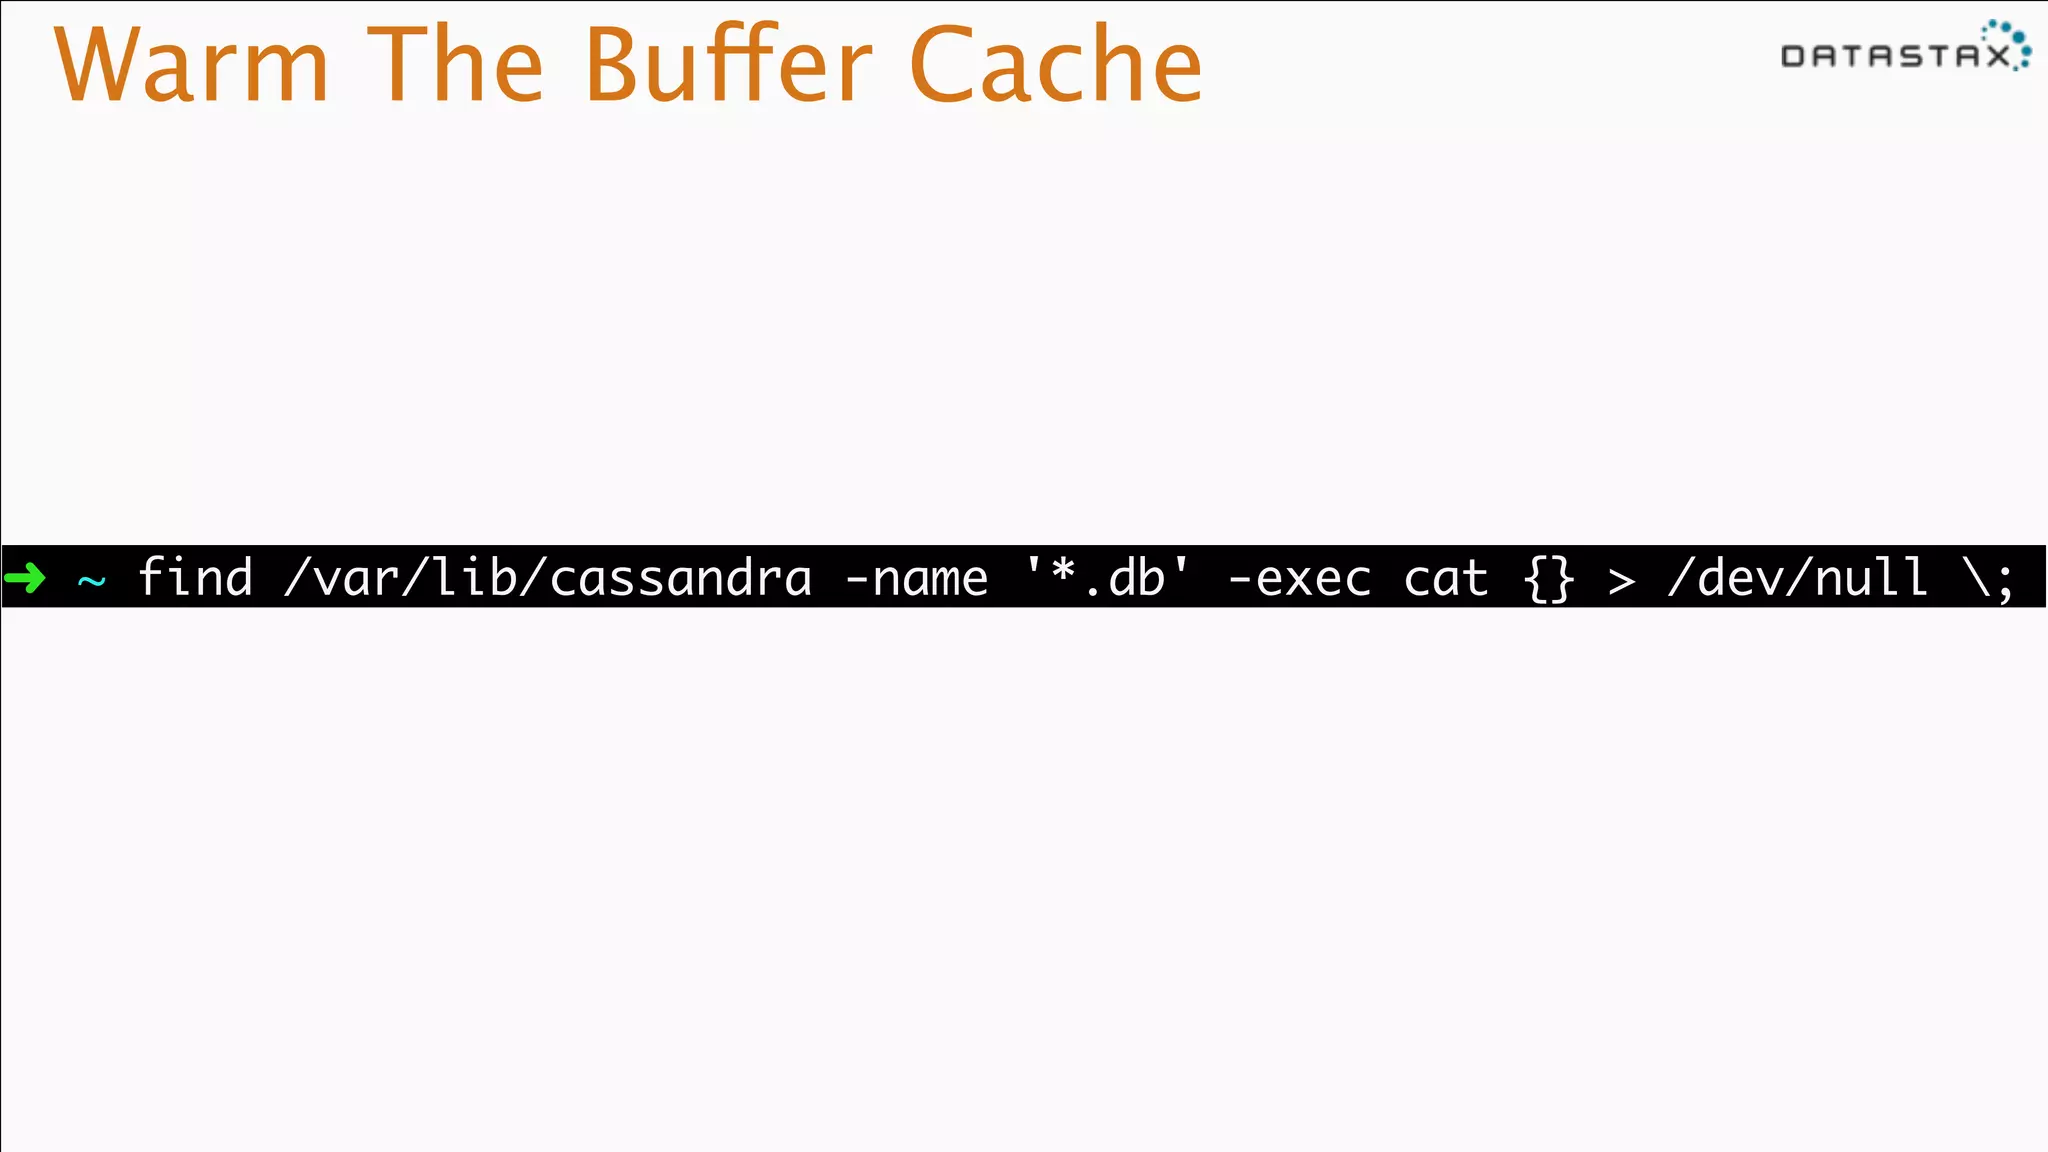
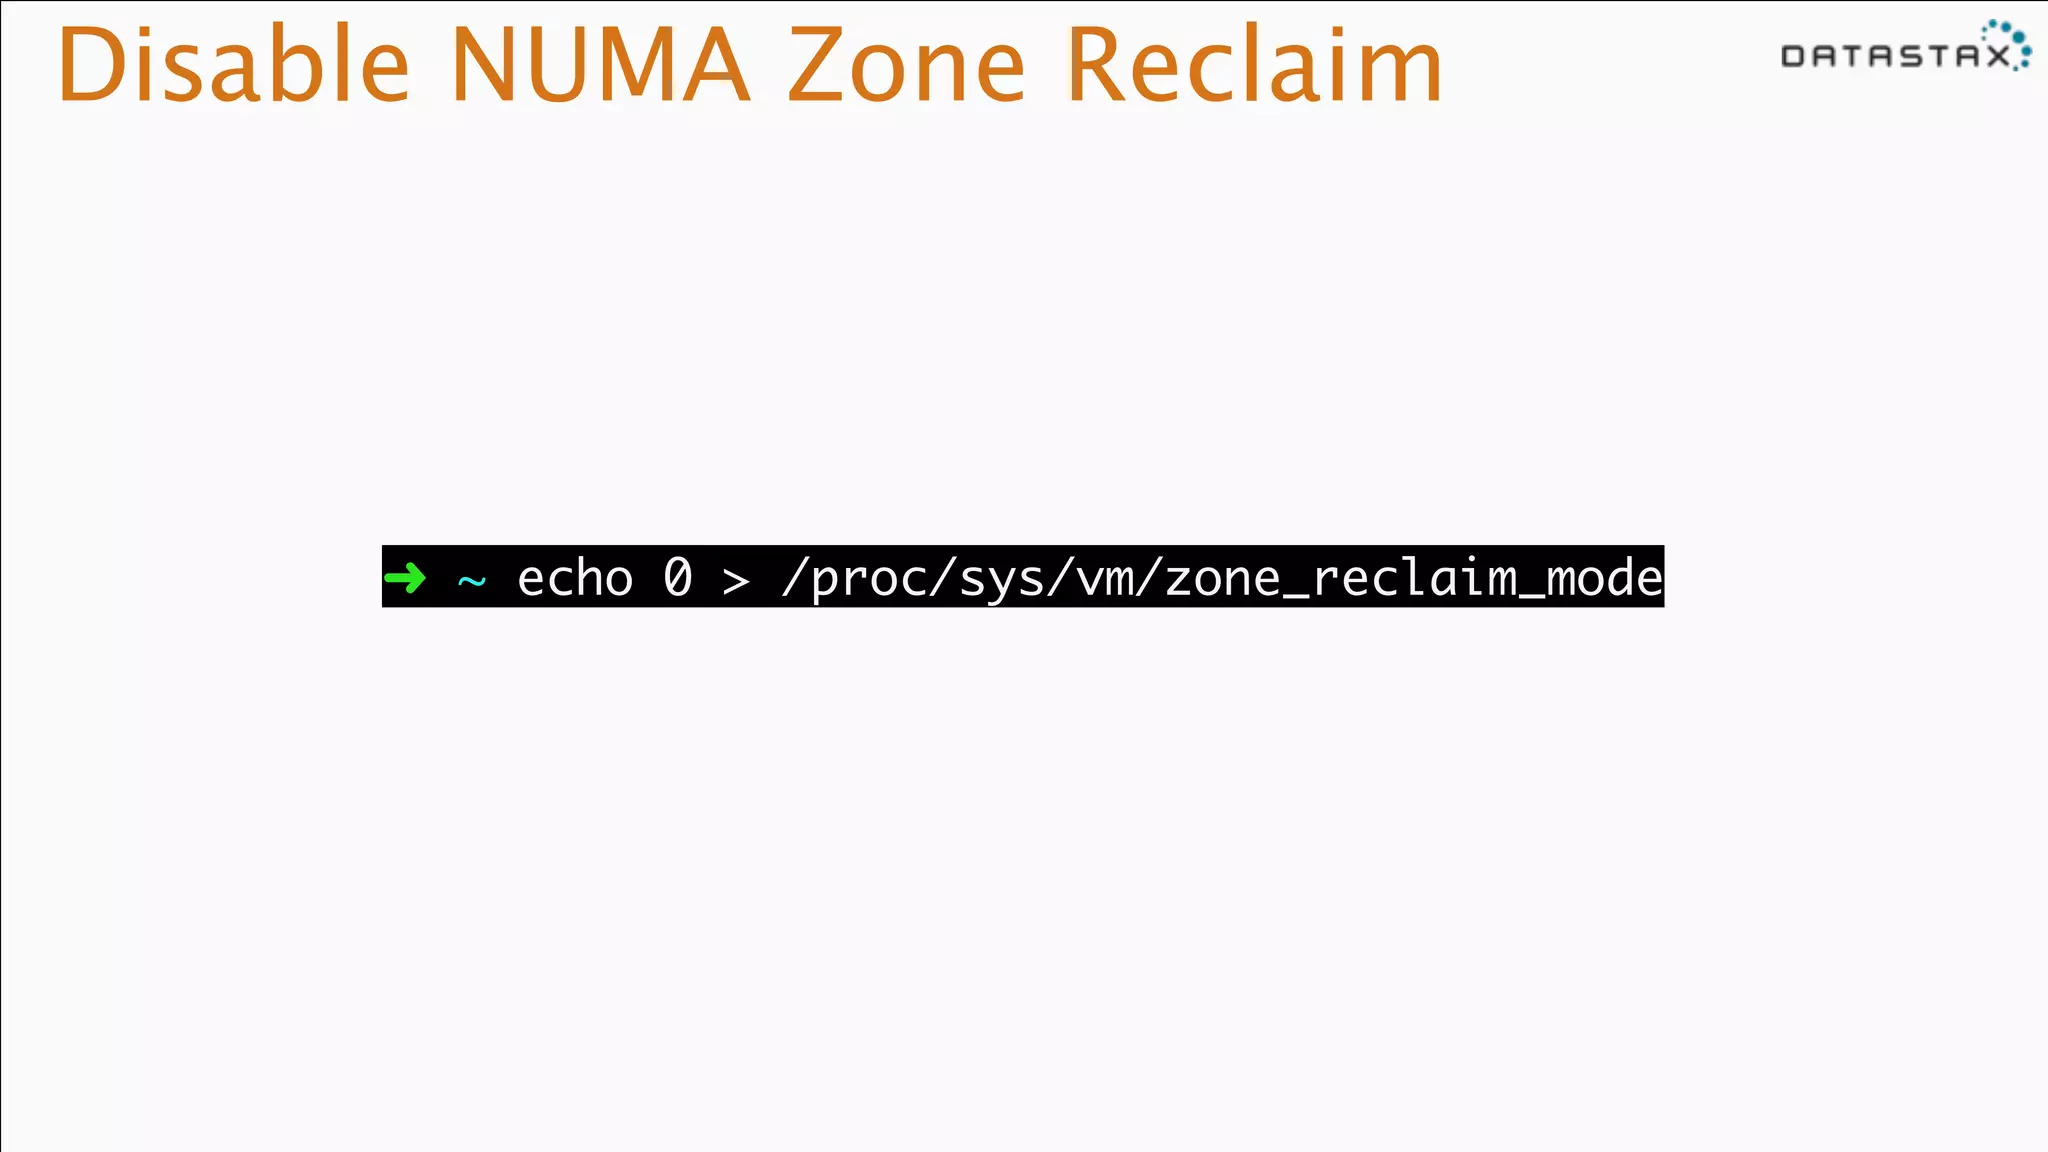
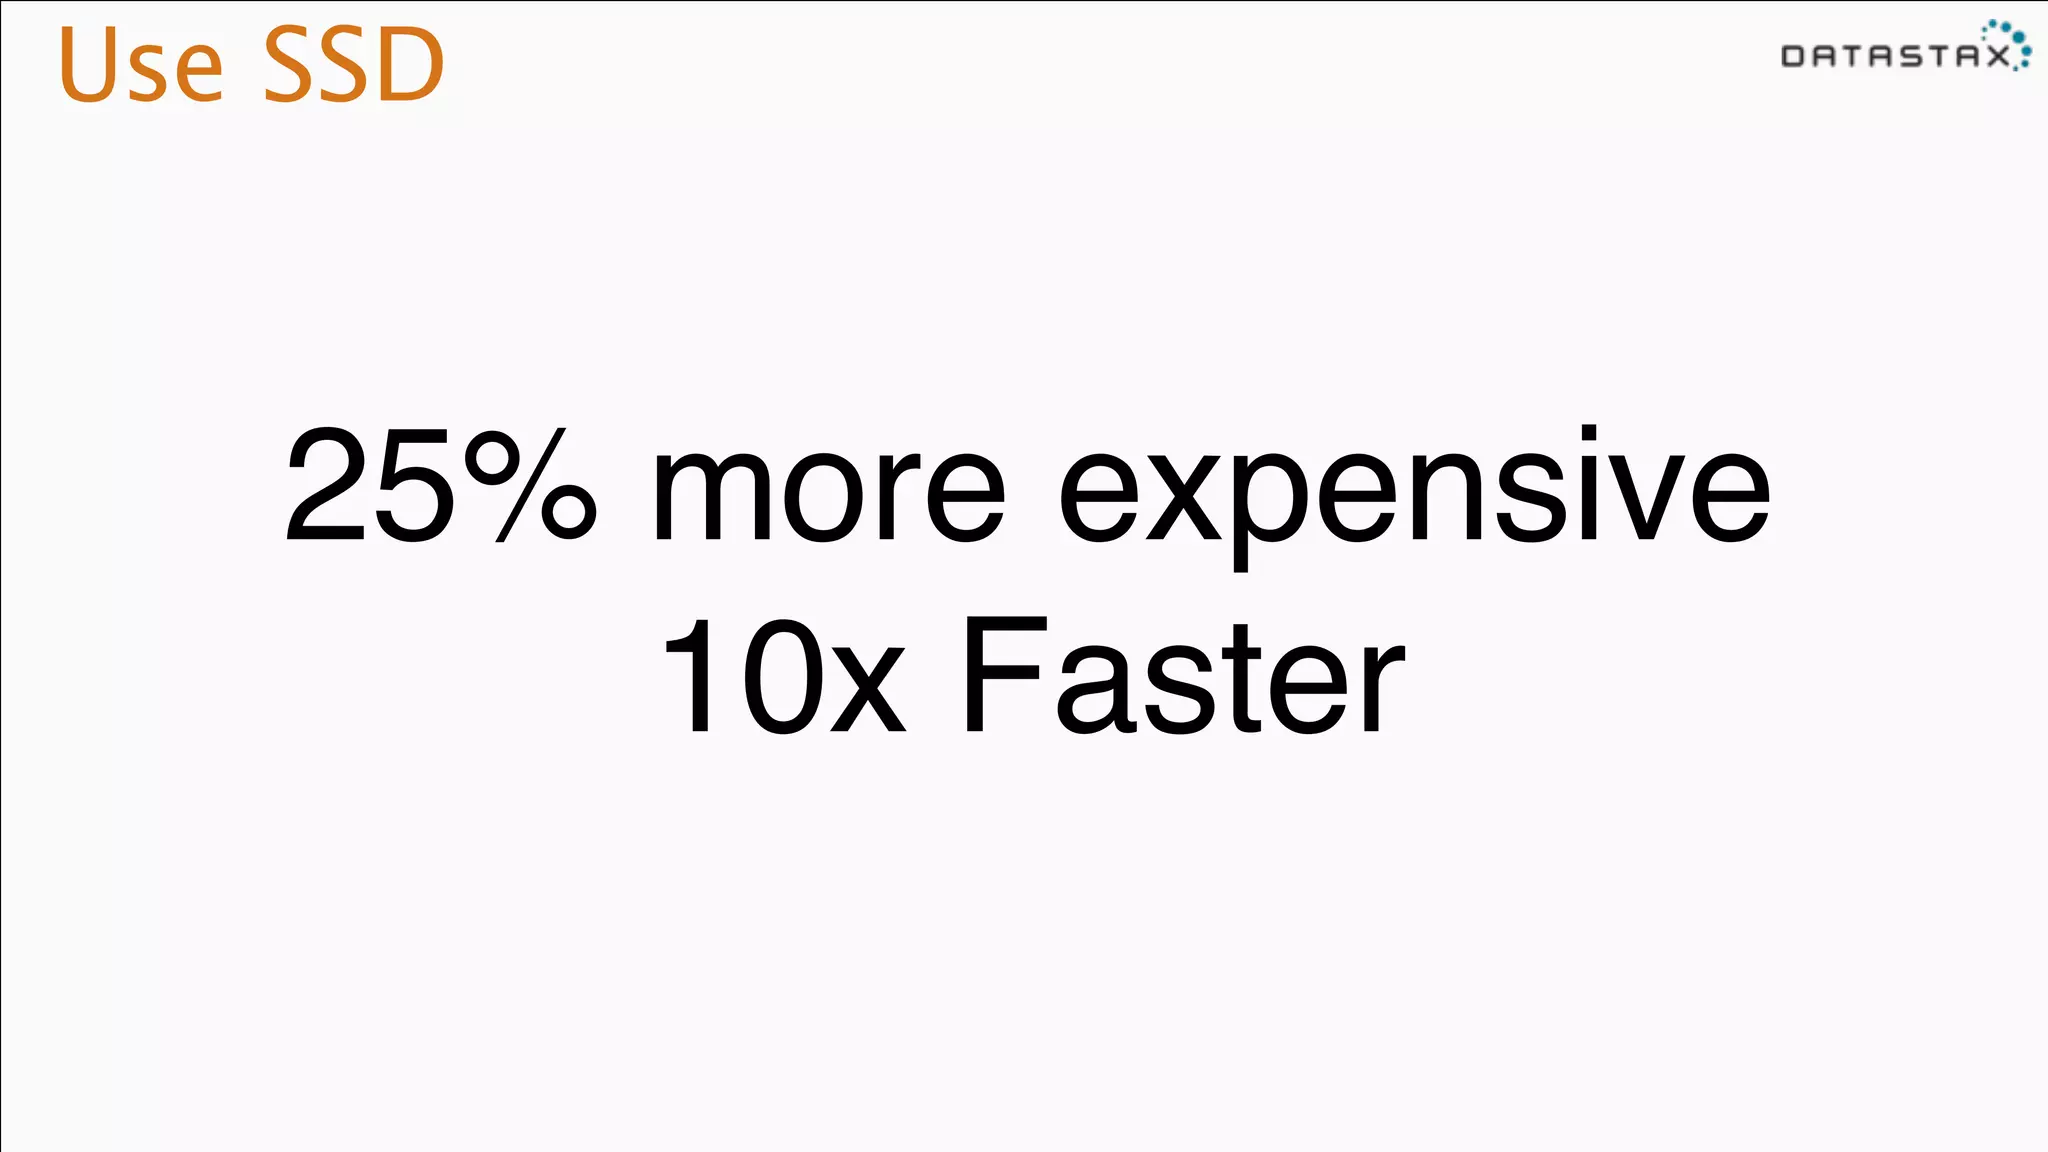
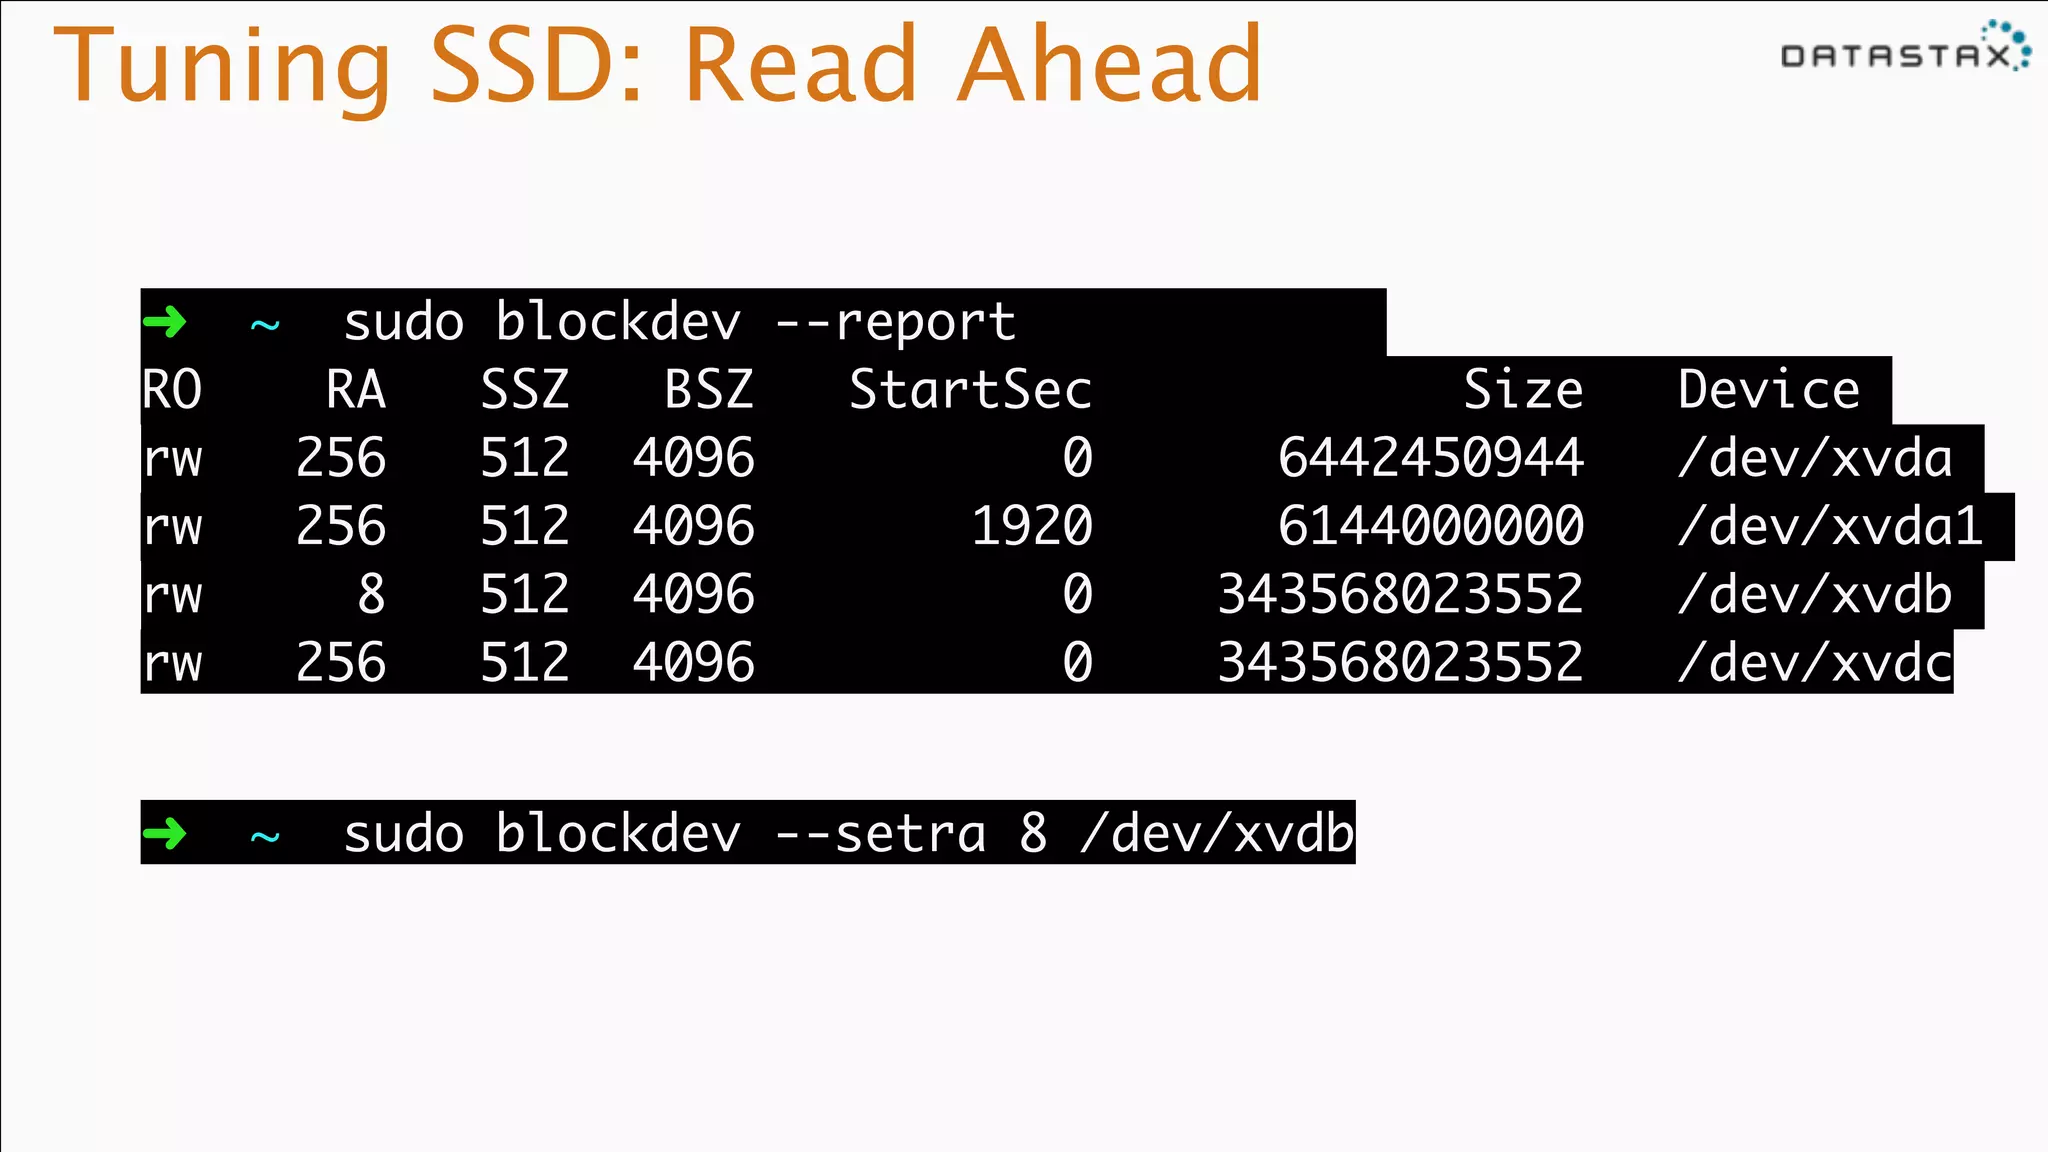
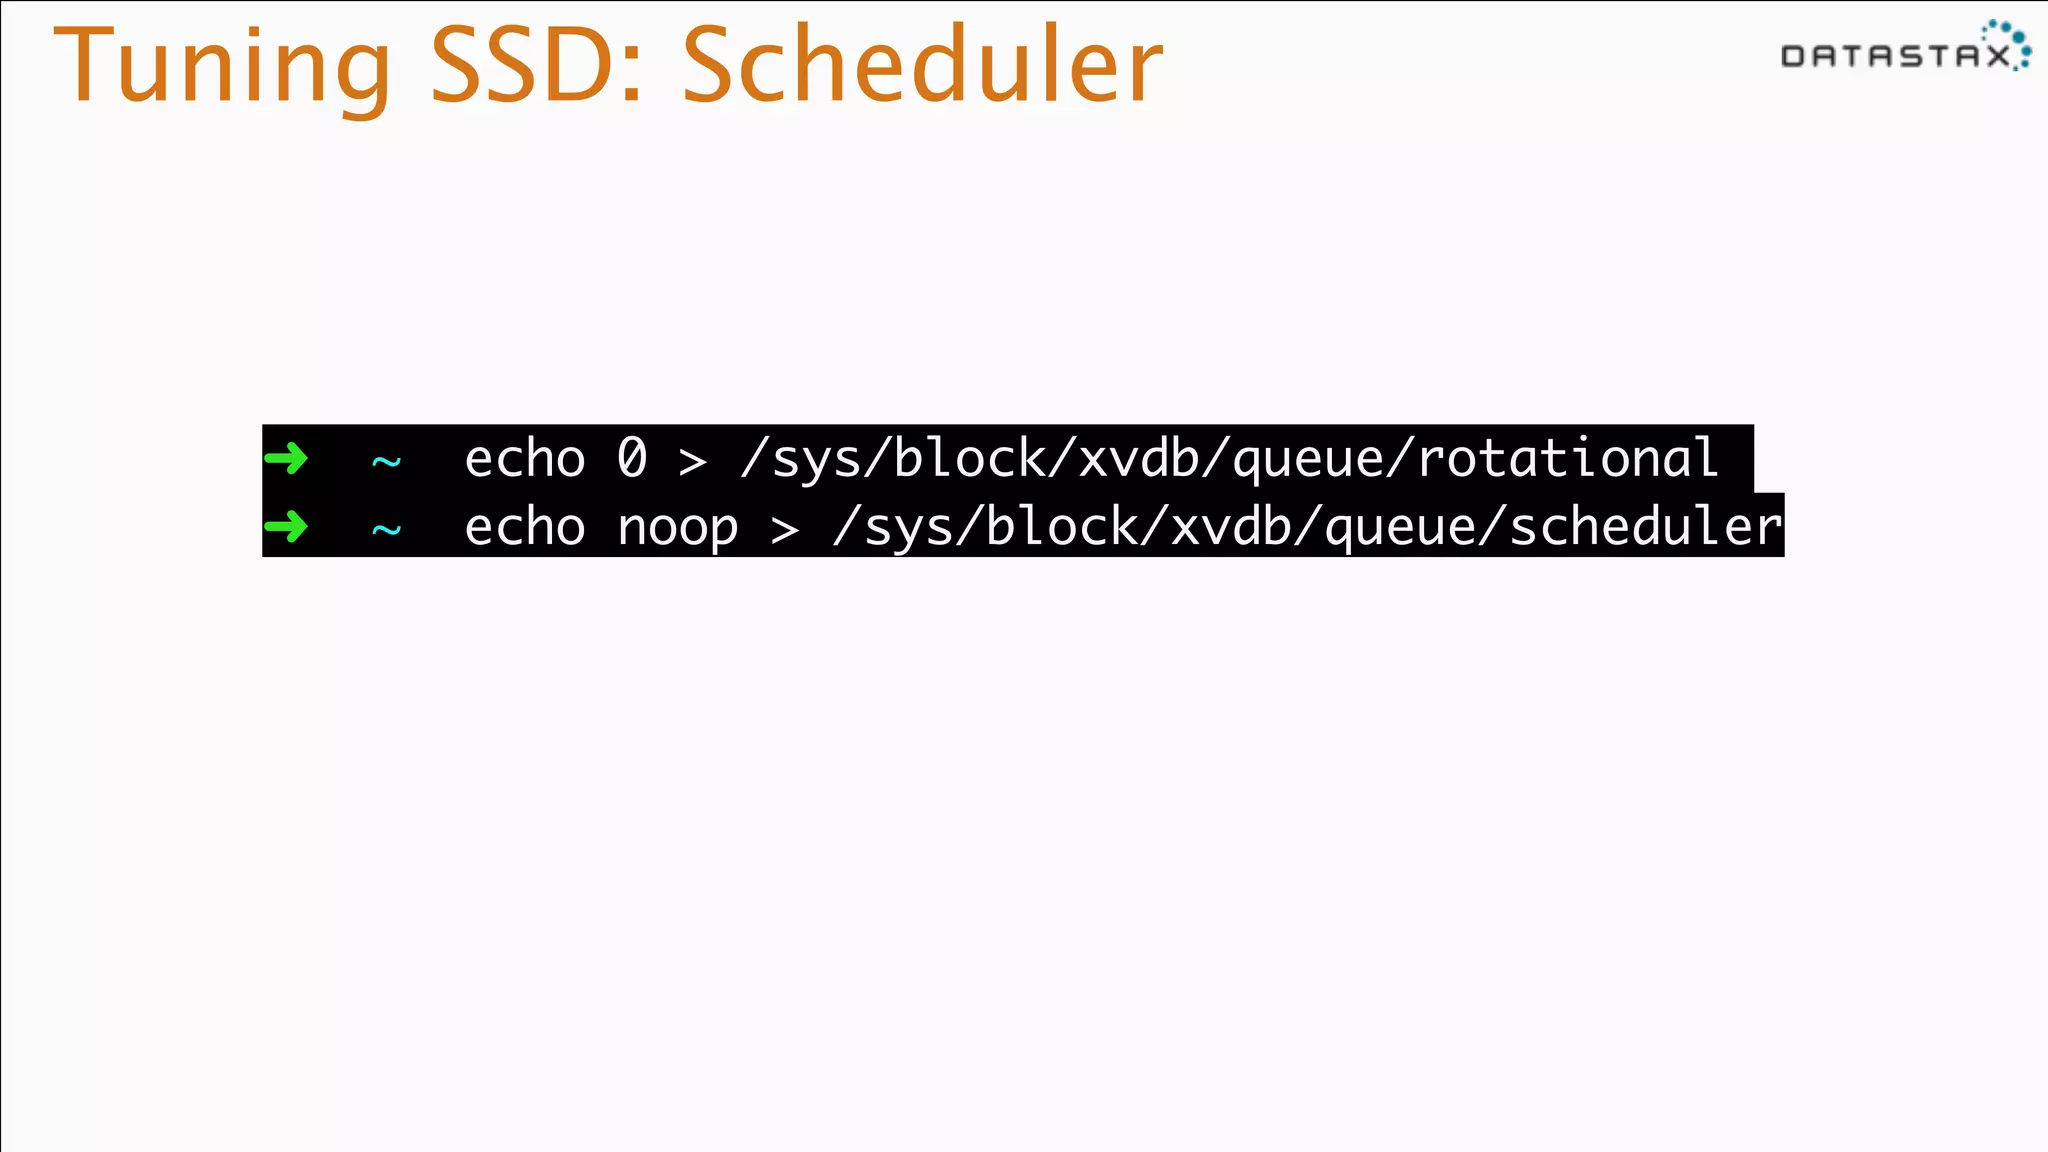
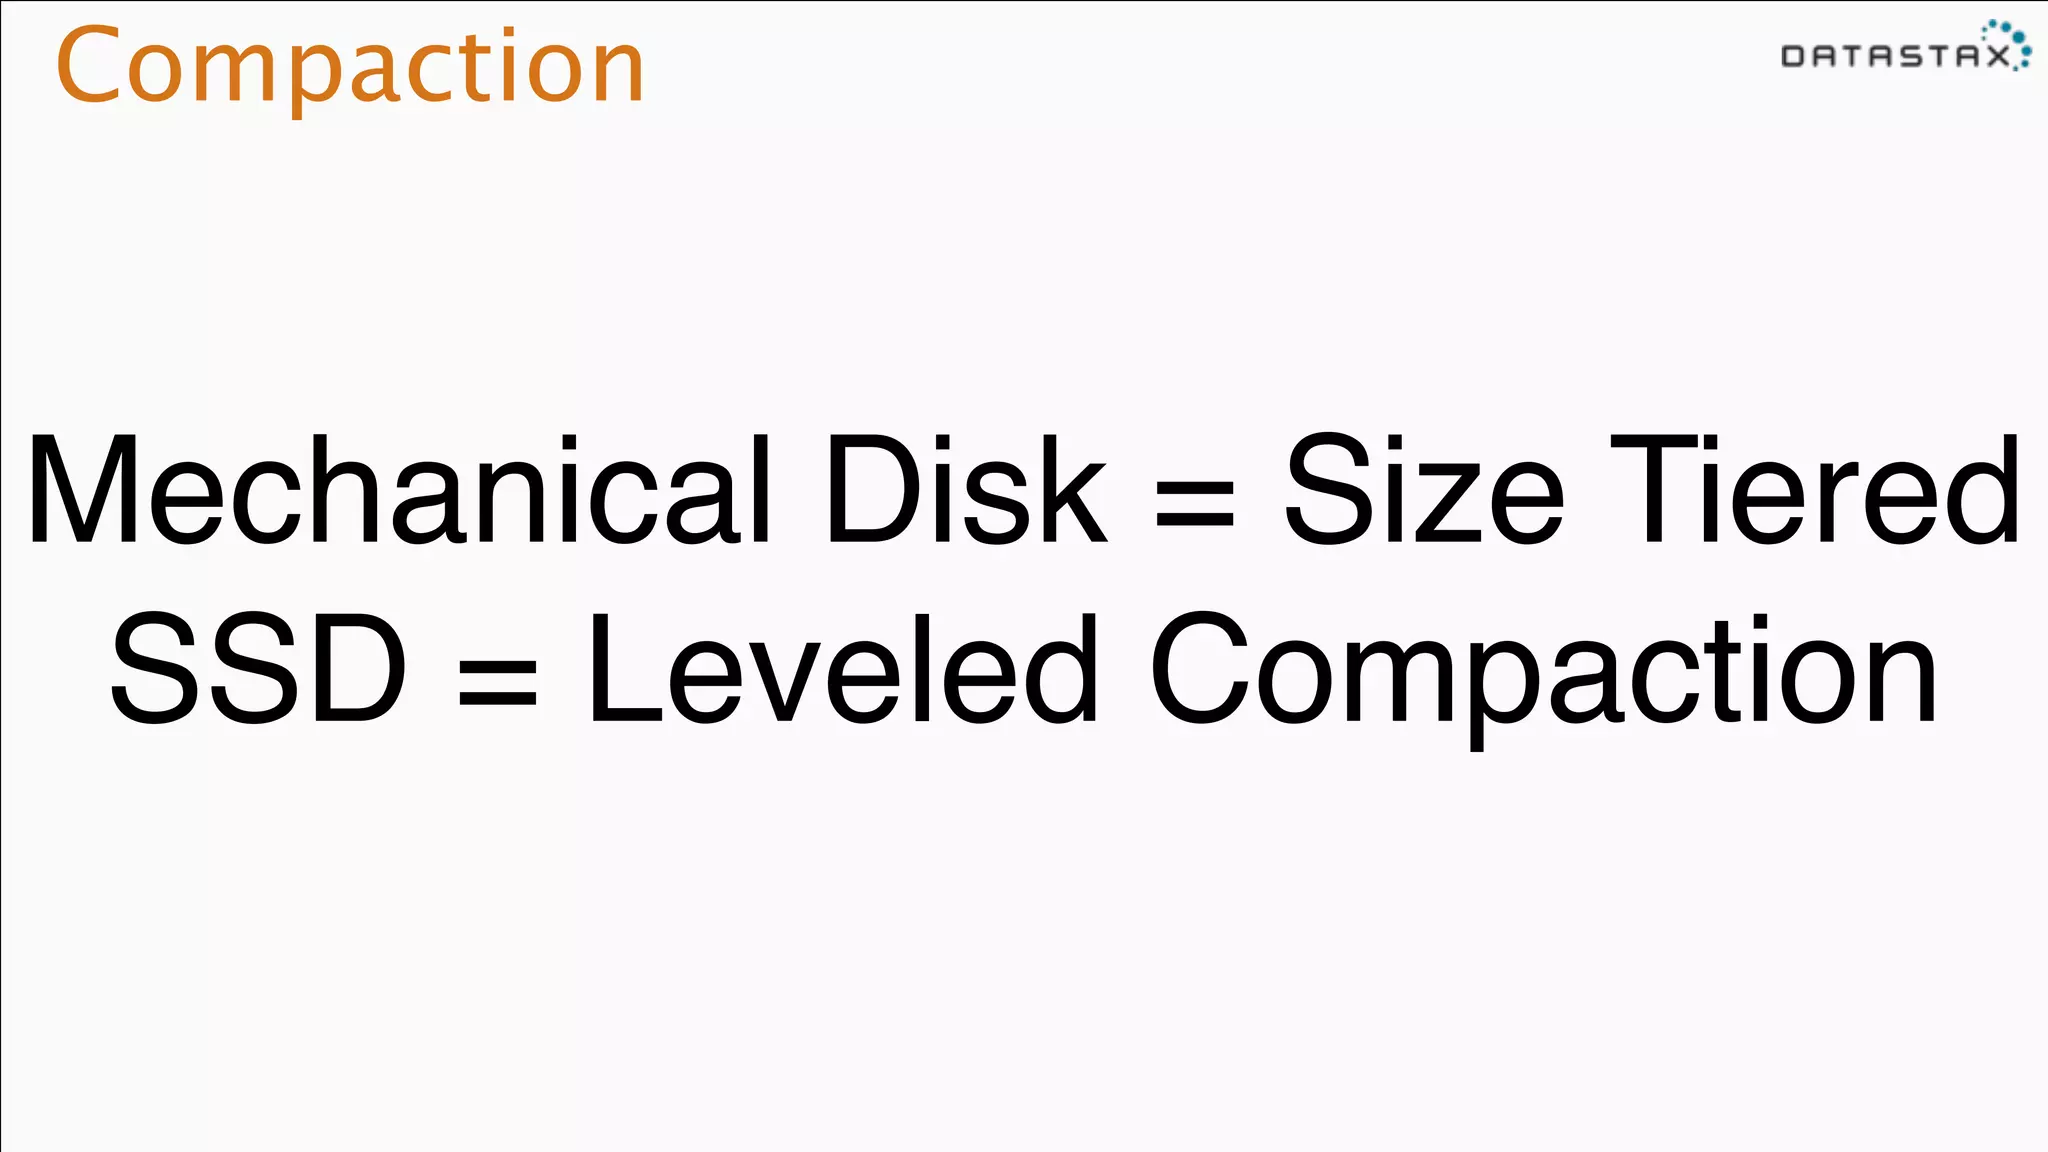
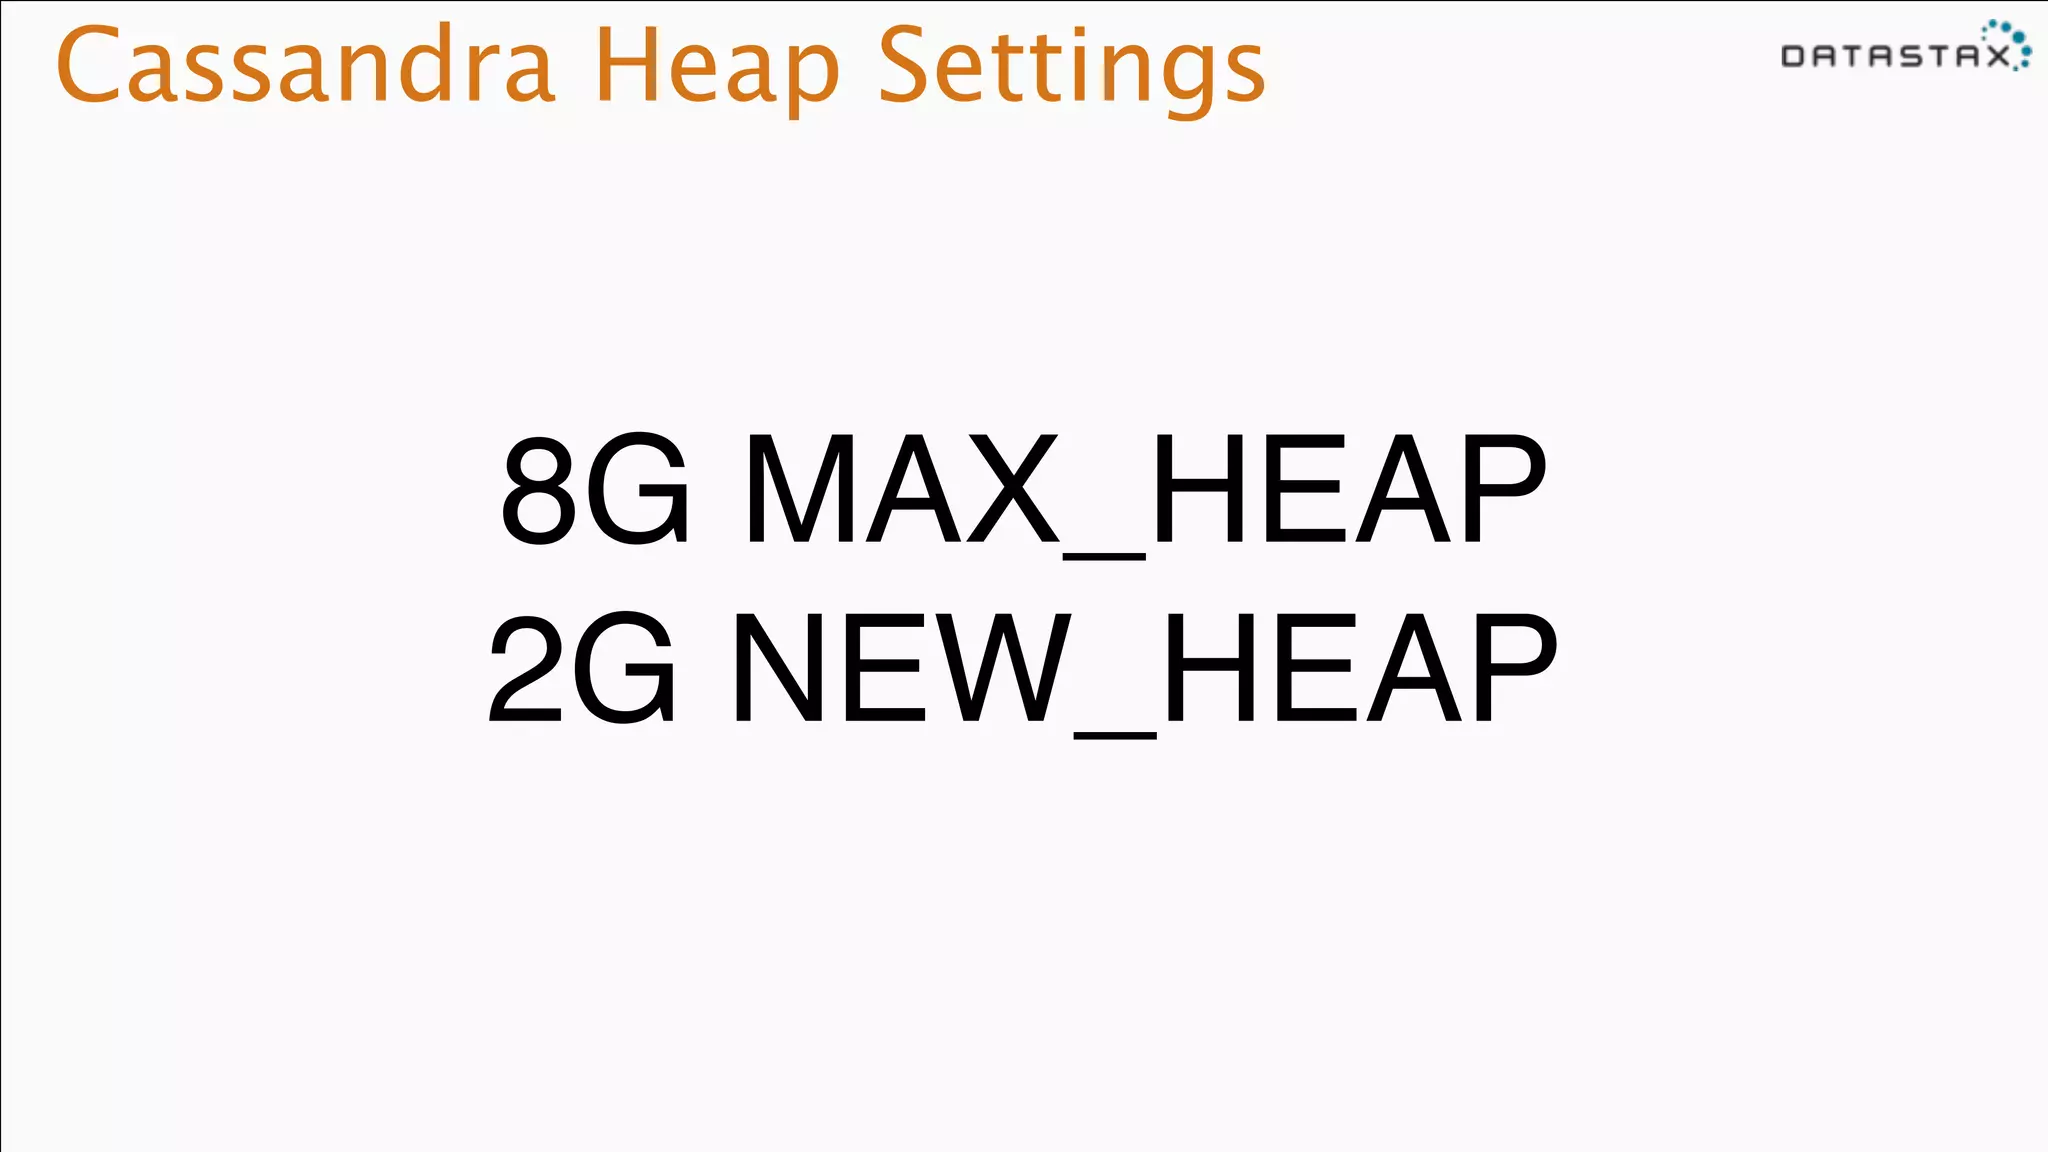
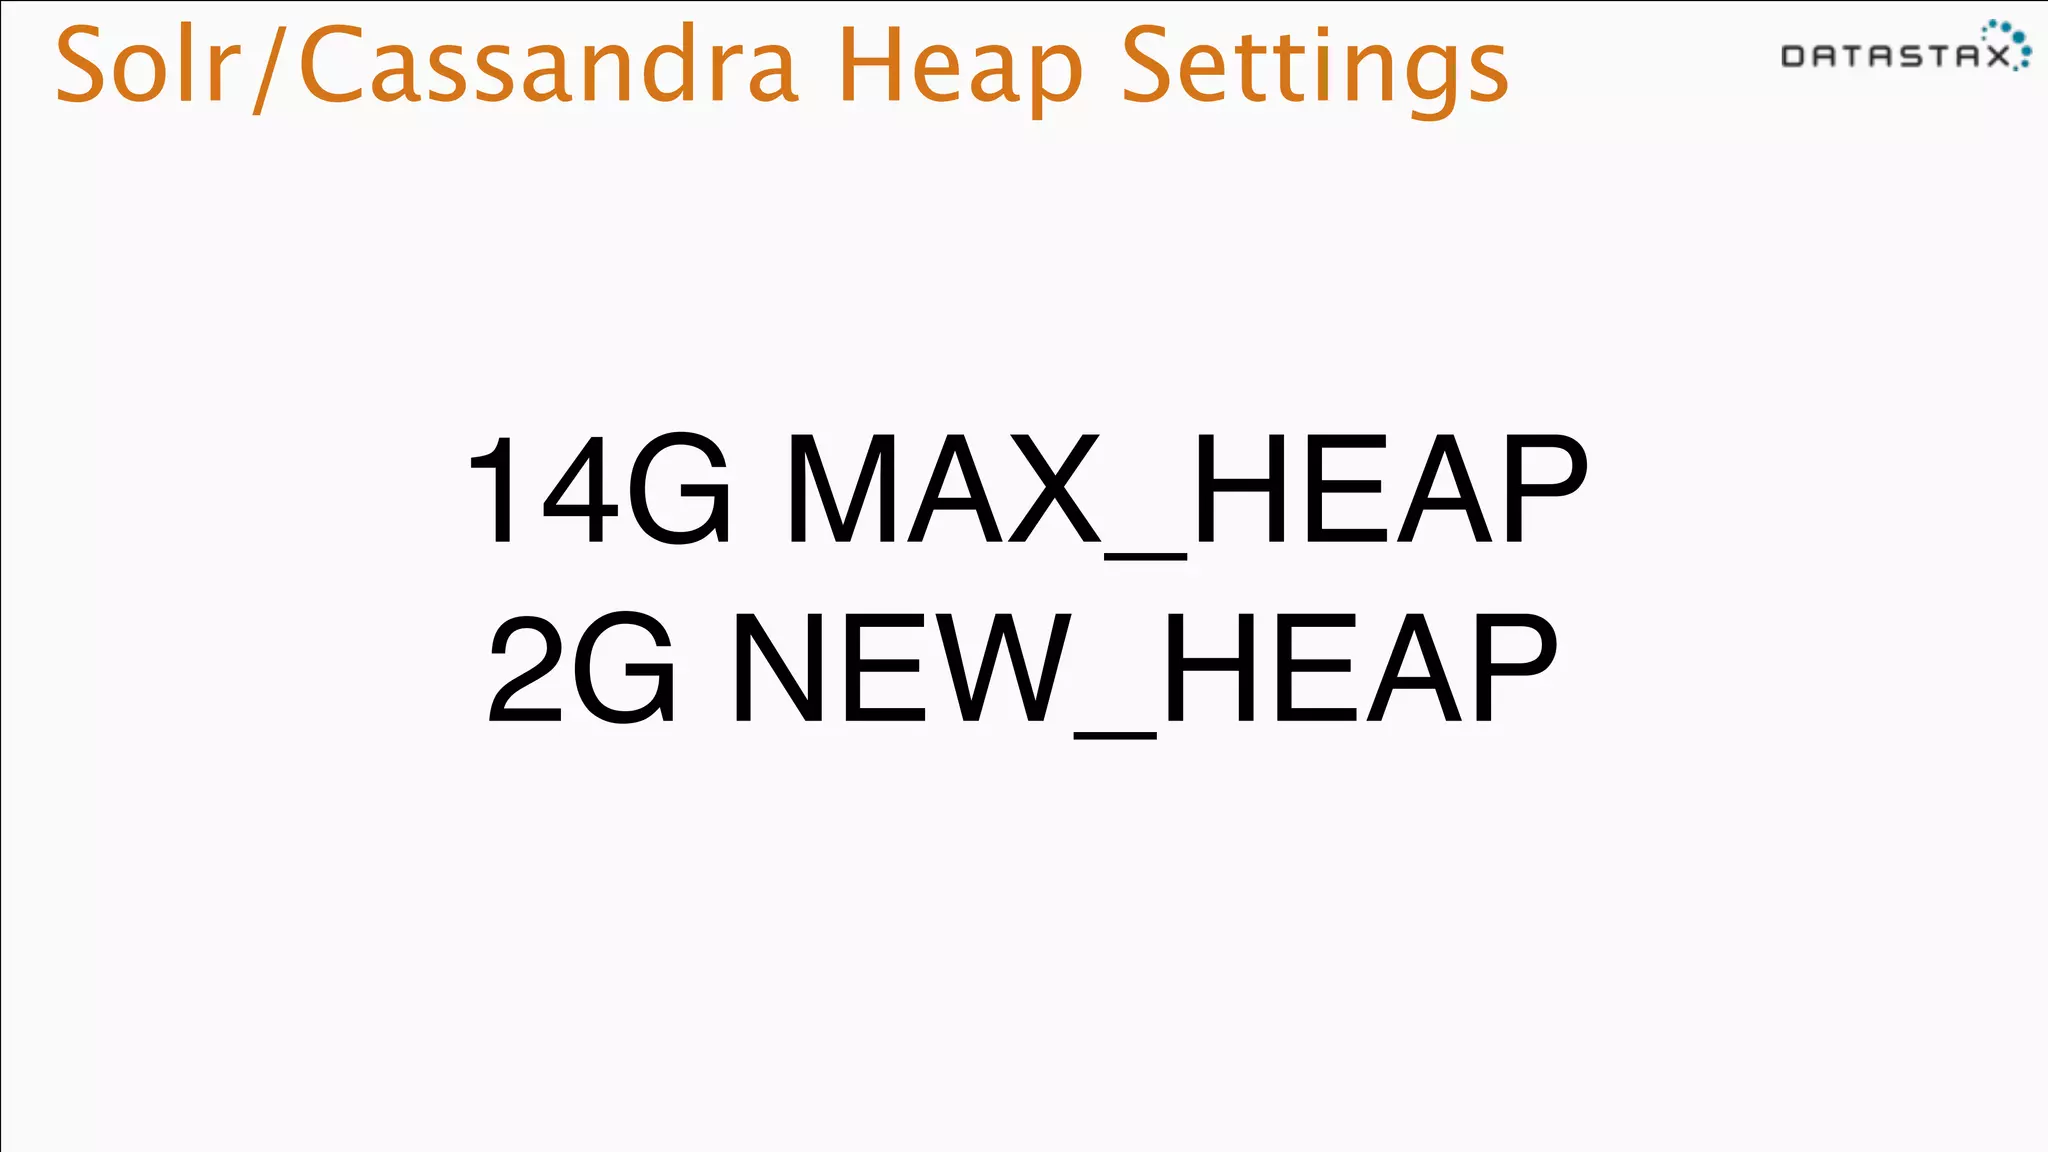
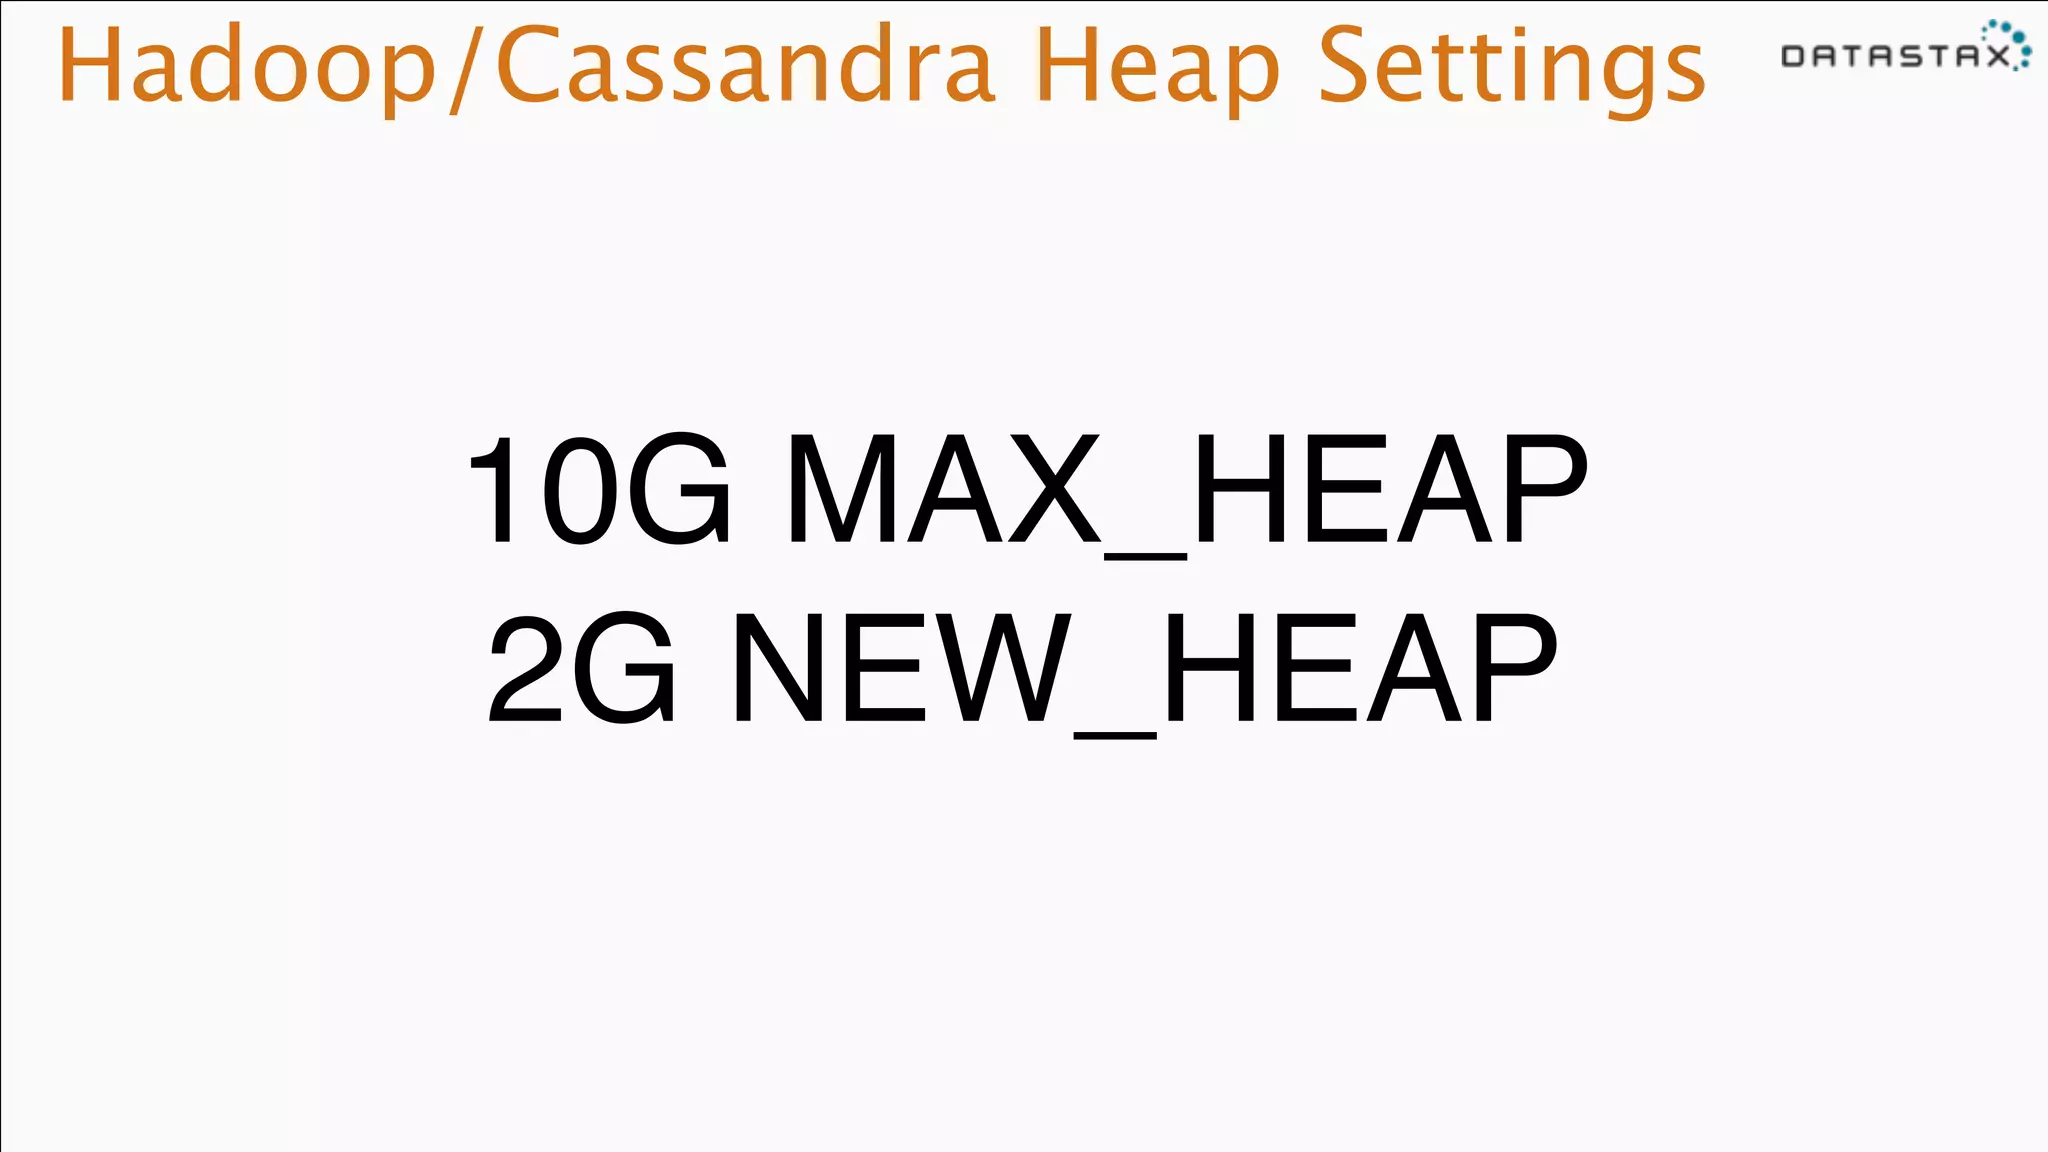

Operations and tuning for Cassandra involve: 1) Ensuring a good data model first before trying to optimize operations, as a bad model cannot be fixed by operations alone. 2) Sizing for latency and operations depends on factors like CPU, memory, disk type and replication factor, with SSDs offering much faster performance than mechanical disks. 3) Various tuning techniques are described like disabling access time, warming the buffer cache, using SSDs, adjusting read ahead and schedulers on SSDs, choosing appropriate compaction strategies, and Cassandra heap size settings.


![[ETHCon Korea 2019] Kim jiyun 김지윤](https://cdn.slidesharecdn.com/ss_thumbnails/kimjiyun-190602030349-thumbnail.jpg?width=640&height=640&fit=bounds)


![[Infographie] Comment ameliorer la qualité de vos données pour votre DMP mark...](https://cdn.slidesharecdn.com/ss_thumbnails/commentameliorerdataqualitydmpmarketing-150325045155-conversion-gate01-thumbnail.jpg?width=640&height=640&fit=bounds)