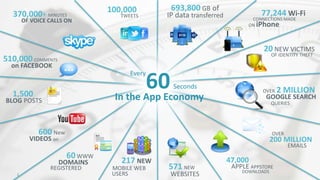
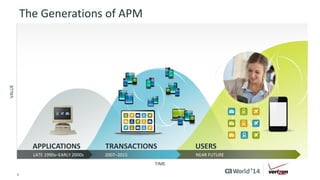
ca Opscenter 
Case Study: Verizon Wireless 
Chasing the Yellow Before They Turn Red 
Joe Convery , Associate Fellow, Verizon Wireless 
Leonid Igolnik, VP , SW Engineering, CA Technologies 
OCX11S #CAWorld
370,000+ MINUTES 
OF VOICE CALLS ON 
510,000 COMMENTS 
on FACEBOOK 
1,500 
BLOG POSTS 
60 WWW 
600 New 
DOMAINS 
VIDEOS on 
REGISTERED 
60 Every 
Seconds 
2 © 2014 CA. ALL RIGHTS RESERVED. 
77,244 Wi-Fi 
CONNECTIONS MADE 
ON iPhone 
OVER 2 MILLION 
GOOGLE SEARCH 
QUERIES 
OVER 
200 MILLION 
EMAILS 
217 NEW 
MOBILE WEB 
USERS 
571 NEW 
WEBSITES 
47,000 
APPLE APPSTORE 
DOWNLOADS 
100,000 
TWEETS 
20 NEW VICTIMS 
OF IDENTITY THEFT 
693,800 GB of 
IP data transferred 
In the App Economy
THIS IS THE AGE OF THE 
APPLICATION ECONOMY 
AND IT’S ALL ABOUT THE 
USERS 
HOW DO YOU EARN THEIR 
LOYALTY? 
3 © 2014 CA. ALL RIGHTS RESERVED.
The Generations of APM 
APPLICATIONS TRANSACTIONS USERS 
LATE 1990s–EARLY 2000s 2007–2015 NEAR FUTURE 
4 © 2014 CA. ALL RIGHTS RESERVED. 
VALUE 
TIME
Organizational Variations 
 We observed that variations in user behavior are often driven by 
organizational differences 
 To better understand this, we examined key characteristics of 
organizational mindsets, philosophies, and processes 
5 © 2014 CA. ALL RIGHTS RESERVED.
Organizational Characteristics 
6 © 2014 CA. ALL RIGHTS RESERVED. 
 Each of these 
organizational types 
had large impact on 
the individuals 
working within them 
 Each organization 
influenced the goals, 
behaviors, and 
interactions of the 
individuals
NMS Challenges (over 5 Years ago) 
 Over 100 Million customers 
 IT Data Network Contains over 10K network elements 
 Legacy Fault Management was solid but had gaps in performance 
management 
 Only threshold alarming 
 No correlation of Netflow stats to Interface SNMP stats 
 Very limited application flow visibility 
 No insight into customer application performance other than 
server side metrics 
7 © 2014 CA. ALL RIGHTS RESERVED.
Solution Selected 
 Combination of tools 
– Netvoyant (now IM2.0) SNMP 
metric collection and reporting 
in Performance Center 
– RA (reporter Analyzer) Netflow 
collection and reporting 
– SuperAgent (aka ADA) Application 
performance based on TCP analaysis 
– CEM – Customer Experience Manager 
– Wiley – Server based Transaction 
Performance 
8 © 2014 CA. ALL RIGHTS RESERVED.
NMS in Some Companies 
Companies try to reduce 
MTTR by fixing outages quicker 
9 © 2014 CA. ALL RIGHTS RESERVED. 
Companies try to reduce MTTR by 
preventing outages from happening 
Fault 
Performance 
Management 
Capacity Planning 
and Data Analytics 
Fault Management 
Performance 
Capacity 
OLD WAY OF DOING THINGS NEWER WAY OF DOING THINGS
MTTR vs. MTTI 
MTTR – Mean Time to Repair – Companies spend a lot of time trying to decrease this. 
MTTI – Mean Time to Identify – When they should spend just as much time on improving this. 
Fault Detected 
Outage escalation 
Outage bridge engaged and trouble shooting started 
Root cause identified and 
Mitigation efforts started 
10 © 2014 CA. ALL RIGHTS RESERVED. 
Outage closed and BAU
MTTI Scenario 
React to performance related issues 
and mitigate the potential outage 
Performance issue detected 
Customer starts to experience 
degraded performance 
Length oNf poo oteunttaiagl eis esuxep eriences 
11 © 2014 CA. ALL RIGHTS RESERVED.
Application and Network Performance Insight 
SNMP Insight: 
Server Interface both seem 
to be active at same time 
Application Flow: 
Insight: into individual 
client server flows 
12 © 2014 CA. ALL RIGHTS RESERVED.
Correlation of Network and Application Metrics 
13 © 2014 CA. ALL RIGHTS RESERVED.
Business Transaction Summarization 
14 © 2014 CA. ALL RIGHTS RESERVED.
For More Information 
Insert appropriate screenshot and text overlay 
from following “More Info Graphics” slide here; 
DevOps 
ensure it links to correct page 
To learn more about DevOps, please visit: 
http://bit.ly/1wbjjqX 
15 © 2014 CA. ALL RIGHTS RESERVED.
For Informational Purposes Only 
Terms of this Presentation 
This presentation provided at CA World 2014 is intended for information purposes only and does not form any type of warranty. 
Content provided in this presentation has not been reviewed for accuracy and is based on information provided by CA Partners 
and Customers. 
16 © 2014 CA. ALL RIGHTS RESERVED.

Case Study: Verizon Wireless: Chasing the Yellow Before They Turn Red

  • 1.
    ca Opscenter CaseStudy: Verizon Wireless Chasing the Yellow Before They Turn Red Joe Convery , Associate Fellow, Verizon Wireless Leonid Igolnik, VP , SW Engineering, CA Technologies OCX11S #CAWorld
  • 2.
    370,000+ MINUTES OFVOICE CALLS ON 510,000 COMMENTS on FACEBOOK 1,500 BLOG POSTS 60 WWW 600 New DOMAINS VIDEOS on REGISTERED 60 Every Seconds 2 © 2014 CA. ALL RIGHTS RESERVED. 77,244 Wi-Fi CONNECTIONS MADE ON iPhone OVER 2 MILLION GOOGLE SEARCH QUERIES OVER 200 MILLION EMAILS 217 NEW MOBILE WEB USERS 571 NEW WEBSITES 47,000 APPLE APPSTORE DOWNLOADS 100,000 TWEETS 20 NEW VICTIMS OF IDENTITY THEFT 693,800 GB of IP data transferred In the App Economy
  • 3.
    THIS IS THEAGE OF THE APPLICATION ECONOMY AND IT’S ALL ABOUT THE USERS HOW DO YOU EARN THEIR LOYALTY? 3 © 2014 CA. ALL RIGHTS RESERVED.
  • 4.
    The Generations ofAPM APPLICATIONS TRANSACTIONS USERS LATE 1990s–EARLY 2000s 2007–2015 NEAR FUTURE 4 © 2014 CA. ALL RIGHTS RESERVED. VALUE TIME
  • 5.
    Organizational Variations We observed that variations in user behavior are often driven by organizational differences  To better understand this, we examined key characteristics of organizational mindsets, philosophies, and processes 5 © 2014 CA. ALL RIGHTS RESERVED.
  • 6.
    Organizational Characteristics 6© 2014 CA. ALL RIGHTS RESERVED.  Each of these organizational types had large impact on the individuals working within them  Each organization influenced the goals, behaviors, and interactions of the individuals
  • 7.
    NMS Challenges (over5 Years ago)  Over 100 Million customers  IT Data Network Contains over 10K network elements  Legacy Fault Management was solid but had gaps in performance management  Only threshold alarming  No correlation of Netflow stats to Interface SNMP stats  Very limited application flow visibility  No insight into customer application performance other than server side metrics 7 © 2014 CA. ALL RIGHTS RESERVED.
  • 8.
    Solution Selected Combination of tools – Netvoyant (now IM2.0) SNMP metric collection and reporting in Performance Center – RA (reporter Analyzer) Netflow collection and reporting – SuperAgent (aka ADA) Application performance based on TCP analaysis – CEM – Customer Experience Manager – Wiley – Server based Transaction Performance 8 © 2014 CA. ALL RIGHTS RESERVED.
  • 9.
    NMS in SomeCompanies Companies try to reduce MTTR by fixing outages quicker 9 © 2014 CA. ALL RIGHTS RESERVED. Companies try to reduce MTTR by preventing outages from happening Fault Performance Management Capacity Planning and Data Analytics Fault Management Performance Capacity OLD WAY OF DOING THINGS NEWER WAY OF DOING THINGS
  • 10.
    MTTR vs. MTTI MTTR – Mean Time to Repair – Companies spend a lot of time trying to decrease this. MTTI – Mean Time to Identify – When they should spend just as much time on improving this. Fault Detected Outage escalation Outage bridge engaged and trouble shooting started Root cause identified and Mitigation efforts started 10 © 2014 CA. ALL RIGHTS RESERVED. Outage closed and BAU
  • 11.
    MTTI Scenario Reactto performance related issues and mitigate the potential outage Performance issue detected Customer starts to experience degraded performance Length oNf poo oteunttaiagl eis esuxep eriences 11 © 2014 CA. ALL RIGHTS RESERVED.
  • 12.
    Application and NetworkPerformance Insight SNMP Insight: Server Interface both seem to be active at same time Application Flow: Insight: into individual client server flows 12 © 2014 CA. ALL RIGHTS RESERVED.
  • 13.
    Correlation of Networkand Application Metrics 13 © 2014 CA. ALL RIGHTS RESERVED.
  • 14.
    Business Transaction Summarization 14 © 2014 CA. ALL RIGHTS RESERVED.
  • 15.
    For More Information Insert appropriate screenshot and text overlay from following “More Info Graphics” slide here; DevOps ensure it links to correct page To learn more about DevOps, please visit: http://bit.ly/1wbjjqX 15 © 2014 CA. ALL RIGHTS RESERVED.
  • 16.
    For Informational PurposesOnly Terms of this Presentation This presentation provided at CA World 2014 is intended for information purposes only and does not form any type of warranty. Content provided in this presentation has not been reviewed for accuracy and is based on information provided by CA Partners and Customers. 16 © 2014 CA. ALL RIGHTS RESERVED.