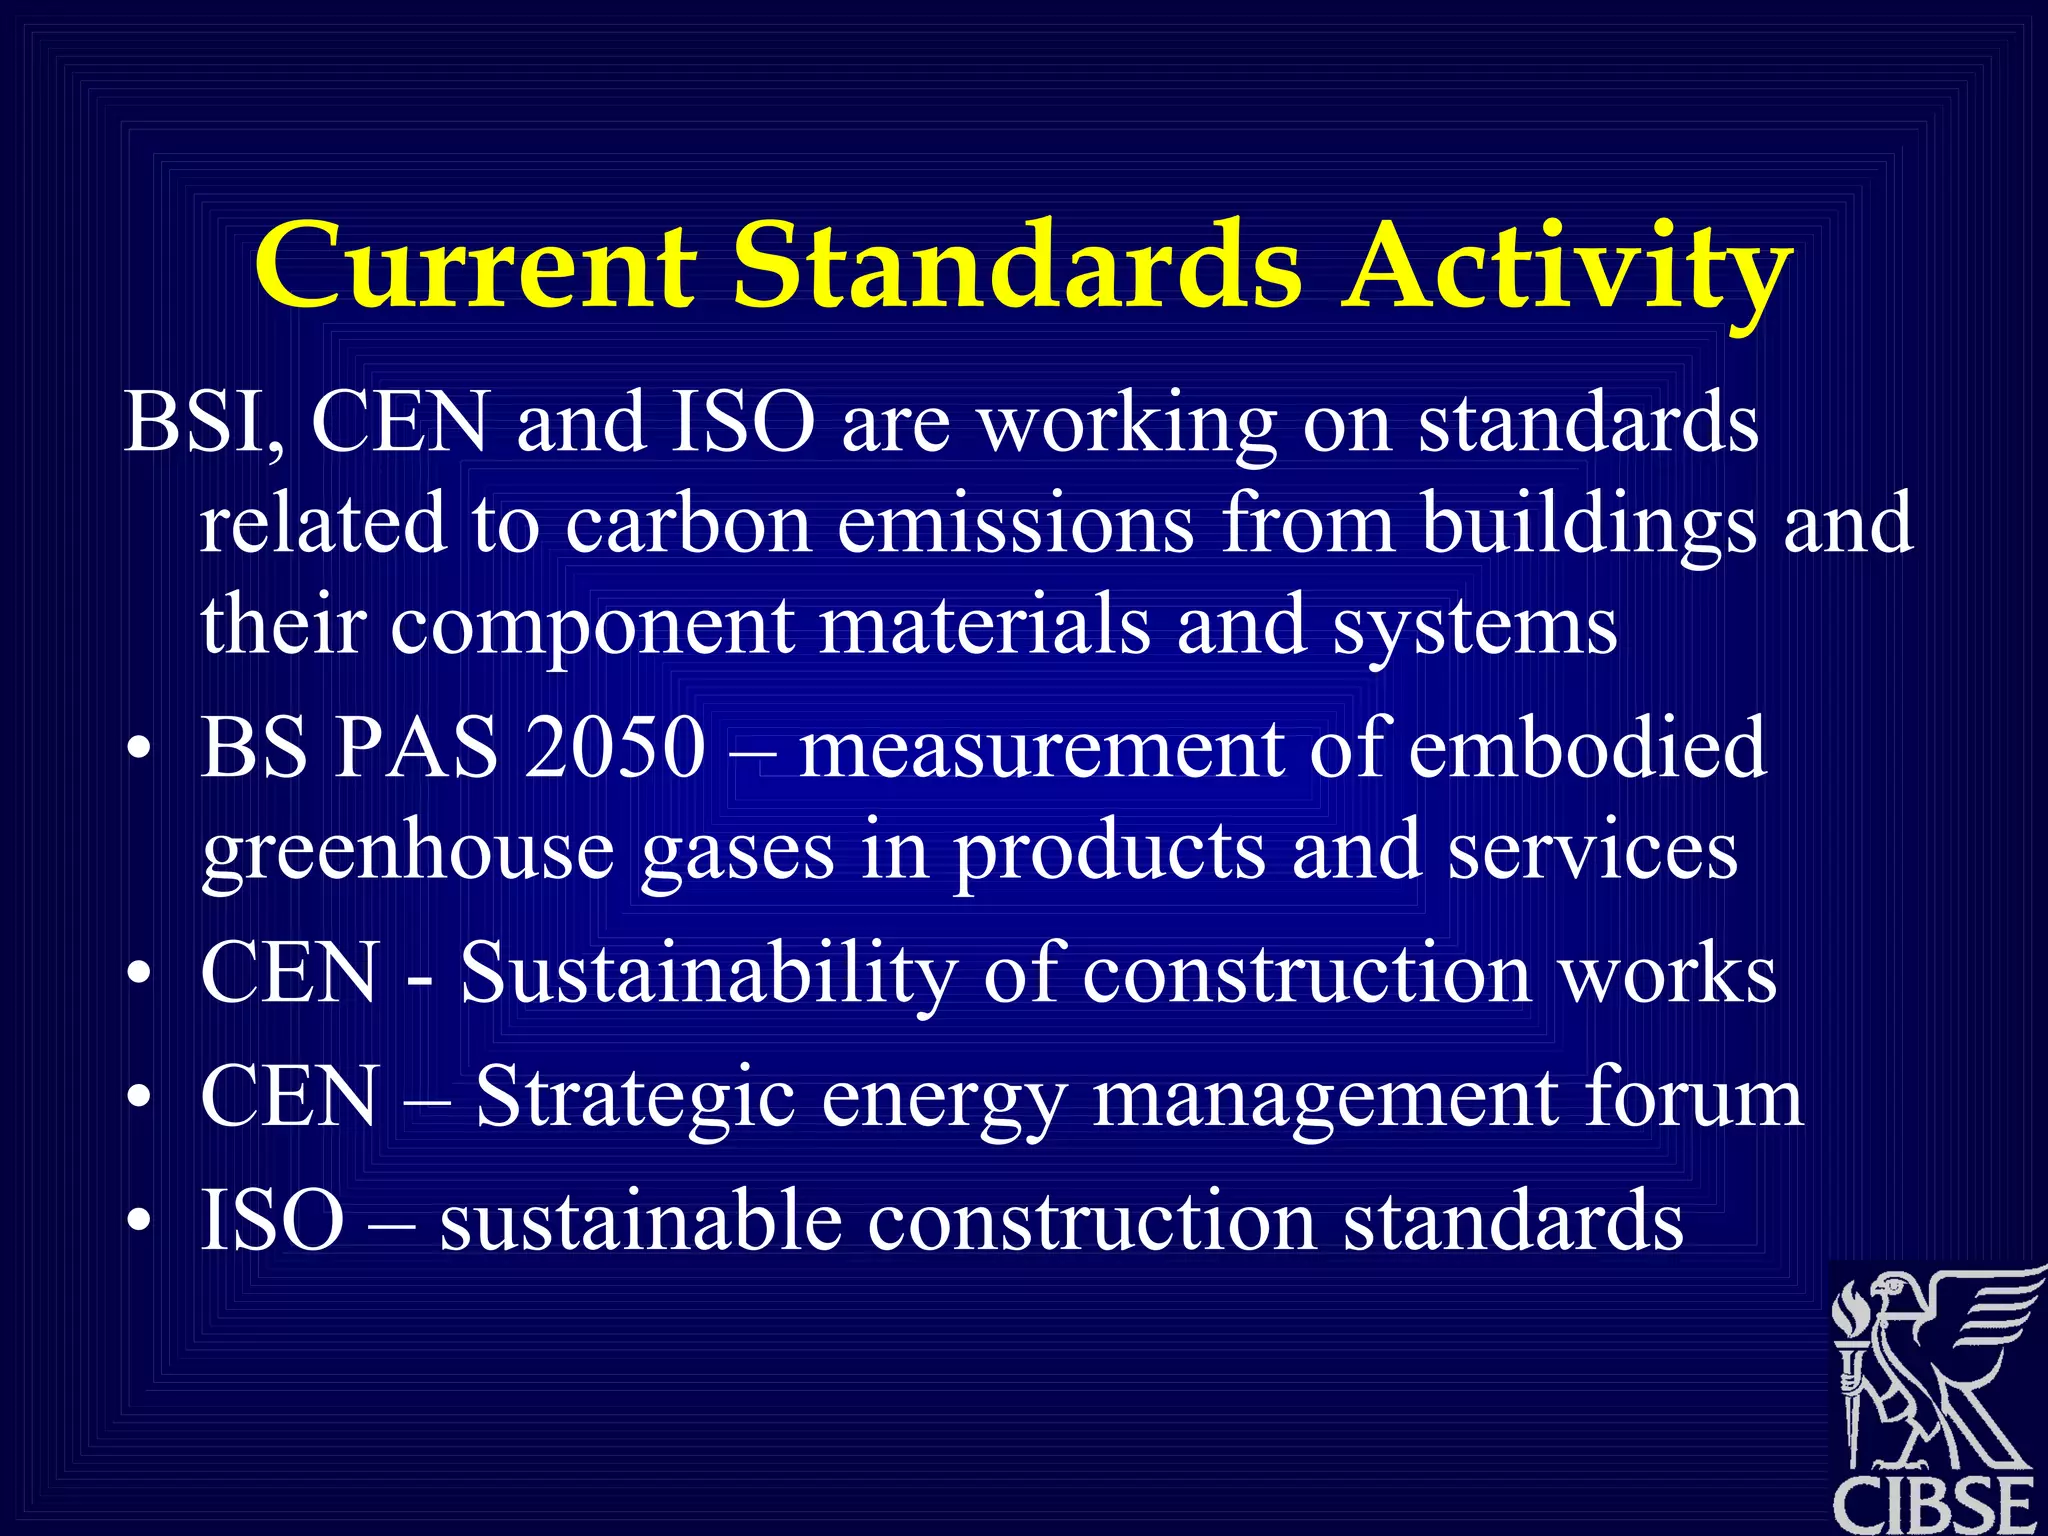
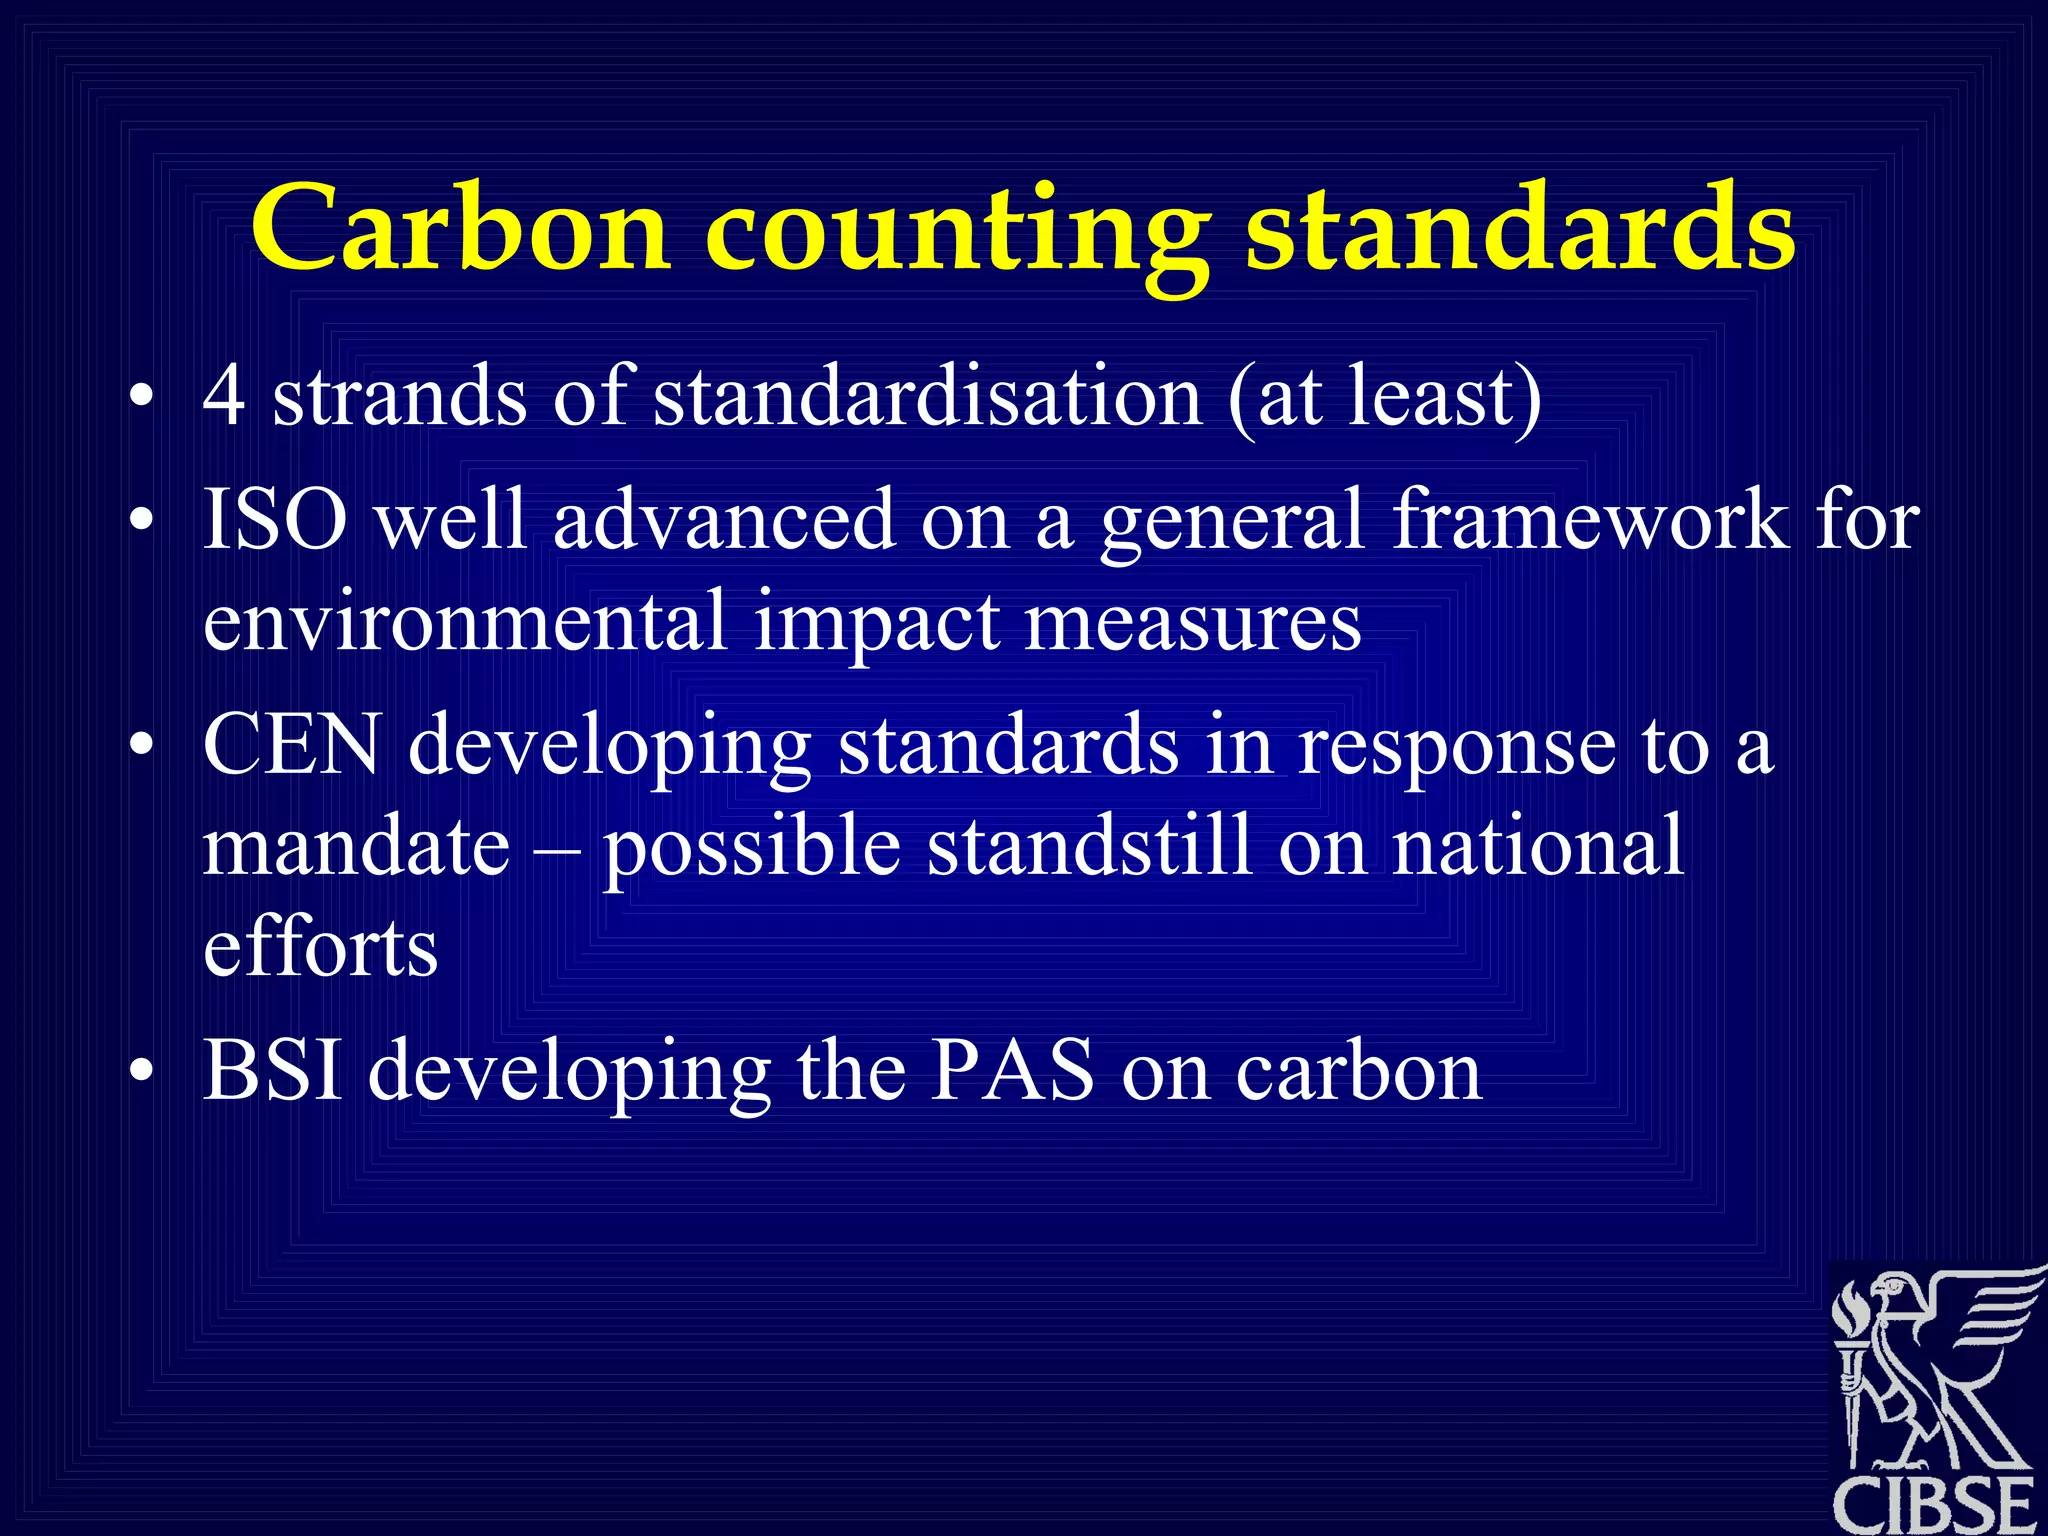
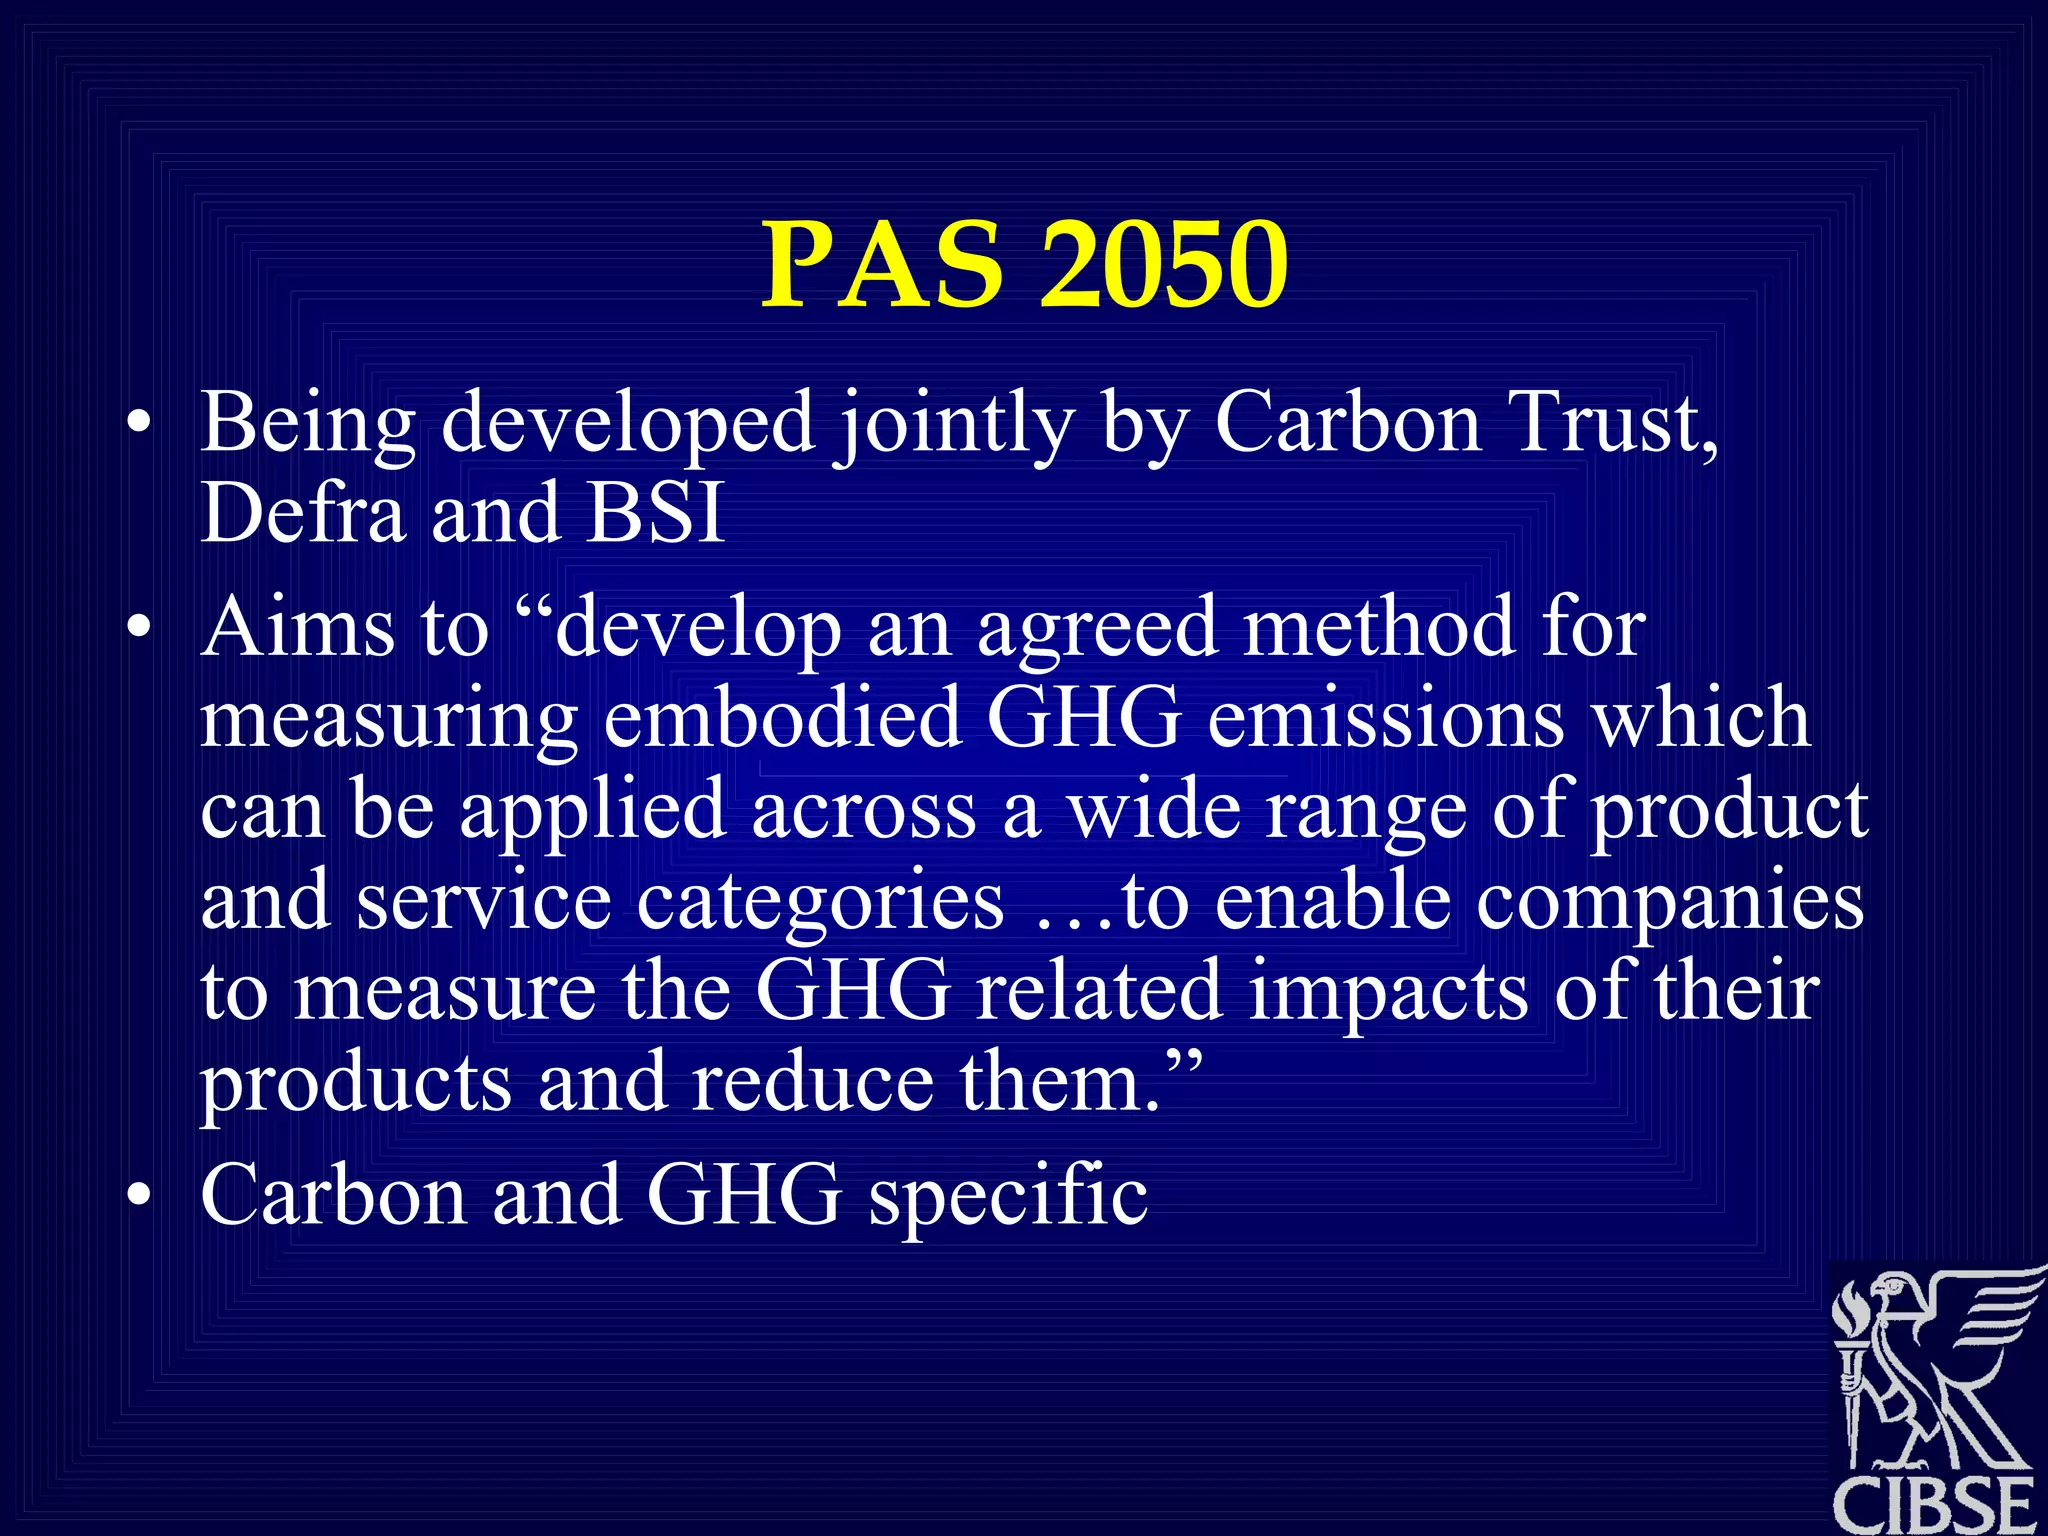
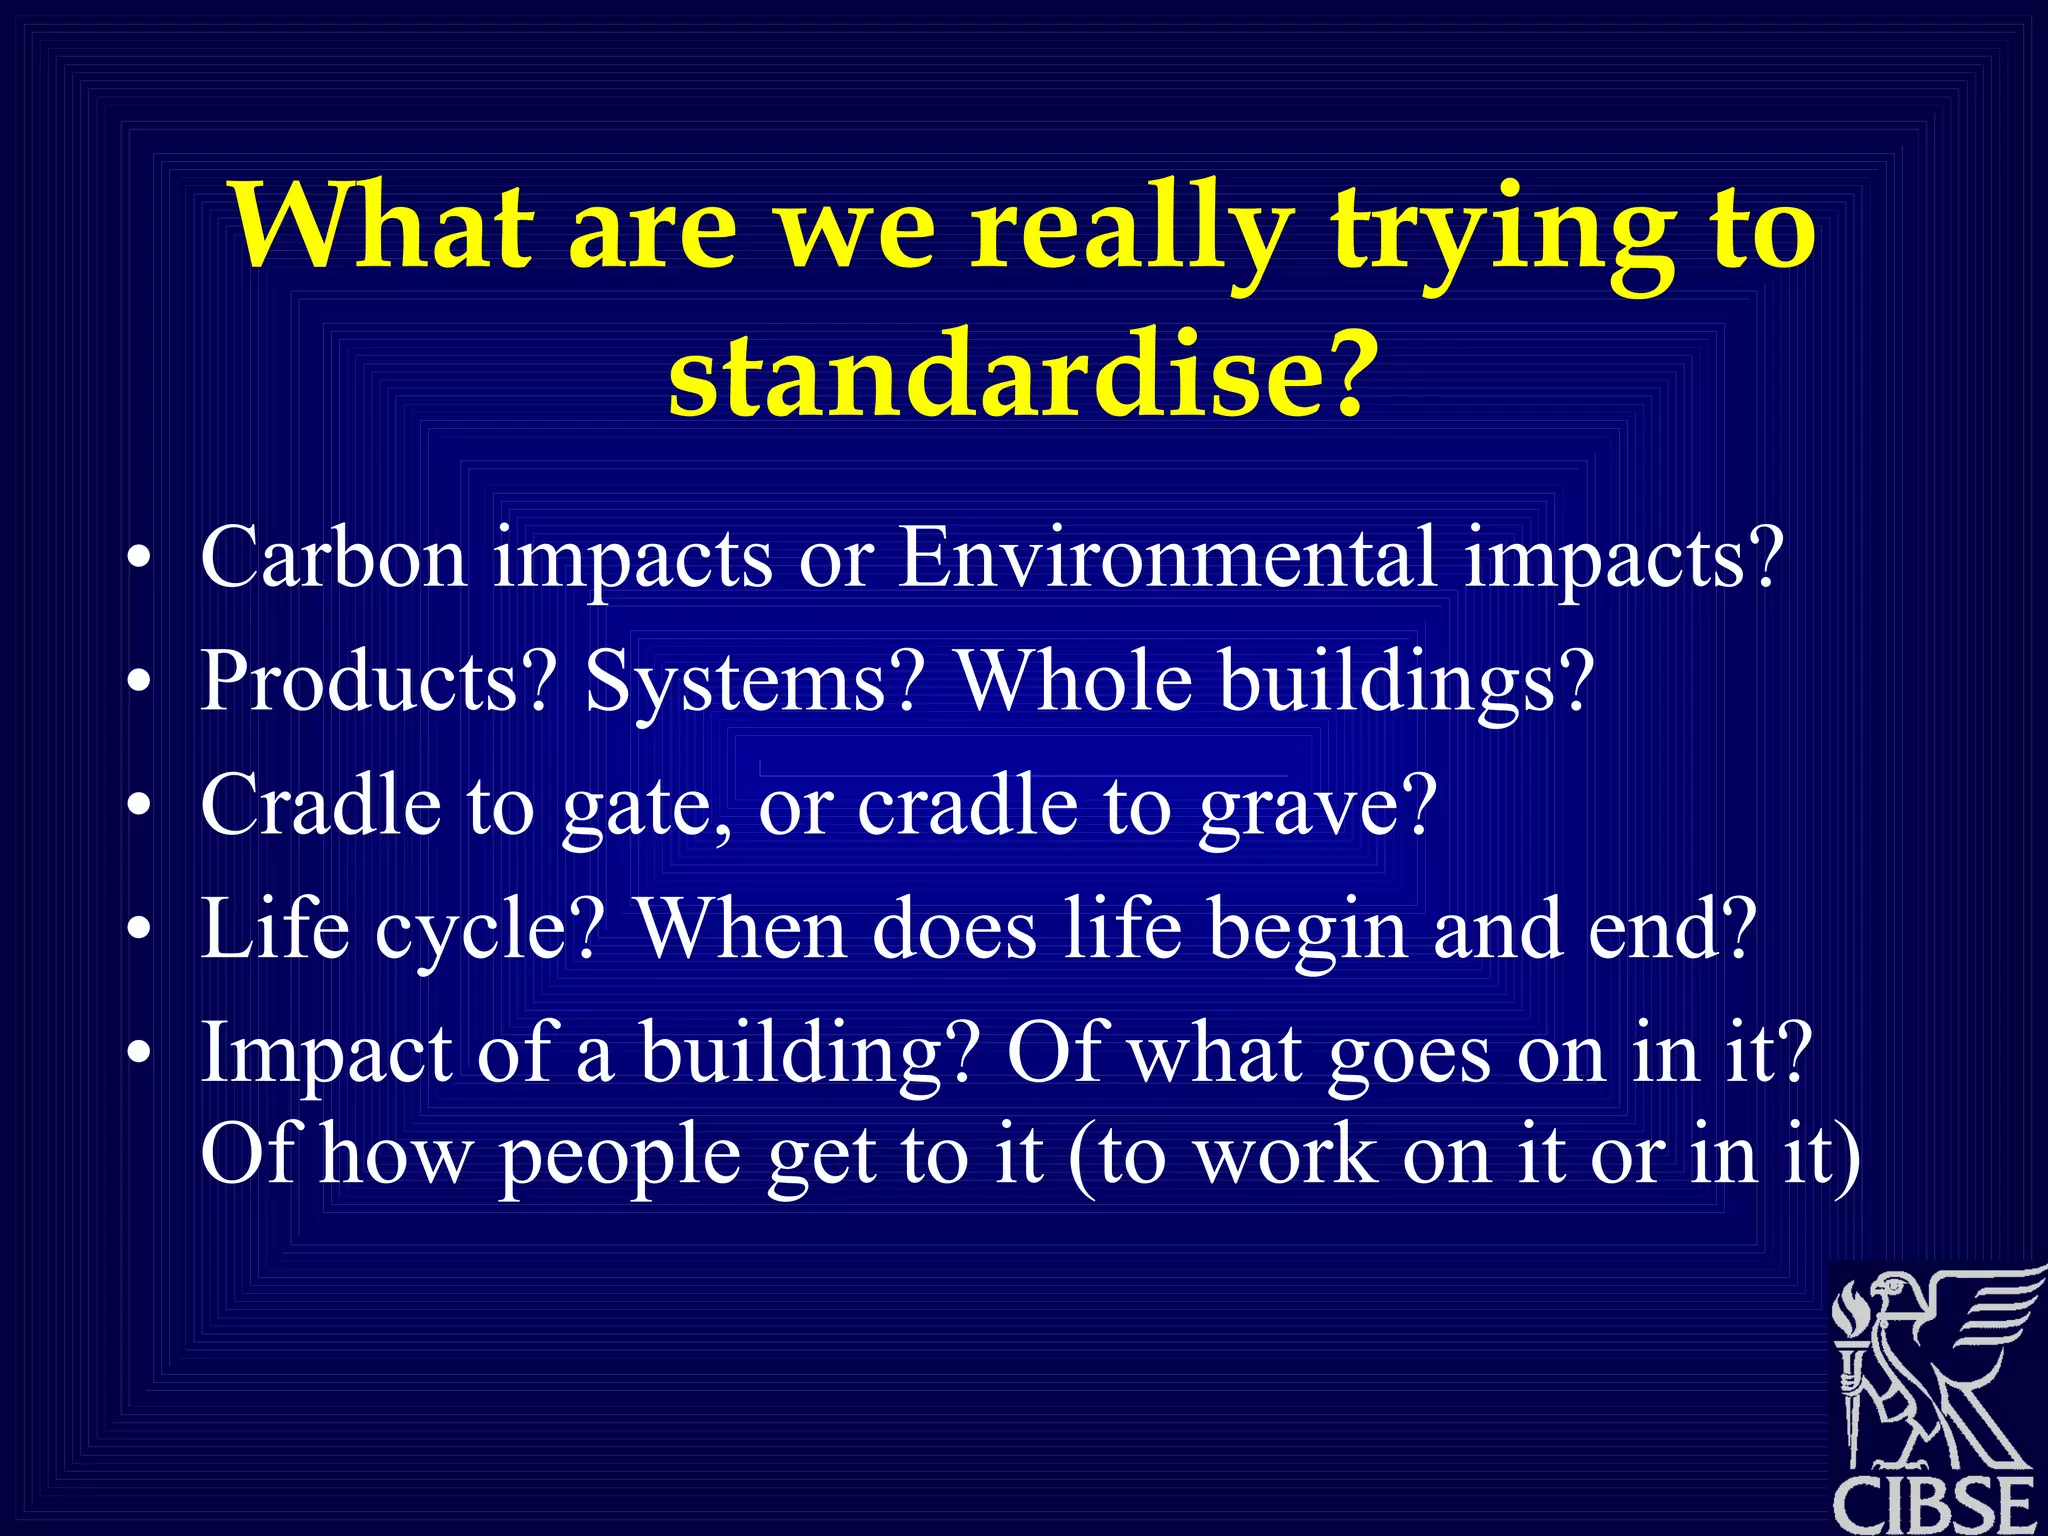
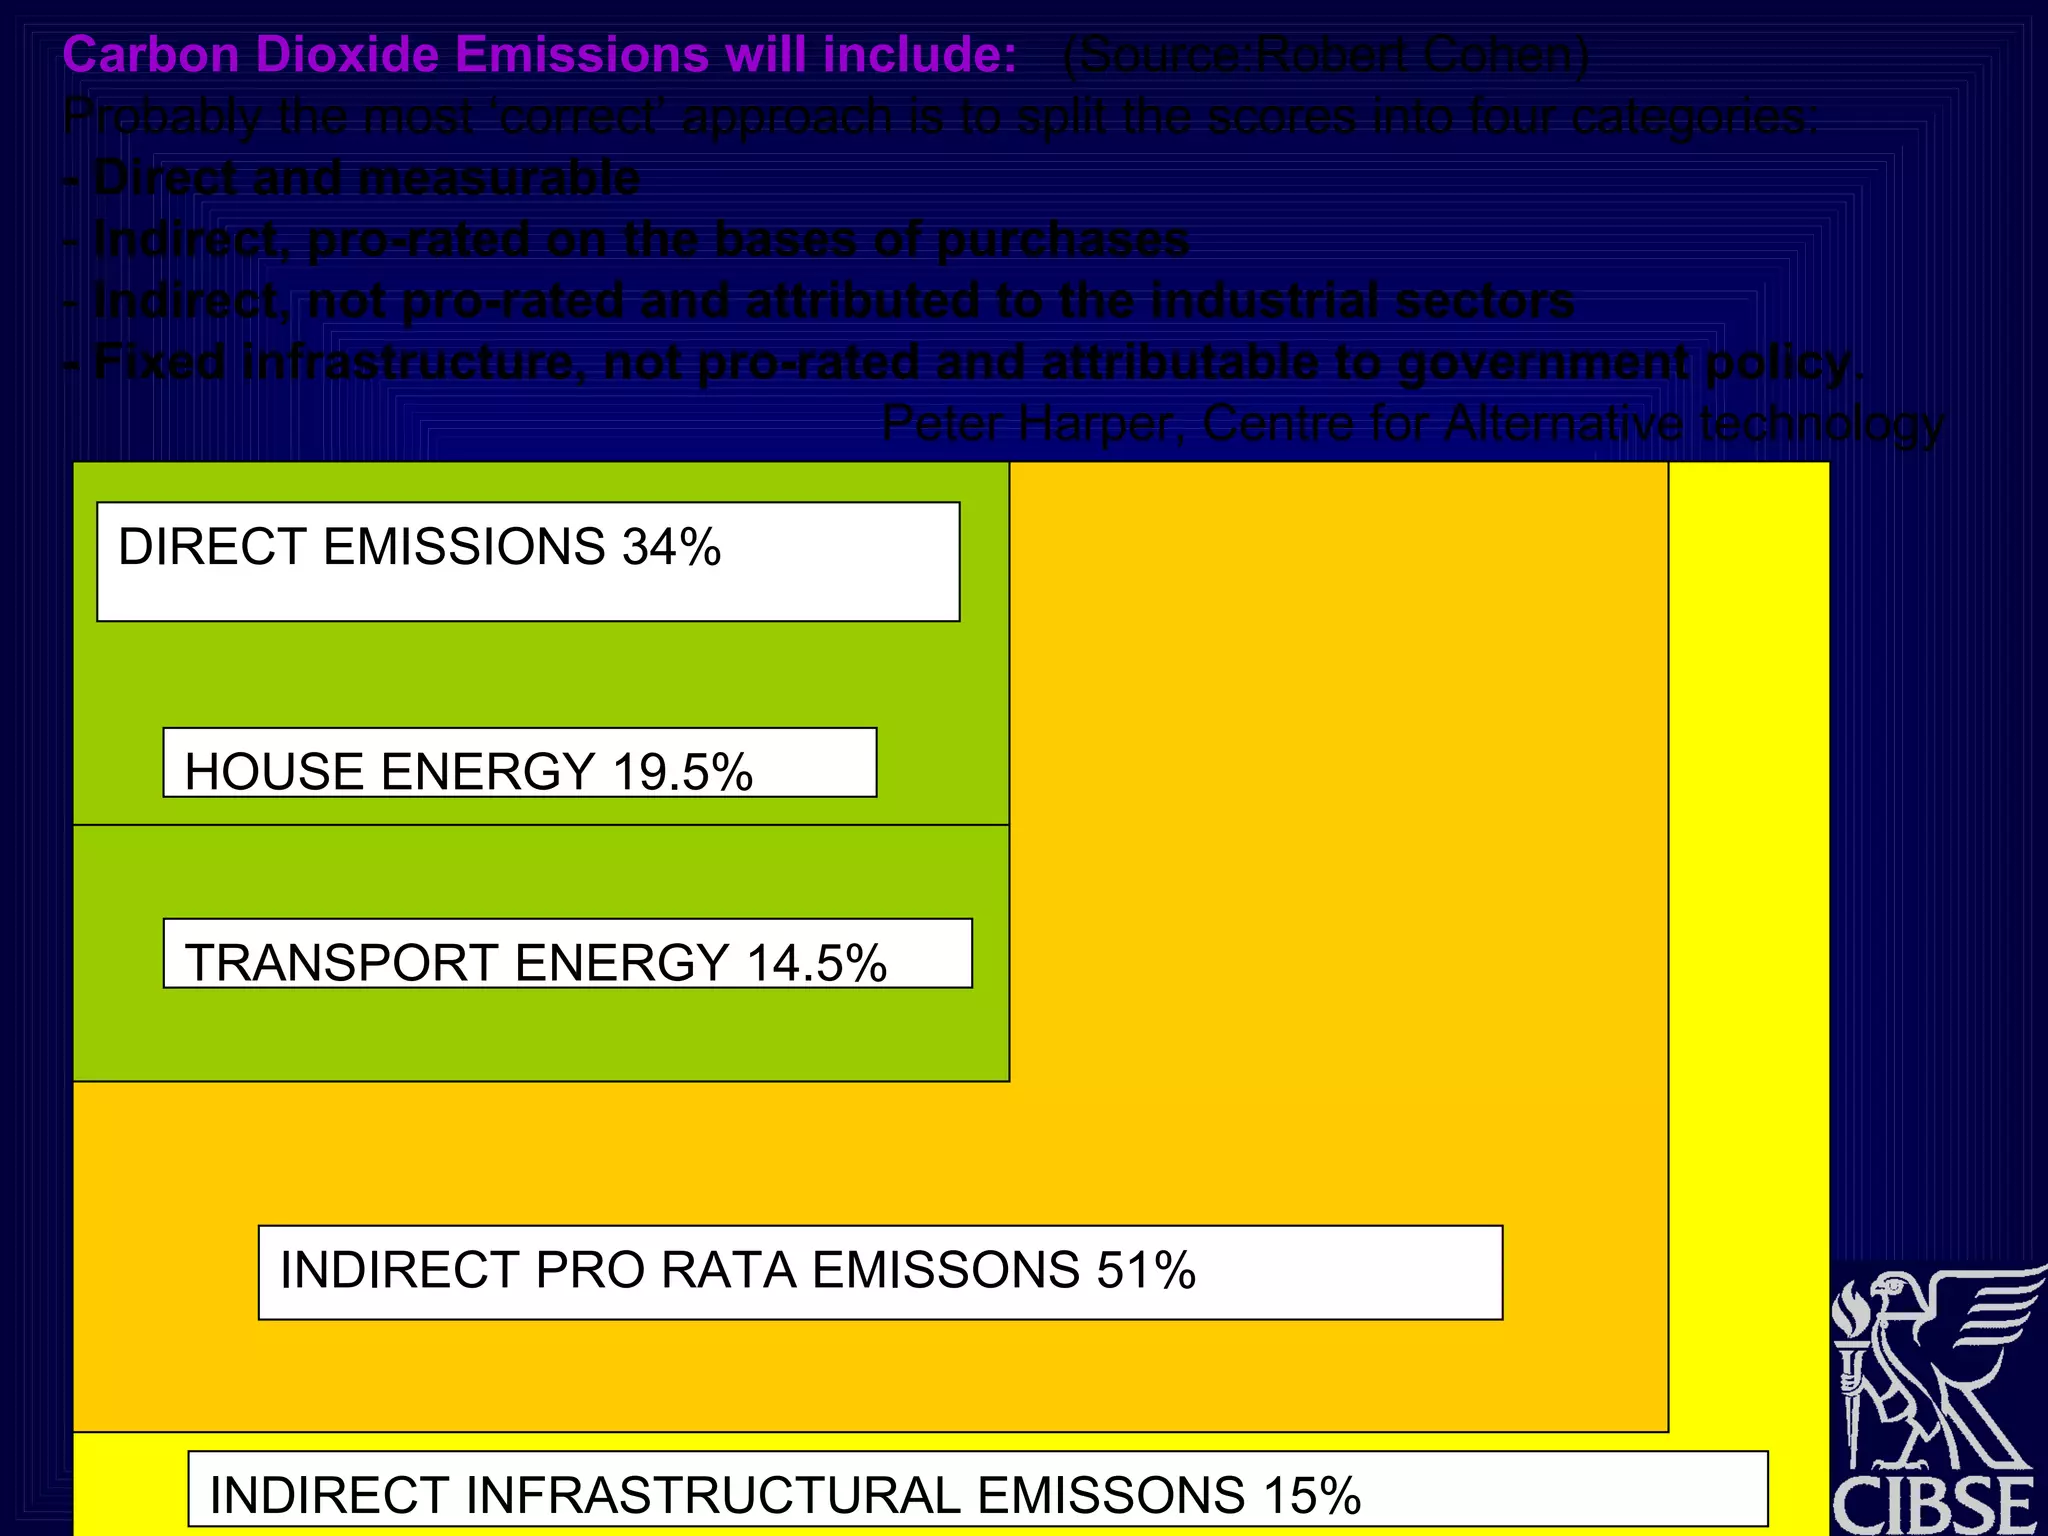
Towards a Standard for Carbon Accounting: a view from CIBSE Hywel Davies CIBSE Technical Director and Stuart Macpherson  Irons Foulner Consulting Engineers
Current Standards Activity BSI, CEN and ISO are working on standards related to carbon emissions from buildings and their component materials and systems BS PAS 2050 – measurement of embodied greenhouse gases in products and services CEN -  Sustainability of construction works CEN – Strategic energy management forum ISO – sustainable construction standards
Carbon counting standards 4 strands of standardisation (at least) ISO well advanced on a general framework for environmental impact measures CEN developing standards in response to a mandate – possible standstill on national efforts BSI developing the PAS on carbon
PAS 2050 Being developed jointly by Carbon Trust, Defra and BSI Aims to “develop an agreed method for measuring embodied GHG emissions which can be applied across a wide range of product and service categories …to enable companies to measure the GHG related impacts of their products and reduce them.” Carbon and GHG specific
Directives The EPBD Scottish Building Standards Energy Assessors in Scotland
Carbon Accounting? Its not just about counting carbon, but controlling it Thank you for listening – Any questions?
What are we really trying to standardise? Carbon impacts or Environmental impacts? Products? Systems? Whole buildings? Cradle to gate, or cradle to grave?  Life cycle? When does life begin and end? Impact of a building? Of what goes on in it? Of how people get to it (to work on it or in it)
Comparing corporate performance on climate change – what metrics? Dr. Craig Mackenzie Director, Carbon Benchmarking Project University of Edinburgh Business School
The scope for low cost reductions Source: Vattenfal
Breakdown of the Tesco footprint Add note on fridge energy? Refrigeration  Tesco CSR Report 2007
Direct CO2e emissions No  Data
Relative carbon intensity? NB: this slide does not give an accurate comparison of performance No  Data
Meaningful comparison? NB: this slide does not give an accurate comparison of performance Food  processing  business Food non-food split Food- non-food split Food non-food split Use of  biodiesel Green tariff electricity Green tariff electricity Data  estimated Data  incomplete No  Data
An alternative strategy Add note on fridge energy? Refrigeration  Tesco CSR Report 2007 % f-gas  leakage pa KWh/linear meter of refrigeration Diesel litres/pallet delivered Average store energy rating % electricity from renewables  weighted for additionality
Wider implications  Benchmarking needs: Better data quality Sharper standards Segmental carbon reporting Identification and reporting on normalisation factors Avoiding carbon reductionism Activity-specific metrics Activity/sector-specific reporting standards Collaborative sector/activity projects to define the above
Westminster carbon counting conference, ICE, 24 January 2008 JOINING THINGS UP FOR BUILDINGS Bill Bordass the  Usable Buildings Trust www.usablebuildings.co.uk
We need to save real carbon,  not virtual carbon
The Credibility Gap for a green building award winner
Saving energy and CO 2  in a hurry,   using the multiplier effect   Reduced demands  standards, passive measures x  0.5? 50 % Increased efficiency  better technology, lower resistances x 0.5? 25 % Waste avoidance  better control, management, behaviour? Less 20%?   (it could easily be more)  20 % Low-carbon energy supplies   on and off-site Halve the carbon content of the supplies? 10% To get rapid and cost-effective change, we must press ALL the buttons NOT, for example relying on a business-as-usual fix with renewables: they won’t work alone!
Use renewable supplies   AND   make buildings efficient in use
Making Performance Visible  with building energy certificates Ambitions of Europrosper research project 2000-04: Display energy certs based on actual energy use.  Achieved Transparency between expectations and outcomes. Incomplete Multiple performance indicators Incomplete We now need voluntary supporting measures
Passing on carbon + energy BPF Landlord’s statement Improves transparency Includes multiple performance indicators Allows individual tenants to add the energy they purchase directly and prepare Display Energy Certificates on same basis as whole buildings. Avoids double handling if it allows the transfer of carbon from landlord to tenant for the purpose of the Carbon Reduction Commitment. Interest being shown by other sectors  (business centres, retail, industrial
Passing on carbon + energy  BPF Landlord’s statement
Drilling down further to assign realistic priorities
Drilling down even further: actual versus predicted for lighting
Carbon Counting for Neighbourhoods and Cities Dr Rajat Gupta Department of Architecture [email_address] Westminster Carbon Counting Conference 24 January 2008, London
Core methodologies used in DECoRuM Underlying physically-based energy models: BREDEM –12 linked to SAP 2001. Cost-benefit analysis approach
Outputs from DECoRuM
Framework for baseline predictions DECoRuM baseline energy model estimates energy consumption and CO 2  emissions  of individual dwellings as the basic component for calculation, and then aggregates these to an urban scale.
Oxford case study: DECoRuM baseline energy & CO 2  model © Rajat Gupta, Oxford Brookes University, Oxford, UK.
In conclusion Top down approaches Are they complementary to each other? What do we need to adopt for cities to be able to estimate baseline emissions, predict potential emission reductions, and take action? Bottom-up models
 
Highest energy users on the planet
10 20 30 40 50 2000 2010 2020 2030 2040 2050 1990 Carbon dioxide emissions (MtCO 2 ) Draft London Plan targets 15% 20% 25% 30% 60% Today (+0.7 ° C already) Stern indicates the London Plan targets will not be sufficient 60% 90% New evidence? 2025
London: Where emissions come from: 21% 7% Emissions from London Domestic Commercial (inc. public sector) Industrial Ground-based Transport
Responsibility for Delivering 30% CO2 Cuts by 2025 Source: LECI; GLA analysis GLA family (~10%) City  Boroughs (~10%) National government (~30%) Private sector (~40%) Target reduction (30% vs. 1990) Million tonnes of CO 2  per annum Business as usual scenario Individuals (~10%)
Solar Cities: 2 nd  International Conference 2006
LOW CARBON WOLVERCOTE
Principles of carbon counting for buildings in use   THE KEY STEPS The five key steps in counting the impact on the outside world are: 1  Define the boundary of the premises.   Boundaries should be where they make practical sense in terms of where the energy can be counted (e.g. the area fed by the meters) and how the area is run (a tenancy, a building, a site; or even a district or a city). One may look at more than one boundary, e.g. for a university the campus, specific buildings, and individual departments; and for a rented building the whole building, and each tenancy. Measure the flows of each energy supply across the defined boundary.   Normally this will be annual totals by fuel, though details of load profiles could sometimes be included. Define carbon dioxide factors for each energy supply,   as discussed below Multiply each energy flow by the appropriate carbon dioxide factor,   to get the emissions associated with each fuel 5 Add them up.   to get the annual total of CO2 emissions .
Carbon Dioxide Emissions will include:   (Source:Robert Cohen) Probably the most ‘correct’ approach is to split the scores into four categories: - Direct and measurable -  Indirect, pro-rated on the bases of purchases -  Indirect, not pro-rated and attributed to the industrial sectors - Fixed infrastructure, not pro-rated and attributable to government policy . Peter Harper, Centre for Alternative technology DIRECT EMISSIONS 34% HOUSE ENERGY 19.5% TRANSPORT ENERGY 14.5% INDIRECT PRO RATA EMISSONS 51% INDIRECT INFRASTRUCTURAL EMISSONS 15%
Making Business Sense of Climate Change www.thecarbontrust.co.uk
DECARBONISING BUILDINGS CASE STUDY: The Sports Hall The proposed sports halls is: - 36 x 40mx 7m high,  - floor area of around 1440m2 . - The currently preferred design includes: - 15 Sprung Sports Floor  - Lighting should be Multi-Corso set between the badminton courts - Heating system is a Continuous Black Tube radiant heating system. - 160m2 sports storage equipment - Full height glazed screen between corridor and sports hall - Range of fixed equipment including basket ball goals, netball &  badminton posts - Side walls to be green or blue to meet badminton requirements Top 3m of the 3 external walls are designed to include Kalwall Transluscent cladding, an insulating, diffuse, light transmitting system that eliminates glare hot spots and shadows.
 
Recommendations: High the thermal efficiency of the structure of the sports hall through the use of good levels of insulation in north, south and east walls, elimination of air-infiltration through the building envelope and robust construction. Optimised use of natural lighting in the sports hall so reducing the need for high levels of artificial lighting .  Naturally ventilated sports hall, eliminating the need for mechanical cooling and provision of fresh air.  Replacement of the proposed high level, high temperature, gas fired, air blown heating system with an under-floor, low temperature heating system powered at least in part by a ground source heat pump system and a wind turbine situated in the school grounds.  Install a roof mounted solar hot water system to provide part of the high temperature water supply needed for the changing room facilities.
The what works palette of RENs Source: njsolar
Wind –  It works and is available on site House height 8m 400W turbine Electricity provision: 20% of a household Height: 2m Cost: £1500-2000 6kW turbine Electricity provision: 3.5 houses or 20% of a primary school Height: 9m Cost: £15-18k 220kW turbine Electricity provision: 85 houses or 5 primary schools Height: 36m Cost: £550-700k 1.5MW turbine Electricity provision: 1200 houses or 75 primary schools Height: 65m Cost: £1-1.5 million
RENEWABLE ENERGY GRANTS: The Low Carbon Buildings Programme - Stream 2B. ( www.lowcarbonbuildings.org.uk/  ).   Solar photovoltaics 50% Biomass 35% Ground source heat pumps 35% Wind turbines 30% Solar thermal 30%
CALCULATING THE COST BENEFITS OF THE SAVINGS: Recommendation 3:  Naturally ventilate the sports hall and eliminate the need for mechanical cooling and provision of fresh air. Removal of central ventilation plant and fans.  Electricity cost savings 34 kWh/m2/a saved by removal of mechanical ventilation system.  = 1440 x 34 = 48960 kWh/a CO2 savings 21.053 tonnes annum cost savings 1440 x 34 x 5.5 = £2693 annum Cost of measure  removes c. -£15,000 from plant cost and adds the same for  the opening Kalwal windows at the upper level.  Payback 0 years Recommendation 4:  Under floor heating with GSHP power in part with a wind turbine Replace all air blown sports hall heating system with under-floor heating from a ground source heat pump with wind turbine giving zero energy heating for the hall.  Heating gas saved 307 kWh/m2/a = 1440 x 307 = 442080 kWh/a CO2 savings 83.995 tonnes annum cost savings 442080 x 2.7  = £11,936 annum Cost of measure £100,000 Payback 8.38years
 
Key recomendations:   142,000 644,180 134 20,578 TOTAL  35.53 35,000 36,500 6.9 985 Solar hot water systems 3.58 100,000 442,080 84 11,936 Under floor heating with GSHP and wind turbine - 0 48,960 21 2,693 Natural ventilation of the sports hall  0.56 2,000 64,800 12.3 3,564 Optimisation of the natural day lighting of the hall  3.57 5,000 51,840 9.9 1,400 high thermal efficiency of sports hall   £ kWh tonnes £ (years) Energy Savings CO2 Savings Financial Savings Payback period Estimated Cost of Measure Estimated Annual Savings Recommendations and Key Actions
Sue Roaf  Professor of Architectural Engineering Heriot Watt University Edinburgh [email_address]

Carbon counting roaf

  • 1.
    Towards a Standardfor Carbon Accounting: a view from CIBSE Hywel Davies CIBSE Technical Director and Stuart Macpherson Irons Foulner Consulting Engineers
  • 2.
    Current Standards ActivityBSI, CEN and ISO are working on standards related to carbon emissions from buildings and their component materials and systems BS PAS 2050 – measurement of embodied greenhouse gases in products and services CEN - Sustainability of construction works CEN – Strategic energy management forum ISO – sustainable construction standards
  • 3.
    Carbon counting standards4 strands of standardisation (at least) ISO well advanced on a general framework for environmental impact measures CEN developing standards in response to a mandate – possible standstill on national efforts BSI developing the PAS on carbon
  • 4.
    PAS 2050 Beingdeveloped jointly by Carbon Trust, Defra and BSI Aims to “develop an agreed method for measuring embodied GHG emissions which can be applied across a wide range of product and service categories …to enable companies to measure the GHG related impacts of their products and reduce them.” Carbon and GHG specific
  • 5.
    Directives The EPBDScottish Building Standards Energy Assessors in Scotland
  • 6.
    Carbon Accounting? Itsnot just about counting carbon, but controlling it Thank you for listening – Any questions?
  • 7.
    What are wereally trying to standardise? Carbon impacts or Environmental impacts? Products? Systems? Whole buildings? Cradle to gate, or cradle to grave? Life cycle? When does life begin and end? Impact of a building? Of what goes on in it? Of how people get to it (to work on it or in it)
  • 8.
    Comparing corporate performanceon climate change – what metrics? Dr. Craig Mackenzie Director, Carbon Benchmarking Project University of Edinburgh Business School
  • 9.
    The scope forlow cost reductions Source: Vattenfal
  • 10.
    Breakdown of theTesco footprint Add note on fridge energy? Refrigeration Tesco CSR Report 2007
  • 11.
  • 12.
    Relative carbon intensity?NB: this slide does not give an accurate comparison of performance No Data
  • 13.
    Meaningful comparison? NB:this slide does not give an accurate comparison of performance Food processing business Food non-food split Food- non-food split Food non-food split Use of biodiesel Green tariff electricity Green tariff electricity Data estimated Data incomplete No Data
  • 14.
    An alternative strategyAdd note on fridge energy? Refrigeration Tesco CSR Report 2007 % f-gas leakage pa KWh/linear meter of refrigeration Diesel litres/pallet delivered Average store energy rating % electricity from renewables weighted for additionality
  • 15.
    Wider implications Benchmarking needs: Better data quality Sharper standards Segmental carbon reporting Identification and reporting on normalisation factors Avoiding carbon reductionism Activity-specific metrics Activity/sector-specific reporting standards Collaborative sector/activity projects to define the above
  • 16.
    Westminster carbon countingconference, ICE, 24 January 2008 JOINING THINGS UP FOR BUILDINGS Bill Bordass the Usable Buildings Trust www.usablebuildings.co.uk
  • 17.
    We need tosave real carbon, not virtual carbon
  • 18.
    The Credibility Gapfor a green building award winner
  • 19.
    Saving energy andCO 2 in a hurry, using the multiplier effect Reduced demands standards, passive measures x 0.5? 50 % Increased efficiency better technology, lower resistances x 0.5? 25 % Waste avoidance better control, management, behaviour? Less 20%? (it could easily be more) 20 % Low-carbon energy supplies on and off-site Halve the carbon content of the supplies? 10% To get rapid and cost-effective change, we must press ALL the buttons NOT, for example relying on a business-as-usual fix with renewables: they won’t work alone!
  • 20.
    Use renewable supplies AND make buildings efficient in use
  • 21.
    Making Performance Visible with building energy certificates Ambitions of Europrosper research project 2000-04: Display energy certs based on actual energy use. Achieved Transparency between expectations and outcomes. Incomplete Multiple performance indicators Incomplete We now need voluntary supporting measures
  • 22.
    Passing on carbon+ energy BPF Landlord’s statement Improves transparency Includes multiple performance indicators Allows individual tenants to add the energy they purchase directly and prepare Display Energy Certificates on same basis as whole buildings. Avoids double handling if it allows the transfer of carbon from landlord to tenant for the purpose of the Carbon Reduction Commitment. Interest being shown by other sectors (business centres, retail, industrial
  • 23.
    Passing on carbon+ energy BPF Landlord’s statement
  • 24.
    Drilling down furtherto assign realistic priorities
  • 25.
    Drilling down evenfurther: actual versus predicted for lighting
  • 26.
    Carbon Counting forNeighbourhoods and Cities Dr Rajat Gupta Department of Architecture [email_address] Westminster Carbon Counting Conference 24 January 2008, London
  • 27.
    Core methodologies usedin DECoRuM Underlying physically-based energy models: BREDEM –12 linked to SAP 2001. Cost-benefit analysis approach
  • 28.
  • 29.
    Framework for baselinepredictions DECoRuM baseline energy model estimates energy consumption and CO 2 emissions of individual dwellings as the basic component for calculation, and then aggregates these to an urban scale.
  • 30.
    Oxford case study:DECoRuM baseline energy & CO 2 model © Rajat Gupta, Oxford Brookes University, Oxford, UK.
  • 31.
    In conclusion Topdown approaches Are they complementary to each other? What do we need to adopt for cities to be able to estimate baseline emissions, predict potential emission reductions, and take action? Bottom-up models
  • 32.
  • 33.
    Highest energy userson the planet
  • 34.
    10 20 3040 50 2000 2010 2020 2030 2040 2050 1990 Carbon dioxide emissions (MtCO 2 ) Draft London Plan targets 15% 20% 25% 30% 60% Today (+0.7 ° C already) Stern indicates the London Plan targets will not be sufficient 60% 90% New evidence? 2025
  • 35.
    London: Where emissionscome from: 21% 7% Emissions from London Domestic Commercial (inc. public sector) Industrial Ground-based Transport
  • 36.
    Responsibility for Delivering30% CO2 Cuts by 2025 Source: LECI; GLA analysis GLA family (~10%) City Boroughs (~10%) National government (~30%) Private sector (~40%) Target reduction (30% vs. 1990) Million tonnes of CO 2 per annum Business as usual scenario Individuals (~10%)
  • 37.
    Solar Cities: 2nd International Conference 2006
  • 38.
  • 39.
    Principles of carboncounting for buildings in use THE KEY STEPS The five key steps in counting the impact on the outside world are: 1 Define the boundary of the premises. Boundaries should be where they make practical sense in terms of where the energy can be counted (e.g. the area fed by the meters) and how the area is run (a tenancy, a building, a site; or even a district or a city). One may look at more than one boundary, e.g. for a university the campus, specific buildings, and individual departments; and for a rented building the whole building, and each tenancy. Measure the flows of each energy supply across the defined boundary. Normally this will be annual totals by fuel, though details of load profiles could sometimes be included. Define carbon dioxide factors for each energy supply, as discussed below Multiply each energy flow by the appropriate carbon dioxide factor, to get the emissions associated with each fuel 5 Add them up. to get the annual total of CO2 emissions .
  • 40.
    Carbon Dioxide Emissionswill include: (Source:Robert Cohen) Probably the most ‘correct’ approach is to split the scores into four categories: - Direct and measurable - Indirect, pro-rated on the bases of purchases - Indirect, not pro-rated and attributed to the industrial sectors - Fixed infrastructure, not pro-rated and attributable to government policy . Peter Harper, Centre for Alternative technology DIRECT EMISSIONS 34% HOUSE ENERGY 19.5% TRANSPORT ENERGY 14.5% INDIRECT PRO RATA EMISSONS 51% INDIRECT INFRASTRUCTURAL EMISSONS 15%
  • 41.
    Making Business Senseof Climate Change www.thecarbontrust.co.uk
  • 42.
    DECARBONISING BUILDINGS CASESTUDY: The Sports Hall The proposed sports halls is: - 36 x 40mx 7m high, - floor area of around 1440m2 . - The currently preferred design includes: - 15 Sprung Sports Floor - Lighting should be Multi-Corso set between the badminton courts - Heating system is a Continuous Black Tube radiant heating system. - 160m2 sports storage equipment - Full height glazed screen between corridor and sports hall - Range of fixed equipment including basket ball goals, netball & badminton posts - Side walls to be green or blue to meet badminton requirements Top 3m of the 3 external walls are designed to include Kalwall Transluscent cladding, an insulating, diffuse, light transmitting system that eliminates glare hot spots and shadows.
  • 43.
  • 44.
    Recommendations: High thethermal efficiency of the structure of the sports hall through the use of good levels of insulation in north, south and east walls, elimination of air-infiltration through the building envelope and robust construction. Optimised use of natural lighting in the sports hall so reducing the need for high levels of artificial lighting . Naturally ventilated sports hall, eliminating the need for mechanical cooling and provision of fresh air. Replacement of the proposed high level, high temperature, gas fired, air blown heating system with an under-floor, low temperature heating system powered at least in part by a ground source heat pump system and a wind turbine situated in the school grounds. Install a roof mounted solar hot water system to provide part of the high temperature water supply needed for the changing room facilities.
  • 45.
    The what workspalette of RENs Source: njsolar
  • 46.
    Wind – It works and is available on site House height 8m 400W turbine Electricity provision: 20% of a household Height: 2m Cost: £1500-2000 6kW turbine Electricity provision: 3.5 houses or 20% of a primary school Height: 9m Cost: £15-18k 220kW turbine Electricity provision: 85 houses or 5 primary schools Height: 36m Cost: £550-700k 1.5MW turbine Electricity provision: 1200 houses or 75 primary schools Height: 65m Cost: £1-1.5 million
  • 47.
    RENEWABLE ENERGY GRANTS:The Low Carbon Buildings Programme - Stream 2B. ( www.lowcarbonbuildings.org.uk/ ). Solar photovoltaics 50% Biomass 35% Ground source heat pumps 35% Wind turbines 30% Solar thermal 30%
  • 48.
    CALCULATING THE COSTBENEFITS OF THE SAVINGS: Recommendation 3: Naturally ventilate the sports hall and eliminate the need for mechanical cooling and provision of fresh air. Removal of central ventilation plant and fans. Electricity cost savings 34 kWh/m2/a saved by removal of mechanical ventilation system. = 1440 x 34 = 48960 kWh/a CO2 savings 21.053 tonnes annum cost savings 1440 x 34 x 5.5 = £2693 annum Cost of measure removes c. -£15,000 from plant cost and adds the same for the opening Kalwal windows at the upper level. Payback 0 years Recommendation 4: Under floor heating with GSHP power in part with a wind turbine Replace all air blown sports hall heating system with under-floor heating from a ground source heat pump with wind turbine giving zero energy heating for the hall. Heating gas saved 307 kWh/m2/a = 1440 x 307 = 442080 kWh/a CO2 savings 83.995 tonnes annum cost savings 442080 x 2.7 = £11,936 annum Cost of measure £100,000 Payback 8.38years
  • 49.
  • 50.
    Key recomendations:  142,000 644,180 134 20,578 TOTAL 35.53 35,000 36,500 6.9 985 Solar hot water systems 3.58 100,000 442,080 84 11,936 Under floor heating with GSHP and wind turbine - 0 48,960 21 2,693 Natural ventilation of the sports hall 0.56 2,000 64,800 12.3 3,564 Optimisation of the natural day lighting of the hall 3.57 5,000 51,840 9.9 1,400 high thermal efficiency of sports hall   £ kWh tonnes £ (years) Energy Savings CO2 Savings Financial Savings Payback period Estimated Cost of Measure Estimated Annual Savings Recommendations and Key Actions
  • 51.
    Sue Roaf Professor of Architectural Engineering Heriot Watt University Edinburgh [email_address]

Editor's Notes

  • #11 Comment on indirect emissions – upstream/downstream
  • #13 Share of total UK emissions - Doesn’t include upstream/downstream
  • #35 Broadly speaking, London Plan targets were based on 550 ppm target – whcih has now been revised to 450 or below They are in line with UK/Royal Commission targets (ie not too much more dramatic) But Tyndall analysis in Stern report indicates Need to take a ‘overall carbon budget’ approach, not linear targets – this is why short term action is key! 450 ppm required – and this only gives us a 50/50 chance of avoiding catastrophic climate change (3 degrees celsius or less)
  • #47 In the UK we have 40% of Europe's total wind energy. But it's still largely untapped and only 0.5% of our electricity requirements are currently generated by wind power.