Download to read offline


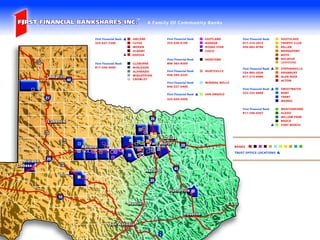


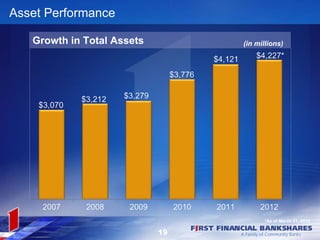
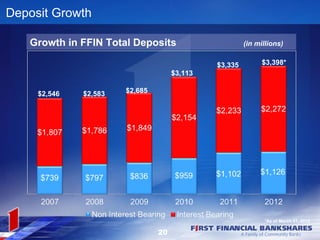


The document provides unaudited financial information for the 1st quarter of 2012 and contains forward-looking statements. It discusses First Financial Bankshares, Inc., a $4.2 billion financial holding company based in Abilene, Texas with 11 separately chartered banks and over 50 locations. The company has received several recognitions and its unique business model centers around its community bank charters which focus on local markets and customers.


