CTEEP reported its financial results for the second quarter of 2015, with the following highlights:
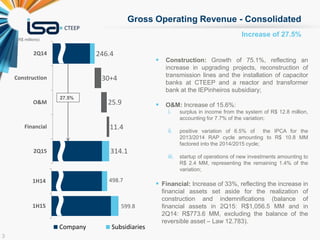
- Net revenue increased 27.8% to R$279 million driven by growth in construction, O&M, and financial revenue.
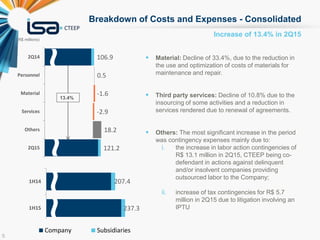
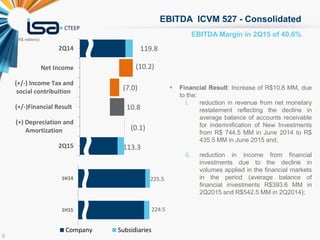
- EBITDA was R$113.3 million, a margin of 40.6%. This was lower than the prior year due to higher contingency expenses.
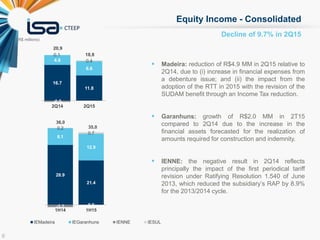
- Net income was R$79.9 million, down 10.2% year-over-year.
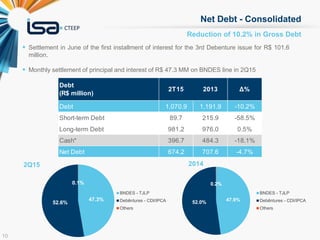
- Gross debt declined 10.2% to R$1,070.8 million while cash increased, lowering net debt 4.7% to R$674.2 million.