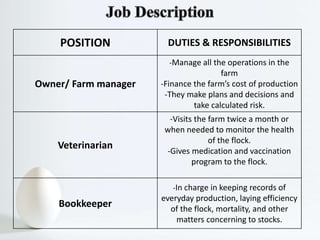
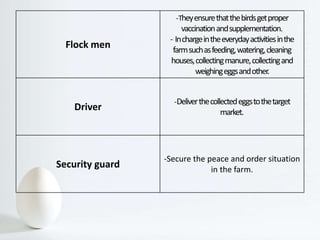
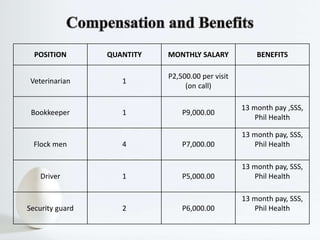
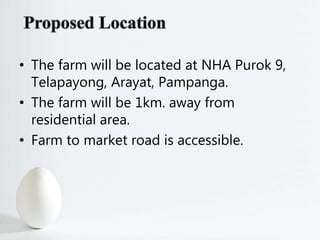
Business Proposal
Submitted by:
Castro, Hazel R.
Aldana, Paulene M.
Dizon, Carmina Jane L.
Submitted To:
Prof. Fernando Pangilinan
BUSINESS PROPOSAL CONTENT
I. Introduction
II. Organization Plan
III. Production / Technical Plan
IV. Marketing Plan
V. Financial Plan
VI. Profitability Test/ Indicators
Chicken broiler and egg production are the most progressive animal
enterprises in the Philippines today. The poultry industry in fact began as the
backyard enterprise but has shifted to the formation of very large integrated
contract farming operations.
• The growth of poultry industry in the Philippines has been impressive but its
problems include inefficient management and the prevalence of many destructive
poultry diseases and parasites cannot be ignored.
• The chicken is the most exploited species of poultry, which is
utilized for food production in the whole world. Scientific researchers have been
done on this species for past centuries and it is still the focus of the present and
future experimentation. In the Philippines chicken rank first, while ducks rank
second in economic importance as source of meat and eggs.
• The egg layer class is characterized by their comparatively small size. They
lay large white shelled eggs, very active and nervous in temperament. They are
non-sitters. The earlier selection of geneticist for this class showed record of early
maturity that may not necessarily be true with the modern breeds under this class.
Examples: Leghorn, Minorcas, Anconas, Mikawa.
Copyright © 2012 Bureau of Agricultural Research
http://www.bar.gov.ph/agfishtech-home/livestock-poultry/216-poultry/1334-chicken-production
• As of January 1, 2015, total chicken population was 176.47 million birds
or 5.25 percent higher than last year's total stocks of 167.67 million
birds. The inventory of broilers and native/improved chicken also went
up by 8.18 percent and 3.31 percent, respectively. Layer chicken
inventory likewise grew by 4.16 percent.
• Total chicken production in 2014 went up by 1.07 percent compared
with last year's volume. On the other hand, chicken egg production for
2014 went down by 2.81 percent from the 2013 level.
• Along with the slight increase in chicken production, the gross value at
current prices for 2014 also went up by 1.07 percent or Php. 143,045.42
millions compared with its value last year.
• The value of chicken egg production at current
prices in 2014 increased by 3.96 percent despite
the decrease in production.
http://agstat.psa.gov.ph/?ids=chickensituation
• To gain proper knowledge on how to raise
an egg farm
• To know all the advantages and risks in
venturing this kind of business
• To prepare ourselves in handling our own
business
 Partnership
A business organization in which two or more
individual manage and operate the business. Both
owners are equally and personally liable for the debts.
Owner/Farm Manager
Flock men
Veterinarian Bookkeeper
Security GuardDriver
POSITION QUALIFICATIONS
Bookkeeper
-must know how to compute, audit and
must be computer literate.
- must be graduated in any accounting-
related course.
Veterinarian
-must be a licensed veterinarian and
has a specialty in layer production.
Flock men
-must have a knowledge in layering
-must be reliable, hardworking, and
willing to be trained.
Driver
-must have a professional driver’s
license
-must have a knowledge about
proceeding into different locations.
Security guard
-must be brave and came from a reliable
agency.
POSITION DUTIES & RESPONSIBILITIES
Owner/ Farm manager
-Manage all the operations in the
farm
-Finance the farm’s cost of production
-They make plans and decisions and
take calculated risk.
Veterinarian
-Visits the farm twice a month or
when needed to monitor the health
of the flock.
-Gives medication and vaccination
program to the flock.
Bookkeeper
-In charge in keeping records of
everyday production, laying efficiency
of the flock, mortality, and other
matters concerning to stocks.
Flock men
-Theyensurethatthebirdsgetproper
vaccinationandsupplementation.
- Inchargeintheeverydayactivitiesinthe
farmsuchasfeeding,watering,cleaning
houses,collectingmanure,collectingand
weighingeggsandother.
Driver
-Deliverthecollectedeggstothetarget
market.
Security guard
-Secure the peace and order situation
in the farm.
POSITION QUANTITY MONTHLY SALARY BENEFITS
Veterinarian 1
P2,500.00 per visit
(on call)
Bookkeeper 1 P9,000.00
13 month pay ,SSS,
Phil Health
Flock men 4 P7,000.00
13 month pay, SSS,
Phil Health
Driver 1 P5,000.00
13 month pay, SSS,
Phil Health
Security guard 2 P6,000.00
13 month pay, SSS,
Phil Health
• The farm will be located at NHA Purok 9,
Telapayong, Arayat, Pampanga.
• The farm will be 1km. away from
residential area.
• Farm to market road is accessible.
Pandacaqui Rd.
Magalang-ArayatRd.Magalang-ConcepcionRd
Magalang-Angeles Rd.
San Vicente Rd.
Buensuceso Rd.
Municipality
of Magalang
Telapayong
Elementary School
Telapayong Covered
Court
Telapayong
Church
• The “CAD Egg Farm” will be derived from
the first letters of the surnames of the
owners.
C- Castro, Hazel R.
A-Aldana, Paulene M.
D-Dizon, Carmina Jane L.
200m
100m 80m
40m 20m
60m
15m
15m
10m
10m
2m
2m
N
W E
S
6m
6m
• The chicks will
be in growing
houses at 1-16
weeks old and
will be vaccine
fowl pox at the
age of 10-12
weeks. After
they reach 16-
17 weeks, they
are transferred
to laying house.
• Chickens will
begin to lay
eggs at 20-22
weeks.
Generally,
layers reach
maximum egg
production
when they are
between 30-36
weeks old,
after which egg
production
tends to
decline and the
chickens will be
culled.
• Eggs will be
collected daily
and will be
grade based on
their weight.
The graded egg
will be
delivered to
the target
market.
• The breed that will be Raised by the Farm is Lohmann
Brown chickens, because of its low mortality rate and
high laying Efficiency.
• The stocks will be bought from Rubina Farm in Bulacan
and sometimes from Heritage farm.
Description April May June July Aug. Sept. Oct. Nov. Dec. Jan. Feb Mar
Preparation of the
business plan
Preparation of the
land
Construction of the
farm
Applying for the
business permit
Buying of chicks
Feeding the chicks
with starter mash
Feeding the chicks
with developer mash
Feeding the chicks
with laying mash
Collection of eggs
Collection of manure
Equipment Quantity Price per Unit Total cost
Egg grading
machine
1 P35,000 P35,000
Generator 1 200,000 200,000
Pail 6 50 300
Truck 1 350,000 350,000
Jetmatic 2 8,000 16,000
Shovel 3 650 1,950
Water host 130ft 25/ft 3,250
Broom stick 3 16 48
Feeder container 500 20 10,000
Tray 500 4 2000
Dust pan 3 20 60
Push Cart 3 1500 4500
Pantabas 2 450 900
Power Sprayer 2 5500 11,000
Total P653,008
Product
Price
Place
Promotion
SIZES PRICE /PIECE
Small P4
Medium P4.33
Large P4.83
Extra Large P5.33
Cracked P3
Place
The CAD Egg farm will be located at
NHAPurok 9Telapayong,Arayat,
Pampanga with an area of 2 hectares.
30%
25%
20%
15%
10%
Magalang Public Market
Angeles Public Market
Arayat Public Market
Mabalacat Public Market
Pick up buyers
 Word of mouth
 T-shirt
CAD Egg
Farm
The capital requirement is P 7,000,000
which will be loan from the BDO with 12%
interest per annum.
Two of the owners will be providing
P3,000,000 and one of the owners will
contribute P1,000,000 and the 2 hectare land
that they will use.
Loan Payment Interest Total Payment
of Loan
1st year P7,000,000 P1,400,000 P7,000,000 x 12% P840,000 P2,240,000
2nd year P5,600,000 P1,400,000 P5,600,000 x 12% P672, 000 P2,072,000
3rd year P4, 200,000 P1,400,000 P4, 200,000 x 12% P504,000 P1,904,000
4th year P2,800,000 P1,400,000 P2,800,000 x 12% P336,000 P1,736,000
5th year P1,400,000 P1,400,000 P1,400,000 x 12% P168,000 P1,568,000
Description Quantity Price/unit Total
Laying House 2 600,000 1,200,000
Brooder House 2 350,000 700,000
Laborers House 1 250,000 250,000
Storage house
For Eggs
1 200,000 200,000
Office 1 100,000 100,000
Guard House 1 50,000 50,000
Tools and
Equipment house
1 150,000 150,000
Total P2,650,000
Feeds
Age of
Chick
No. of Sack Price Total
Starter
Mash
1-6 weeks 130 P1,000 P130,000
Developer
Mash
6-20 weeks 295 P1,000 P295,000
Laying
Mash
20-80
weeks
1260 P1,050 P1,323,000
Total P1,748,000
Names Salary
Quantit
y
Monthly Contribution
Total
contributi
on in SSS
Employer
Yearly
contributi
on
Employer Employee
Bookkeeper P9,000.00 1 P 636.00 P 300.00 P 936.00 P 7,632
Flockmen P7,ooo.oo 4 1,978.8 933.2 2,912 23, 754
Driver P5,000.00 1 353.30 166.70 520 4239.6
Security
guard
P6,000.00 2 848 400.00 1,248
10, 176
Total P 3, 815 P 1,799.9 P 5,616 P45,801.6
Names Salary Quantity
Monthly Contribution Total
contribution
in Phil
Health
Employer
Yearly
contributionEmployer Employee
Bookkeeper P9,000.00 1 P 112.50 P 112.50 P 225 P 1,350
Flockmen P7,000.00 4 350 350 700 4,200
Driver P5,000.00 1 62.50 62.50 125 750
Security guard P6,000.00 2 150 150 300 1,800
Total P 675 P 8,100
Description Quantity Monthly Yearly
Electricity (power
and water supply)
1 month
P18,000 P216,000
Salary of the
employees
9 P56,500 P678,000
Permits
-BIR
-DTI
-Mayor’s Permit
1
1
1
P3,000
P500
P2,000
Gasoline P4,500 P54,000
Bonuses P56,000
SSS P3, 815 P45,801.6
Phil Health P 675 P 8,100
Advertising expense 100 P20,000
Total P1,083,401.6
Description Quantity Price/unit Total Cost
Lohmann Bird 10,000 P37.00 P370,000
Medication and
Vaccination
10,000 P 70, 000/year P70,000
Total
P440,000
Cost of Production Total
Farm construction P2,650,000
Layer Expense P440,000
Tools and Equipments P653,008
Feeds P1,748,000
Overhead Expenses P1,083,401.6
TOTAL COST OF PRODUCTION P6,574,409.6
MONTHS NO.OF DAYS
NO.OF
LAYERS
EGGS/DAY
Laying
Efficiency
EGGS/Mont
h
September 30 10,000 0
October 31 9,990 0
November 30 9,960 0
December 31 9,950 0
January 31 9,945 6700 67% 207,700
February 28 9,860 6800 69% 190,400
March 31 9,802 6900 70% 213,900
April 30 9,716 7100 73% 213,000
May 31 9,693 7200 74% 223,200
June 30 9,608 7900 82% 237,000
July 31 9,564 6700 70% 207,700
August 31 9,500 6800 72% 210,800
Total 1,703,700
Size Price
% of
production
Quantity Total
Small P4 15% 255,555 P1,022,220
Medium P4.33 25% 425,925 P1,844,255
Large P4.83 30% 511,110 P2,468,661
Extra large P5.33 25% 425,925 P2,270,180
Cracked/Reject P3 5% 85,185 P255,555
Manure P10 800 sacks P8,000
Total Gross
Income
P7,868,871.80
MONTHS NO.OF DAYS
NO.OF
LAYERS
EGGS/DAY
Laying
Efficiency
EGGS/Mont
h
September 30 9,490 6,700 71% 201,000
October 31 9,485 6,695 71% 207,545
November 30 9,480 6,690 71% 200,700
December 31 9,480 6,685 71% 207,235
January 31 9, 479 6,680 70% 207,080
February 28 9, 477 5,675 60% 158,900
March 31 9, 470 5,670 60% 175,770
April 30 9, 469 5,665 60% 169,950
May Cleaning and Maintenance of the layer houses
June 30 9, 995 6,800 68% 204,000
July 31 9, 990 6,850 69% 212,350
August 31 9, 985 6,900 69% 213,900
Total P2,158,430
Chickens will be Culled in approximately 1
year and 8 months
Price of the eggs will increase 2% per annum
Size Price
% of
production
Quantity Total
Small P4.08 10% 215,843
P880,639
Medium P4.42 30% 647,529
P2,862,078
Large P4.93 25% 539,608
P2,660,265
Extra large P5.44 25% 539,608
P2,935,465
Cracked/Reject P3.06 10% 215,843
P660,480
Manure P10 800 sacks P8,000
Total Gross
Income P10,006,927
MONTHS NO.OF DAYS
NO.OF
LAYERS
EGGS/DAY
Laying
Efficiency
EGGS/Month
September 30 9,980 6,560 66% 196,800
October 31 9,977 7,695 77% 238,545
November 30 9,970 7,290 73% 218,700
December 31 9,965 7,185 72% 222,735
January 31 9,962 7,990 80% 247,690
February 28 9,959 7,875 79% 220,500
March 31 9,955 6,670 67% 206,770
April 30 9,953 6,675 67% 200,250
May 31 9,950 6,670 67% 206,770
June 30 9,948 6,600 66% 198,000
July 31 9,943 6,550 66% 203,050
August 31 9,941 6,400 64% 198,400
Total 2,558,210
Size Price
% of
production
Quantity Total
Small P4.16 9% 230,239
P957,794
Medium P4.50 32% 818,627
P3,683,822
Large P5.03 26% 665,135
P3,345,627
Extra large P5.55 25% 639,553
P3,549,516
Cracked/Reject P3.12 8% 204,657
P638,529
Manure P10.00 800 sacks P8,000
Total Gross
Income P12,183,289
MONTHS NO.OF DAYS NO.OF LAYERS EGGS/DAY
Laying
Efficiency
EGGS/Month
September 30 9,850 6,580 67% 197,400
October 31 9,760 6, 330 65% 196,230
November 30 9,690 6,260 65% 187,800
December 31 9,570 6,140 64% 190,340
January 31 9,430 6,820 72% 211,420
February Cleaning and Maintenance of the layer houses
March 31 9,955 7,850 79% 243,350
April 30 9,953 7,840 79% 235,200
May 31 9,950 7,760 78% 240,560
June 30 9,948 7,650 77% 229,500
July 31 9,943 7,640 77% 236,840
August 31 9,941 7,590 76% 235,290
Total 2,403,930
Size Price
% of
production
Quantity Total
Small P4.24 8% 192,314 P815,413
Medium P4.60 35% 841,376 P3,870,327
Large P5.13 27% 649,061 P3,329,683
Extra large P5.66 23% 552,904 P3,129,436
Cracked/Reject P3.18 7% 168,275 P535,115
Manure P10.00 800 sacks P8,000
Total Gross
Income
P11,687,975
MONTHS NO.OF DAYS NO.OF LAYERS EGGS/DAY
% of
Production
EGGS/Month
September 30 9,939 7,560 76% 226,800
October 31 9,935 7,660 77% 237,460
November 30 9,927 8,790 89% 263,700
December 31 9,919 8,790 89% 272,490
January 31 9,908 7,780 79% 241,180
February 28 9,897 7,770 79% 217,560
March 31 9, 889 6,750 68% 209,250
April 30 9,870 6,780 69% 203,400
May 31 9,864 6,760 69% 209,560
June 30 9, 857 6,740 68% 202,200
July 31 9, 848 6,720 68% 208,320
August 31 9, 832 6,630 67% 205,530
Total 2,697,450
Size Price
% of
production
Quantity Total
Small P4.33 8% 215,796 934,397
Medium P4.69 35% 944,108 4,427,864
Large P5.23 27% 728,312 3,809,069
Extra large P5.77 23% 620,414 3,579,786
Cracked/Reject P3.25 7% 188,822 613,670
Manure P10.00 800 sacks P8,000
Total Gross
Income
P13,372,786
Description Quantity Price/unit Total
Farm Land 2 hectares P1,000,000 P2,000,000
Laying House 2 600,000 1,200,000
Brooder House 2 350,000 700,000
Laborers House 1 250,000 250,000
Storage house
For Eggs
1 200,000 200,000
Office 1 150,000 150,000
Tools and
Equipment house
1 150,000 150,000
Total P2,650,000
Equipments
Cost Analysis 1st
year
Cost Analysis 2nd
year
Cost Analysis 3rd
year
Cost Analysis 4th
year
Cost Analysis 5th
year
Egg grading
machine
P35,000
Generator 200,000
Pail 300 309 318.27 327.8181 337.6526
Truck 350,000
Jetmatic 16,000
Shovel 1,950
Water host 3,250
Broom stick 48 49 50.47 51.9841 53.54362
Feeder
container
10,000 10,300 10609 10927.27 11255.09
Tray 2000 2,060 2121.8 2185.454 2251.018
Dust pan 60 62 63.86 65.7758 67.74907
Push Cart 4500 4,635 4774.05 4917.272 5064.79
Pantabas 900 927 954.81 983.4543 1012.958
Power sprayer 11,000 11,330 11669.9 12020 12380.6
Total P653,008 P29,672 P30,562.16 P31,479.02 P32,423.4
Description Cost Analysis
1st year
Cost Analysis
2nd Year
Cost Analysis
3rd Year
Cost Analysis
4th Year
Cost Analysis
5th Year
Lohmann Bird P370, 000 P381,100 - P392,533 P404,309
Medication
and
Vaccination
P70,000 P 72,100 P74,263 P76,490 P78,785
Starter Mash P130,000 P133,900 P137,917 P142,055 P146,317
Developer
Mash
P295,000 P303,850 P312,966 P322,355 P332,026
Laying Mash P1,323,000 P1,362,690 P1,403,571 P1,445,678 P1,489,048
Total P2,188,000 P2,253,640 P1,928,716 P2,379,111 P2,450,485
Description
Cost Analysis
1st Year
Cost Analysis
2nd Year
Cost Analysis
3rd Year
Cost Analysis
4th Year
Cost Analysis
5th Year
Electricity
(power and
water supply)
P216,000
222,480 229,154 236,029 243,110
Salary of the
employees
P678,000 698,340 719,290 740,869 763,095
Permits
-BIR
-DTI
-Mayor’s
Permit
P3,000
P500
P2,000
3,090
515
2,060
3,183
530
2,122
3,278
546
2,186
3,376
562
2,252
Gasoline P54,000 55,620 57,289 59,008 60,778
Bonuses P56,000 57,680 59,410 61,192 63,028
SSS P45,801.6 47,175.6 48,590.9 50,048.6 51,550.05
Phil Health P 8,100 8,343 8,593.3 8,851.1 9,116.6
Advertising P20,000 20,600 21,218 21,854.54 22,510.18
Total P 1,083,401.6 P 1,115,903.6 P1,149,380 P1,183,862 P1,219,378
Cost of Production Total
Farm construction P2,650,000
Layer Expenses P2,118,000
Equipments P653,008
Overhead Expenses P 1,083,401.6
TOTAL COST OF PRODUCTION P6,574,409.6
Return Total
Total Gross Income P7,868,871.80
Total Cost of Production P6, 574,409.6
Loan Payable P2,240,000
TOTAL NET INCOME P-945,537.80
Cost of Production Total
Layer Expenses P2,181,540
Equipments P29,672
Overhead Expense P 1,115,903.6
TOTAL COST OF PRODUCTION P3, 327,115.6
Return Total
Total Gross Income P10,006,927
Total Cost of Production P3, 327,115.6
Loan Payable P2,072,000
TOTAL NET INCOME P4,607,811
Cost of Production Total
Layer Expenses P2,246,986
Equipments P30,562.16
Overhead Expense P1,149,380
TOTAL COST OF PRODUCTION P3, 426,928.16
Return Total
Total Gross Income P12,183,289
Total Cost of Production P3, 426,928.16
Loan Payable P1,904,000
TOTAL NET INCOME P6,852,361
Cost of Production Total
Layer Expenses P2,314,397
Equipments P31,479.02
Overhead Expense P1,183,862
TOTAL COST OF PRODUCTION P3, 529,738.02
Return Total
Total Gross Income P11,687,975
Total Cost of Production P3, 529,738.02
Loan Payable P1,736,000
TOTAL NET INCOME P6,422,236.98
Cost of Production Total
Layer Expenses 2,383,829
Equipments P32,423.4
Overhead Expense 1,219,378
TOTAL COST OF PRODUCTION P 3,635,630.4
Return Total
Total Gross Income P13,372,786
Total Cost of Production P 3, 635,630.4
Loan Payable P1,568,000
TOTAL NET INCOME P8,169,155.6
1st
Year 2nd
Year 3rd
Year 4th
Year 5th
Year
Total
Gross
Income
P7,868,871.80 P10,006,927 P12,183,289 P11,687,975 P13,372,786
Total
Cost of
Producti
on
P6,574,409.6 P3, 327,115.6 P3, 426,928.16 P3,529,738.02 P3,635,630.4
Loans
Payable P2,240,000 P2,072,000 P1,904,000 P1,736,000 P1,568,000
Total Net
Income P-945,537.80 P4,607,811 P6,852,361 P6,422,236.98 P8,169,155.6
VI. Profitability Indicators
ROI = Total Net Income x 100
Total Cost Production
1st year 4th year
P-945,537.80 x 100% P6,422,236.98 x100%
P6,574,409.6 P3,529,738.02
=-14.38% =181.95%
2nd year 5th year
P4,607,811 x100% P8,169,155.6 x100%
P3,327,115.6 P3,635,630.4
=138.49% =224.70%
3rd year
P6,852,361 x 100%
P3,426,928.16
=199.96%
PPU = Total Selling Price
No. of Products
1st year 4th year
4+4.33+4.83+5.33+3 4.24+4.60+5.13+5.66+3.18
5 5
= 4.29/egg =4.56/egg
2nd year 5th year
4.08+4.42+4.93+5.44+3.06 4.33+4.69+5.23+5.77+3.25
5 5
=4.39/egg = 4.65/egg
3rd year
4.16+4.50+5.03+5.55+3.12
5
=4.47/egg
BEP= Total Cost of Production
Price per Unit
1st year 4th year
P6,574,409.6 P3,529,738.02
4.29 4.56
=1,532,496 eggs =774,065 eggs
2nd 5th year
P3, 327,115.6 P3,635,630.4
4.39 4.65
=757,885 eggs =781,856 eggs
3rd year
P3,426,928.16
4.47
=766,662 eggs
CPU= Total Cost of Production
Volume of Production
1st year 4th year
P6,574,409.6 P3,529,738.02
2,159,700 3,199,930
=3.04 cost to produced egg =1.10
2nd year 5th year
P3, 327,115.6 P3,635,630.4
2,915,430 3,550,450
=1.14 =1.02
3rd year
P3,426,928.16
3,259,210
=1.05
1ST YEAR 2ND YEAR 3RD YEAR 4TH YEAR 5TH YEAR
TGI P7,868,871.80 P10,006,927 P12,183,289 P11,687,975 P13,372,786
TCP P6,574,409.6 P3, 327,115.6 P3, 426,928.16 P3,529,738.02 P3,635,630.4
TNI P-945,537.80 P4,607,811 P6,852,361 P6,422,236.98 P8,169,155.6
ROI 17.62% 243.66% 297.25% 291.23% 342.70%
CPU 3.04 1.14 1.05 1.1 1.02
PPU 4.29/eggs 4.39/eggs 4.47/eggs 4.56/eggs 4.65/eggs
BEP
1,532,496 eggs
eggs
757,885 eggs 766,662 eggs 774,065 eggs 781,856 eggs
VOP 2,159,700 2,915,430 3,259,210 3,199,930 3,550,450
Thank You!!!

Cad Egg Farm Business Proposal

  • 1.
    Business Proposal Submitted by: Castro,Hazel R. Aldana, Paulene M. Dizon, Carmina Jane L. Submitted To: Prof. Fernando Pangilinan
  • 4.
    BUSINESS PROPOSAL CONTENT I.Introduction II. Organization Plan III. Production / Technical Plan IV. Marketing Plan V. Financial Plan VI. Profitability Test/ Indicators
  • 6.
    Chicken broiler andegg production are the most progressive animal enterprises in the Philippines today. The poultry industry in fact began as the backyard enterprise but has shifted to the formation of very large integrated contract farming operations. • The growth of poultry industry in the Philippines has been impressive but its problems include inefficient management and the prevalence of many destructive poultry diseases and parasites cannot be ignored. • The chicken is the most exploited species of poultry, which is utilized for food production in the whole world. Scientific researchers have been done on this species for past centuries and it is still the focus of the present and future experimentation. In the Philippines chicken rank first, while ducks rank second in economic importance as source of meat and eggs. • The egg layer class is characterized by their comparatively small size. They lay large white shelled eggs, very active and nervous in temperament. They are non-sitters. The earlier selection of geneticist for this class showed record of early maturity that may not necessarily be true with the modern breeds under this class. Examples: Leghorn, Minorcas, Anconas, Mikawa. Copyright © 2012 Bureau of Agricultural Research http://www.bar.gov.ph/agfishtech-home/livestock-poultry/216-poultry/1334-chicken-production
  • 7.
    • As ofJanuary 1, 2015, total chicken population was 176.47 million birds or 5.25 percent higher than last year's total stocks of 167.67 million birds. The inventory of broilers and native/improved chicken also went up by 8.18 percent and 3.31 percent, respectively. Layer chicken inventory likewise grew by 4.16 percent. • Total chicken production in 2014 went up by 1.07 percent compared with last year's volume. On the other hand, chicken egg production for 2014 went down by 2.81 percent from the 2013 level. • Along with the slight increase in chicken production, the gross value at current prices for 2014 also went up by 1.07 percent or Php. 143,045.42 millions compared with its value last year.
  • 8.
    • The valueof chicken egg production at current prices in 2014 increased by 3.96 percent despite the decrease in production. http://agstat.psa.gov.ph/?ids=chickensituation
  • 9.
    • To gainproper knowledge on how to raise an egg farm • To know all the advantages and risks in venturing this kind of business • To prepare ourselves in handling our own business
  • 11.
     Partnership A businessorganization in which two or more individual manage and operate the business. Both owners are equally and personally liable for the debts.
  • 12.
    Owner/Farm Manager Flock men VeterinarianBookkeeper Security GuardDriver
  • 13.
    POSITION QUALIFICATIONS Bookkeeper -must knowhow to compute, audit and must be computer literate. - must be graduated in any accounting- related course. Veterinarian -must be a licensed veterinarian and has a specialty in layer production. Flock men -must have a knowledge in layering -must be reliable, hardworking, and willing to be trained. Driver -must have a professional driver’s license -must have a knowledge about proceeding into different locations. Security guard -must be brave and came from a reliable agency.
  • 14.
    POSITION DUTIES &RESPONSIBILITIES Owner/ Farm manager -Manage all the operations in the farm -Finance the farm’s cost of production -They make plans and decisions and take calculated risk. Veterinarian -Visits the farm twice a month or when needed to monitor the health of the flock. -Gives medication and vaccination program to the flock. Bookkeeper -In charge in keeping records of everyday production, laying efficiency of the flock, mortality, and other matters concerning to stocks.
  • 15.
  • 16.
    POSITION QUANTITY MONTHLYSALARY BENEFITS Veterinarian 1 P2,500.00 per visit (on call) Bookkeeper 1 P9,000.00 13 month pay ,SSS, Phil Health Flock men 4 P7,000.00 13 month pay, SSS, Phil Health Driver 1 P5,000.00 13 month pay, SSS, Phil Health Security guard 2 P6,000.00 13 month pay, SSS, Phil Health
  • 18.
    • The farmwill be located at NHA Purok 9, Telapayong, Arayat, Pampanga. • The farm will be 1km. away from residential area. • Farm to market road is accessible.
  • 19.
    Pandacaqui Rd. Magalang-ArayatRd.Magalang-ConcepcionRd Magalang-Angeles Rd. SanVicente Rd. Buensuceso Rd. Municipality of Magalang Telapayong Elementary School Telapayong Covered Court Telapayong Church
  • 20.
    • The “CADEgg Farm” will be derived from the first letters of the surnames of the owners. C- Castro, Hazel R. A-Aldana, Paulene M. D-Dizon, Carmina Jane L.
  • 21.
  • 22.
    • The chickswill be in growing houses at 1-16 weeks old and will be vaccine fowl pox at the age of 10-12 weeks. After they reach 16- 17 weeks, they are transferred to laying house. • Chickens will begin to lay eggs at 20-22 weeks. Generally, layers reach maximum egg production when they are between 30-36 weeks old, after which egg production tends to decline and the chickens will be culled. • Eggs will be collected daily and will be grade based on their weight. The graded egg will be delivered to the target market.
  • 23.
    • The breedthat will be Raised by the Farm is Lohmann Brown chickens, because of its low mortality rate and high laying Efficiency. • The stocks will be bought from Rubina Farm in Bulacan and sometimes from Heritage farm.
  • 24.
    Description April MayJune July Aug. Sept. Oct. Nov. Dec. Jan. Feb Mar Preparation of the business plan Preparation of the land Construction of the farm Applying for the business permit Buying of chicks Feeding the chicks with starter mash Feeding the chicks with developer mash Feeding the chicks with laying mash Collection of eggs Collection of manure
  • 25.
    Equipment Quantity Priceper Unit Total cost Egg grading machine 1 P35,000 P35,000 Generator 1 200,000 200,000 Pail 6 50 300 Truck 1 350,000 350,000 Jetmatic 2 8,000 16,000 Shovel 3 650 1,950 Water host 130ft 25/ft 3,250 Broom stick 3 16 48 Feeder container 500 20 10,000 Tray 500 4 2000 Dust pan 3 20 60 Push Cart 3 1500 4500
  • 26.
    Pantabas 2 450900 Power Sprayer 2 5500 11,000 Total P653,008
  • 28.
  • 30.
    SIZES PRICE /PIECE SmallP4 Medium P4.33 Large P4.83 Extra Large P5.33 Cracked P3
  • 31.
    Place The CAD Eggfarm will be located at NHAPurok 9Telapayong,Arayat, Pampanga with an area of 2 hectares.
  • 32.
    30% 25% 20% 15% 10% Magalang Public Market AngelesPublic Market Arayat Public Market Mabalacat Public Market Pick up buyers
  • 33.
     Word ofmouth  T-shirt CAD Egg Farm
  • 35.
    The capital requirementis P 7,000,000 which will be loan from the BDO with 12% interest per annum. Two of the owners will be providing P3,000,000 and one of the owners will contribute P1,000,000 and the 2 hectare land that they will use.
  • 36.
    Loan Payment InterestTotal Payment of Loan 1st year P7,000,000 P1,400,000 P7,000,000 x 12% P840,000 P2,240,000 2nd year P5,600,000 P1,400,000 P5,600,000 x 12% P672, 000 P2,072,000 3rd year P4, 200,000 P1,400,000 P4, 200,000 x 12% P504,000 P1,904,000 4th year P2,800,000 P1,400,000 P2,800,000 x 12% P336,000 P1,736,000 5th year P1,400,000 P1,400,000 P1,400,000 x 12% P168,000 P1,568,000
  • 38.
    Description Quantity Price/unitTotal Laying House 2 600,000 1,200,000 Brooder House 2 350,000 700,000 Laborers House 1 250,000 250,000 Storage house For Eggs 1 200,000 200,000 Office 1 100,000 100,000 Guard House 1 50,000 50,000 Tools and Equipment house 1 150,000 150,000 Total P2,650,000
  • 39.
    Feeds Age of Chick No. ofSack Price Total Starter Mash 1-6 weeks 130 P1,000 P130,000 Developer Mash 6-20 weeks 295 P1,000 P295,000 Laying Mash 20-80 weeks 1260 P1,050 P1,323,000 Total P1,748,000
  • 40.
    Names Salary Quantit y Monthly Contribution Total contributi onin SSS Employer Yearly contributi on Employer Employee Bookkeeper P9,000.00 1 P 636.00 P 300.00 P 936.00 P 7,632 Flockmen P7,ooo.oo 4 1,978.8 933.2 2,912 23, 754 Driver P5,000.00 1 353.30 166.70 520 4239.6 Security guard P6,000.00 2 848 400.00 1,248 10, 176 Total P 3, 815 P 1,799.9 P 5,616 P45,801.6
  • 41.
    Names Salary Quantity MonthlyContribution Total contribution in Phil Health Employer Yearly contributionEmployer Employee Bookkeeper P9,000.00 1 P 112.50 P 112.50 P 225 P 1,350 Flockmen P7,000.00 4 350 350 700 4,200 Driver P5,000.00 1 62.50 62.50 125 750 Security guard P6,000.00 2 150 150 300 1,800 Total P 675 P 8,100
  • 42.
    Description Quantity MonthlyYearly Electricity (power and water supply) 1 month P18,000 P216,000 Salary of the employees 9 P56,500 P678,000 Permits -BIR -DTI -Mayor’s Permit 1 1 1 P3,000 P500 P2,000 Gasoline P4,500 P54,000 Bonuses P56,000 SSS P3, 815 P45,801.6 Phil Health P 675 P 8,100 Advertising expense 100 P20,000 Total P1,083,401.6
  • 43.
    Description Quantity Price/unitTotal Cost Lohmann Bird 10,000 P37.00 P370,000 Medication and Vaccination 10,000 P 70, 000/year P70,000 Total P440,000
  • 44.
    Cost of ProductionTotal Farm construction P2,650,000 Layer Expense P440,000 Tools and Equipments P653,008 Feeds P1,748,000 Overhead Expenses P1,083,401.6 TOTAL COST OF PRODUCTION P6,574,409.6
  • 45.
    MONTHS NO.OF DAYS NO.OF LAYERS EGGS/DAY Laying Efficiency EGGS/Mont h September30 10,000 0 October 31 9,990 0 November 30 9,960 0 December 31 9,950 0 January 31 9,945 6700 67% 207,700 February 28 9,860 6800 69% 190,400 March 31 9,802 6900 70% 213,900 April 30 9,716 7100 73% 213,000 May 31 9,693 7200 74% 223,200 June 30 9,608 7900 82% 237,000 July 31 9,564 6700 70% 207,700 August 31 9,500 6800 72% 210,800 Total 1,703,700
  • 46.
    Size Price % of production QuantityTotal Small P4 15% 255,555 P1,022,220 Medium P4.33 25% 425,925 P1,844,255 Large P4.83 30% 511,110 P2,468,661 Extra large P5.33 25% 425,925 P2,270,180 Cracked/Reject P3 5% 85,185 P255,555 Manure P10 800 sacks P8,000 Total Gross Income P7,868,871.80
  • 47.
    MONTHS NO.OF DAYS NO.OF LAYERS EGGS/DAY Laying Efficiency EGGS/Mont h September30 9,490 6,700 71% 201,000 October 31 9,485 6,695 71% 207,545 November 30 9,480 6,690 71% 200,700 December 31 9,480 6,685 71% 207,235 January 31 9, 479 6,680 70% 207,080 February 28 9, 477 5,675 60% 158,900 March 31 9, 470 5,670 60% 175,770 April 30 9, 469 5,665 60% 169,950 May Cleaning and Maintenance of the layer houses June 30 9, 995 6,800 68% 204,000 July 31 9, 990 6,850 69% 212,350 August 31 9, 985 6,900 69% 213,900 Total P2,158,430
  • 48.
    Chickens will beCulled in approximately 1 year and 8 months Price of the eggs will increase 2% per annum
  • 49.
    Size Price % of production QuantityTotal Small P4.08 10% 215,843 P880,639 Medium P4.42 30% 647,529 P2,862,078 Large P4.93 25% 539,608 P2,660,265 Extra large P5.44 25% 539,608 P2,935,465 Cracked/Reject P3.06 10% 215,843 P660,480 Manure P10 800 sacks P8,000 Total Gross Income P10,006,927
  • 50.
    MONTHS NO.OF DAYS NO.OF LAYERS EGGS/DAY Laying Efficiency EGGS/Month September30 9,980 6,560 66% 196,800 October 31 9,977 7,695 77% 238,545 November 30 9,970 7,290 73% 218,700 December 31 9,965 7,185 72% 222,735 January 31 9,962 7,990 80% 247,690 February 28 9,959 7,875 79% 220,500 March 31 9,955 6,670 67% 206,770 April 30 9,953 6,675 67% 200,250 May 31 9,950 6,670 67% 206,770 June 30 9,948 6,600 66% 198,000 July 31 9,943 6,550 66% 203,050 August 31 9,941 6,400 64% 198,400 Total 2,558,210
  • 51.
    Size Price % of production QuantityTotal Small P4.16 9% 230,239 P957,794 Medium P4.50 32% 818,627 P3,683,822 Large P5.03 26% 665,135 P3,345,627 Extra large P5.55 25% 639,553 P3,549,516 Cracked/Reject P3.12 8% 204,657 P638,529 Manure P10.00 800 sacks P8,000 Total Gross Income P12,183,289
  • 52.
    MONTHS NO.OF DAYSNO.OF LAYERS EGGS/DAY Laying Efficiency EGGS/Month September 30 9,850 6,580 67% 197,400 October 31 9,760 6, 330 65% 196,230 November 30 9,690 6,260 65% 187,800 December 31 9,570 6,140 64% 190,340 January 31 9,430 6,820 72% 211,420 February Cleaning and Maintenance of the layer houses March 31 9,955 7,850 79% 243,350 April 30 9,953 7,840 79% 235,200 May 31 9,950 7,760 78% 240,560 June 30 9,948 7,650 77% 229,500 July 31 9,943 7,640 77% 236,840 August 31 9,941 7,590 76% 235,290 Total 2,403,930
  • 53.
    Size Price % of production QuantityTotal Small P4.24 8% 192,314 P815,413 Medium P4.60 35% 841,376 P3,870,327 Large P5.13 27% 649,061 P3,329,683 Extra large P5.66 23% 552,904 P3,129,436 Cracked/Reject P3.18 7% 168,275 P535,115 Manure P10.00 800 sacks P8,000 Total Gross Income P11,687,975
  • 54.
    MONTHS NO.OF DAYSNO.OF LAYERS EGGS/DAY % of Production EGGS/Month September 30 9,939 7,560 76% 226,800 October 31 9,935 7,660 77% 237,460 November 30 9,927 8,790 89% 263,700 December 31 9,919 8,790 89% 272,490 January 31 9,908 7,780 79% 241,180 February 28 9,897 7,770 79% 217,560 March 31 9, 889 6,750 68% 209,250 April 30 9,870 6,780 69% 203,400 May 31 9,864 6,760 69% 209,560 June 30 9, 857 6,740 68% 202,200 July 31 9, 848 6,720 68% 208,320 August 31 9, 832 6,630 67% 205,530 Total 2,697,450
  • 55.
    Size Price % of production QuantityTotal Small P4.33 8% 215,796 934,397 Medium P4.69 35% 944,108 4,427,864 Large P5.23 27% 728,312 3,809,069 Extra large P5.77 23% 620,414 3,579,786 Cracked/Reject P3.25 7% 188,822 613,670 Manure P10.00 800 sacks P8,000 Total Gross Income P13,372,786
  • 57.
    Description Quantity Price/unitTotal Farm Land 2 hectares P1,000,000 P2,000,000 Laying House 2 600,000 1,200,000 Brooder House 2 350,000 700,000 Laborers House 1 250,000 250,000 Storage house For Eggs 1 200,000 200,000 Office 1 150,000 150,000 Tools and Equipment house 1 150,000 150,000 Total P2,650,000
  • 59.
    Equipments Cost Analysis 1st year CostAnalysis 2nd year Cost Analysis 3rd year Cost Analysis 4th year Cost Analysis 5th year Egg grading machine P35,000 Generator 200,000 Pail 300 309 318.27 327.8181 337.6526 Truck 350,000 Jetmatic 16,000 Shovel 1,950 Water host 3,250 Broom stick 48 49 50.47 51.9841 53.54362 Feeder container 10,000 10,300 10609 10927.27 11255.09 Tray 2000 2,060 2121.8 2185.454 2251.018 Dust pan 60 62 63.86 65.7758 67.74907 Push Cart 4500 4,635 4774.05 4917.272 5064.79 Pantabas 900 927 954.81 983.4543 1012.958 Power sprayer 11,000 11,330 11669.9 12020 12380.6 Total P653,008 P29,672 P30,562.16 P31,479.02 P32,423.4
  • 61.
    Description Cost Analysis 1styear Cost Analysis 2nd Year Cost Analysis 3rd Year Cost Analysis 4th Year Cost Analysis 5th Year Lohmann Bird P370, 000 P381,100 - P392,533 P404,309 Medication and Vaccination P70,000 P 72,100 P74,263 P76,490 P78,785 Starter Mash P130,000 P133,900 P137,917 P142,055 P146,317 Developer Mash P295,000 P303,850 P312,966 P322,355 P332,026 Laying Mash P1,323,000 P1,362,690 P1,403,571 P1,445,678 P1,489,048 Total P2,188,000 P2,253,640 P1,928,716 P2,379,111 P2,450,485
  • 63.
    Description Cost Analysis 1st Year CostAnalysis 2nd Year Cost Analysis 3rd Year Cost Analysis 4th Year Cost Analysis 5th Year Electricity (power and water supply) P216,000 222,480 229,154 236,029 243,110 Salary of the employees P678,000 698,340 719,290 740,869 763,095 Permits -BIR -DTI -Mayor’s Permit P3,000 P500 P2,000 3,090 515 2,060 3,183 530 2,122 3,278 546 2,186 3,376 562 2,252 Gasoline P54,000 55,620 57,289 59,008 60,778 Bonuses P56,000 57,680 59,410 61,192 63,028 SSS P45,801.6 47,175.6 48,590.9 50,048.6 51,550.05 Phil Health P 8,100 8,343 8,593.3 8,851.1 9,116.6 Advertising P20,000 20,600 21,218 21,854.54 22,510.18 Total P 1,083,401.6 P 1,115,903.6 P1,149,380 P1,183,862 P1,219,378
  • 65.
    Cost of ProductionTotal Farm construction P2,650,000 Layer Expenses P2,118,000 Equipments P653,008 Overhead Expenses P 1,083,401.6 TOTAL COST OF PRODUCTION P6,574,409.6 Return Total Total Gross Income P7,868,871.80 Total Cost of Production P6, 574,409.6 Loan Payable P2,240,000 TOTAL NET INCOME P-945,537.80
  • 66.
    Cost of ProductionTotal Layer Expenses P2,181,540 Equipments P29,672 Overhead Expense P 1,115,903.6 TOTAL COST OF PRODUCTION P3, 327,115.6 Return Total Total Gross Income P10,006,927 Total Cost of Production P3, 327,115.6 Loan Payable P2,072,000 TOTAL NET INCOME P4,607,811
  • 67.
    Cost of ProductionTotal Layer Expenses P2,246,986 Equipments P30,562.16 Overhead Expense P1,149,380 TOTAL COST OF PRODUCTION P3, 426,928.16 Return Total Total Gross Income P12,183,289 Total Cost of Production P3, 426,928.16 Loan Payable P1,904,000 TOTAL NET INCOME P6,852,361
  • 68.
    Cost of ProductionTotal Layer Expenses P2,314,397 Equipments P31,479.02 Overhead Expense P1,183,862 TOTAL COST OF PRODUCTION P3, 529,738.02 Return Total Total Gross Income P11,687,975 Total Cost of Production P3, 529,738.02 Loan Payable P1,736,000 TOTAL NET INCOME P6,422,236.98
  • 69.
    Cost of ProductionTotal Layer Expenses 2,383,829 Equipments P32,423.4 Overhead Expense 1,219,378 TOTAL COST OF PRODUCTION P 3,635,630.4 Return Total Total Gross Income P13,372,786 Total Cost of Production P 3, 635,630.4 Loan Payable P1,568,000 TOTAL NET INCOME P8,169,155.6
  • 70.
    1st Year 2nd Year 3rd Year4th Year 5th Year Total Gross Income P7,868,871.80 P10,006,927 P12,183,289 P11,687,975 P13,372,786 Total Cost of Producti on P6,574,409.6 P3, 327,115.6 P3, 426,928.16 P3,529,738.02 P3,635,630.4 Loans Payable P2,240,000 P2,072,000 P1,904,000 P1,736,000 P1,568,000 Total Net Income P-945,537.80 P4,607,811 P6,852,361 P6,422,236.98 P8,169,155.6
  • 71.
  • 72.
    ROI = TotalNet Income x 100 Total Cost Production 1st year 4th year P-945,537.80 x 100% P6,422,236.98 x100% P6,574,409.6 P3,529,738.02 =-14.38% =181.95% 2nd year 5th year P4,607,811 x100% P8,169,155.6 x100% P3,327,115.6 P3,635,630.4 =138.49% =224.70% 3rd year P6,852,361 x 100% P3,426,928.16 =199.96%
  • 73.
    PPU = TotalSelling Price No. of Products 1st year 4th year 4+4.33+4.83+5.33+3 4.24+4.60+5.13+5.66+3.18 5 5 = 4.29/egg =4.56/egg 2nd year 5th year 4.08+4.42+4.93+5.44+3.06 4.33+4.69+5.23+5.77+3.25 5 5 =4.39/egg = 4.65/egg 3rd year 4.16+4.50+5.03+5.55+3.12 5 =4.47/egg
  • 74.
    BEP= Total Costof Production Price per Unit 1st year 4th year P6,574,409.6 P3,529,738.02 4.29 4.56 =1,532,496 eggs =774,065 eggs 2nd 5th year P3, 327,115.6 P3,635,630.4 4.39 4.65 =757,885 eggs =781,856 eggs 3rd year P3,426,928.16 4.47 =766,662 eggs
  • 75.
    CPU= Total Costof Production Volume of Production 1st year 4th year P6,574,409.6 P3,529,738.02 2,159,700 3,199,930 =3.04 cost to produced egg =1.10 2nd year 5th year P3, 327,115.6 P3,635,630.4 2,915,430 3,550,450 =1.14 =1.02 3rd year P3,426,928.16 3,259,210 =1.05
  • 76.
    1ST YEAR 2NDYEAR 3RD YEAR 4TH YEAR 5TH YEAR TGI P7,868,871.80 P10,006,927 P12,183,289 P11,687,975 P13,372,786 TCP P6,574,409.6 P3, 327,115.6 P3, 426,928.16 P3,529,738.02 P3,635,630.4 TNI P-945,537.80 P4,607,811 P6,852,361 P6,422,236.98 P8,169,155.6 ROI 17.62% 243.66% 297.25% 291.23% 342.70% CPU 3.04 1.14 1.05 1.1 1.02 PPU 4.29/eggs 4.39/eggs 4.47/eggs 4.56/eggs 4.65/eggs BEP 1,532,496 eggs eggs 757,885 eggs 766,662 eggs 774,065 eggs 781,856 eggs VOP 2,159,700 2,915,430 3,259,210 3,199,930 3,550,450
  • 77.