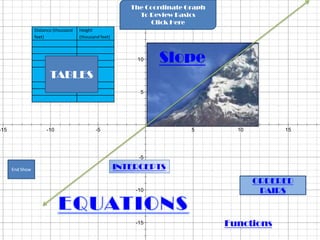
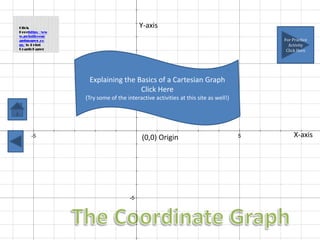
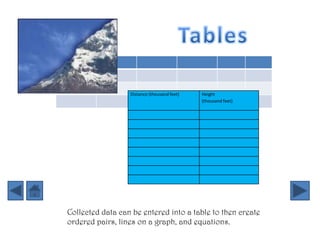
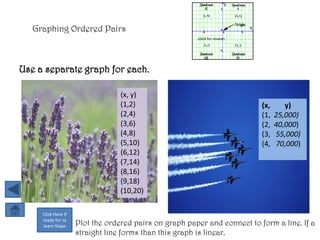
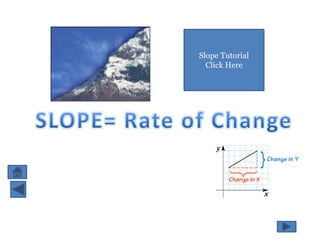
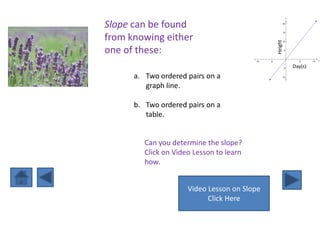
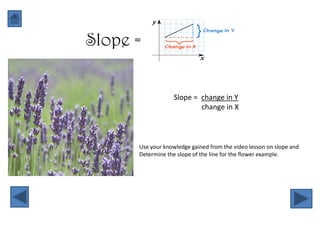
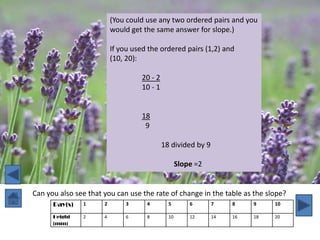
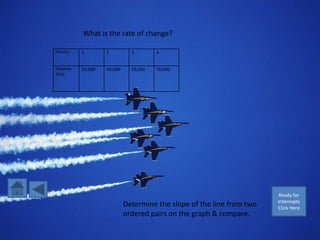
SlideShare a Scribd company logo
Tables, Graphs, & Equations
                  Cheryl Cresci


         Department of Education Math Standard 2-
 End
Show
                  Algebraic Reasoning.
                                                        Grade 8:
           Determine the slope of a line given two points on the line (as coordinates, in a graph, in a table)
                                Use y-intercept and slope to graph the equation of a line
               Compare the rates of change in tables and graphs and classify them as linear or nonlinear
                        Write an equation given the tabular or graphic form of a linear problem
Analyze the interrelationships among tables, graphs, and equations of lines, paying particular attention to the meaning
                                  of intercept and slope in the context of the problem
The Coordinate Graph
                                                             To Review Basics
                                                                Click Here
                                                            15
                 Distance (thousand   Height
                 feet)                (thousand feet)


                                                            10    Slope
                        TABLES
                         TABLES
                                                             5


-15                   -10                     -5                           5        10        15


                                                             -5

      End Show                                          INTERCEPTS
                                                                                         ORDERED
                                                            -10                           PAIRS


                                                            -15                   Functions
Click                                   Y-axis
Herehttp://ww
w.printfreegr
aphpaper.co                                                                          For Practice
m/ to Print                                                                            Activity
Graph Paper                                                                           Click Here


                                   5


                 Explaining the Basics of a Cartesian Graph
                                 Click Here
                (Try some of the interactive activities at this site as well!)


     -5                                 (0,0) Origin                             5        X-axis


                                   -5
Print Graph
Paper
http://www.print
freegraphpaper.c
om/
                   Practice making and using your own graph:
Click Here

                   1.   Make the x-axis and label with integers.
                   2.   Make the y-axis and label with integers.
                   3.   Label the four quadrants.
                   4.   Make a simple drawing and list the order pairs on a separate sheet.
                   5.   Give the list of ordered pairs to a partner and see if they
                         re-create your original drawing. (Don’t let them see your picture
                         ahead!)


                                                                                        Click here to
                                                              Coordinate Graph Lesson
                                                                     Click Here
                                                                                        next review
                                                                                            Tables
Distance (thousand feet)   Height
                                             (thousand feet)


Collected data can be entered into a table to then create
ordered pairs, lines on a graph, and equations.
We could use a table to chart the height of the flowers as
time passes.
Day(s)   1   2     3      4      5      6     7      8      9      10

Height   2   4     6      8      10     12    14     16     18     20
(mm)


                 This flower is growing at a constant rate; therefore, it is
                 linear. If it is not growing at a constant rate it is non-
                 linear.
We can create a table showing the distance traveled with time……
Hour(s)    1        2        3        4


                          Distance   25,000   40,000   55,000   70,000
                          (Km)


                                                                         Click Here to
                                                                            Review
                                                                         ordered Pairs


This airplane is traveling at a constant rate; therefore it is linear.
Video on Graphing Ordered Pairs
Click here
This table can be listed as ordered pairs
    Day(s)        1   2      3        4     5      6      7    8         9    10

    x
    Height (mm)   2   4      6        8     10     12     14   16        18   20

    Y

                                 The ordered pairs would be:   (x, y)
                                                               (1,2)
                                                               (2,4)
                                                               (3,6)
                                                               (4,8)
                                                               (5,10)
                                                               (6,12)
                                                               (7,14)
                                                               (8,16)
                                                               (9,18)
                                                               (10,20)
This table can be turned into ordered pairs:


                       Hour(s)   1        2        3         4


                       Distanc   25,000   40,000   55,000    70,000
                       e (Km)


                                                            The ordered pairs would be:


                                                                            (x,     y)
                                                                            (1,   25,000)
                                                                            (2,   40,000)
                                                                            (3,   55,000)
                                                                            (4,   70,000)
Graphing Ordered Pairs
                                                        (click for review)


Use a separate graph for each.

                                  (x, y)
                                  (1,2)                                      (x,      y)
                                  (2,4)                                      (1,   25,000)
                                  (3,6)                                      (2,   40,000)
                                  (4,8)                                      (3,   55,000)
                                  (5,10)                                     (4,   70,000)
                                  (6,12)
                                  (7,14)
                                  (8,16)
                                  (9,18)
                                  (10,20)

     Click Here if
     ready for to
     learn Slope     Plot the ordered pairs on graph paper and connect to form a line. If a
                     straight line forms than this graph is linear.
Slope Tutorial
  Click Here
How much is the flower growing each day?


          Day(s)   1   2   3   4   5    6    7    8    9    10

          Height   2   4   6   8   10   12   14   16   18   20
          (mm)
The amount it is growing is 2mm per day.

This is the rate of change.

The rate of change is also called the slope of
the line.
y


Slope can be found                                            20


                                                              15


from knowing either


                                                     Height
                                                              10


one of these:                                                  5


                                          -10   -5                       5      10   x


                                                              -5       Day(s)
      a. Two ordered pairs on a                           -10


         graph line.

      b. Two ordered pairs on a
         table.


         Can you determine the slope?
         Click on Video Lesson to learn
         how.


                      Video Lesson on Slope
                            Click Here
Slope =


                   Slope = change in Y
                           change in X


      Use your knowledge gained from the video lesson on slope and
      Determine the slope of the line for the flower example.
(You could use any two ordered pairs and you
                          would get the same answer for slope.)

                          If you used the ordered pairs (1,2) and
                          (10, 20):

                                    20 - 2
                                    10 - 1


                                    18
                                     9

                                             18 divided by 9

                                                    Slope =2


Can you also see that you can use the rate of change in the table as the slope?
      Day(s)   1      2        3     4         5        6      7    8    9    10

      Height   2      4        6     8         10       12     14   16   18   20
      (mm)
What is the rate of change?

Hour(s)    1        2          3        4


Distance   25,000   40,000     55,000   70,000
(Km)


                                                                         Ready for
                                                                        Intercepts
                             Determine the slope of the line from two   Click Here
                             ordered pairs on the graph & compare.
Intercepts
   Click Here
Y-intercept …… is where the line crosses the Y-axis.


             X-intercept…….is where the line crosses the x-axis.
Click Here for Video on X & Y Intercepts


Click Here
  when
 ready to
  learn              Click Here for a Lesson on X & Y Intercepts
  about
Equations               (Try some of the practice problems.)
Can you determine the intercepts?
Day(s)   1   2   3     4     5     6      7     8        9    10
x
Height   2   4   6     8     10    12     14    16       18   20
(mm)
y
The y-intercept is 0. The x-intercept is 0.


                                               Click Here
                                              when ready
                                                to learn
                                                 about
                                               Equations
Y= -5x + 17
    Y=2x + 4

               EQUATIONS
                  Click Here
                                  3x + 4y =10

-9x + 3y =27
There is more than one way to find the equation of a line.


                                                 Equations of a straight
                                                          line.
Point-Slope Formula                                    Click Here
     Click Here


                Video Lesson on Writing Equation Given a Point and the Slope


                        Video on Graphing an Equation
                                  Click Here
If the slope is 2 and passes through the point (2,4)
What is the equation of this line?

( Use knowledge from watching video lesson
 and web page lesson.)
The equation is:   Y=2x


Day(s)   1   2   3     4      5     6      7      8     9      10
x
Height   2   4   6     8      10    12     14     16    18     20
(mm)
y


                       Can you also see how you could plug in the value
                       for x into the equation, solve, and obtain Y value?
If the slope of the line is 15, 000 and passes through the
Point (2, 40,000) ….What is the equation of the line?
The equation is:

         Y=15,000x + 10,000
Can you see connections?
                              Tables

                              Ordered Pairs

                              Graphs

                              Slope

                              Intercepts

                              Equations

                              Functions


Go back and review any section you are not confident with yet….   Review
The End

More Related Content

Viewers also liked

Solution of linear equation & inequality
Solution of linear equation & inequalitySolution of linear equation & inequality
Solution of linear equation & inequality
florian Manzanilla
 
Algebraic Mathematics of Linear Inequality & System of Linear Inequality
Algebraic Mathematics of Linear Inequality & System of Linear InequalityAlgebraic Mathematics of Linear Inequality & System of Linear Inequality
Algebraic Mathematics of Linear Inequality & System of Linear Inequality
Jacqueline Chau
 
CABT Math 8 measures of central tendency and dispersion
CABT Math 8   measures of central tendency and dispersionCABT Math 8   measures of central tendency and dispersion
CABT Math 8 measures of central tendency and dispersion
Gilbert Joseph Abueg
 
Factoring the greatest common monomial factor
Factoring the greatest common monomial factorFactoring the greatest common monomial factor
Factoring the greatest common monomial factor
Nara Cocarelli
 
Linear Equations and Inequalities in One Variable
Linear Equations and Inequalities in One VariableLinear Equations and Inequalities in One Variable
Linear Equations and Inequalities in One Variable
misey_margarette
 
Strategic Intervention Materials
Strategic Intervention MaterialsStrategic Intervention Materials
Strategic Intervention Materials
Brian Mary
 

Viewers also liked (6)

Solution of linear equation & inequality
Solution of linear equation & inequalitySolution of linear equation & inequality
Solution of linear equation & inequality
 
Algebraic Mathematics of Linear Inequality & System of Linear Inequality
Algebraic Mathematics of Linear Inequality & System of Linear InequalityAlgebraic Mathematics of Linear Inequality & System of Linear Inequality
Algebraic Mathematics of Linear Inequality & System of Linear Inequality
 
CABT Math 8 measures of central tendency and dispersion
CABT Math 8   measures of central tendency and dispersionCABT Math 8   measures of central tendency and dispersion
CABT Math 8 measures of central tendency and dispersion
 
Factoring the greatest common monomial factor
Factoring the greatest common monomial factorFactoring the greatest common monomial factor
Factoring the greatest common monomial factor
 
Linear Equations and Inequalities in One Variable
Linear Equations and Inequalities in One VariableLinear Equations and Inequalities in One Variable
Linear Equations and Inequalities in One Variable
 
Strategic Intervention Materials
Strategic Intervention MaterialsStrategic Intervention Materials
Strategic Intervention Materials
 

Recently uploaded

UiPath Test Automation using UiPath Test Suite series, part 6
UiPath Test Automation using UiPath Test Suite series, part 6UiPath Test Automation using UiPath Test Suite series, part 6
UiPath Test Automation using UiPath Test Suite series, part 6
DianaGray10
 
“I’m still / I’m still / Chaining from the Block”
“I’m still / I’m still / Chaining from the Block”“I’m still / I’m still / Chaining from the Block”
“I’m still / I’m still / Chaining from the Block”
Claudio Di Ciccio
 
GraphRAG for Life Science to increase LLM accuracy
GraphRAG for Life Science to increase LLM accuracyGraphRAG for Life Science to increase LLM accuracy
GraphRAG for Life Science to increase LLM accuracy
Tomaz Bratanic
 
Introduction to CHERI technology - Cybersecurity
Introduction to CHERI technology - CybersecurityIntroduction to CHERI technology - Cybersecurity
Introduction to CHERI technology - Cybersecurity
mikeeftimakis1
 
AI 101: An Introduction to the Basics and Impact of Artificial Intelligence
AI 101: An Introduction to the Basics and Impact of Artificial IntelligenceAI 101: An Introduction to the Basics and Impact of Artificial Intelligence
AI 101: An Introduction to the Basics and Impact of Artificial Intelligence
IndexBug
 
Mariano G Tinti - Decoding SpaceX
Mariano G Tinti - Decoding SpaceXMariano G Tinti - Decoding SpaceX
Mariano G Tinti - Decoding SpaceX
Mariano Tinti
 
HCL Notes und Domino Lizenzkostenreduzierung in der Welt von DLAU
HCL Notes und Domino Lizenzkostenreduzierung in der Welt von DLAUHCL Notes und Domino Lizenzkostenreduzierung in der Welt von DLAU
HCL Notes und Domino Lizenzkostenreduzierung in der Welt von DLAU
panagenda
 
Observability Concepts EVERY Developer Should Know -- DeveloperWeek Europe.pdf
Observability Concepts EVERY Developer Should Know -- DeveloperWeek Europe.pdfObservability Concepts EVERY Developer Should Know -- DeveloperWeek Europe.pdf
Observability Concepts EVERY Developer Should Know -- DeveloperWeek Europe.pdf
Paige Cruz
 
Unlock the Future of Search with MongoDB Atlas_ Vector Search Unleashed.pdf
Unlock the Future of Search with MongoDB Atlas_ Vector Search Unleashed.pdfUnlock the Future of Search with MongoDB Atlas_ Vector Search Unleashed.pdf
Unlock the Future of Search with MongoDB Atlas_ Vector Search Unleashed.pdf
Malak Abu Hammad
 
How to Get CNIC Information System with Paksim Ga.pptx
How to Get CNIC Information System with Paksim Ga.pptxHow to Get CNIC Information System with Paksim Ga.pptx
How to Get CNIC Information System with Paksim Ga.pptx
danishmna97
 
Best 20 SEO Techniques To Improve Website Visibility In SERP
Best 20 SEO Techniques To Improve Website Visibility In SERPBest 20 SEO Techniques To Improve Website Visibility In SERP
Best 20 SEO Techniques To Improve Website Visibility In SERP
Pixlogix Infotech
 
Video Streaming: Then, Now, and in the Future
Video Streaming: Then, Now, and in the FutureVideo Streaming: Then, Now, and in the Future
Video Streaming: Then, Now, and in the Future
Alpen-Adria-Universität
 
Climate Impact of Software Testing at Nordic Testing Days
Climate Impact of Software Testing at Nordic Testing DaysClimate Impact of Software Testing at Nordic Testing Days
Climate Impact of Software Testing at Nordic Testing Days
Kari Kakkonen
 
Why You Should Replace Windows 11 with Nitrux Linux 3.5.0 for enhanced perfor...
Why You Should Replace Windows 11 with Nitrux Linux 3.5.0 for enhanced perfor...Why You Should Replace Windows 11 with Nitrux Linux 3.5.0 for enhanced perfor...
Why You Should Replace Windows 11 with Nitrux Linux 3.5.0 for enhanced perfor...
SOFTTECHHUB
 
Removing Uninteresting Bytes in Software Fuzzing
Removing Uninteresting Bytes in Software FuzzingRemoving Uninteresting Bytes in Software Fuzzing
Removing Uninteresting Bytes in Software Fuzzing
Aftab Hussain
 
みなさんこんにちはこれ何文字まで入るの?40文字以下不可とか本当に意味わからないけどこれ限界文字数書いてないからマジでやばい文字数いけるんじゃないの?えこ...
みなさんこんにちはこれ何文字まで入るの?40文字以下不可とか本当に意味わからないけどこれ限界文字数書いてないからマジでやばい文字数いけるんじゃないの?えこ...みなさんこんにちはこれ何文字まで入るの?40文字以下不可とか本当に意味わからないけどこれ限界文字数書いてないからマジでやばい文字数いけるんじゃないの?えこ...
みなさんこんにちはこれ何文字まで入るの?40文字以下不可とか本当に意味わからないけどこれ限界文字数書いてないからマジでやばい文字数いけるんじゃないの?えこ...
名前 です男
 
HCL Notes and Domino License Cost Reduction in the World of DLAU
HCL Notes and Domino License Cost Reduction in the World of DLAUHCL Notes and Domino License Cost Reduction in the World of DLAU
HCL Notes and Domino License Cost Reduction in the World of DLAU
panagenda
 
GraphSummit Singapore | The Art of the Possible with Graph - Q2 2024
GraphSummit Singapore | The Art of the  Possible with Graph - Q2 2024GraphSummit Singapore | The Art of the  Possible with Graph - Q2 2024
GraphSummit Singapore | The Art of the Possible with Graph - Q2 2024
Neo4j
 
How to use Firebase Data Connect For Flutter
How to use Firebase Data Connect For FlutterHow to use Firebase Data Connect For Flutter
How to use Firebase Data Connect For Flutter
Daiki Mogmet Ito
 
Full-RAG: A modern architecture for hyper-personalization
Full-RAG: A modern architecture for hyper-personalizationFull-RAG: A modern architecture for hyper-personalization
Full-RAG: A modern architecture for hyper-personalization
Zilliz
 

Recently uploaded (20)

UiPath Test Automation using UiPath Test Suite series, part 6
UiPath Test Automation using UiPath Test Suite series, part 6UiPath Test Automation using UiPath Test Suite series, part 6
UiPath Test Automation using UiPath Test Suite series, part 6
 
“I’m still / I’m still / Chaining from the Block”
“I’m still / I’m still / Chaining from the Block”“I’m still / I’m still / Chaining from the Block”
“I’m still / I’m still / Chaining from the Block”
 
GraphRAG for Life Science to increase LLM accuracy
GraphRAG for Life Science to increase LLM accuracyGraphRAG for Life Science to increase LLM accuracy
GraphRAG for Life Science to increase LLM accuracy
 
Introduction to CHERI technology - Cybersecurity
Introduction to CHERI technology - CybersecurityIntroduction to CHERI technology - Cybersecurity
Introduction to CHERI technology - Cybersecurity
 
AI 101: An Introduction to the Basics and Impact of Artificial Intelligence
AI 101: An Introduction to the Basics and Impact of Artificial IntelligenceAI 101: An Introduction to the Basics and Impact of Artificial Intelligence
AI 101: An Introduction to the Basics and Impact of Artificial Intelligence
 
Mariano G Tinti - Decoding SpaceX
Mariano G Tinti - Decoding SpaceXMariano G Tinti - Decoding SpaceX
Mariano G Tinti - Decoding SpaceX
 
HCL Notes und Domino Lizenzkostenreduzierung in der Welt von DLAU
HCL Notes und Domino Lizenzkostenreduzierung in der Welt von DLAUHCL Notes und Domino Lizenzkostenreduzierung in der Welt von DLAU
HCL Notes und Domino Lizenzkostenreduzierung in der Welt von DLAU
 
Observability Concepts EVERY Developer Should Know -- DeveloperWeek Europe.pdf
Observability Concepts EVERY Developer Should Know -- DeveloperWeek Europe.pdfObservability Concepts EVERY Developer Should Know -- DeveloperWeek Europe.pdf
Observability Concepts EVERY Developer Should Know -- DeveloperWeek Europe.pdf
 
Unlock the Future of Search with MongoDB Atlas_ Vector Search Unleashed.pdf
Unlock the Future of Search with MongoDB Atlas_ Vector Search Unleashed.pdfUnlock the Future of Search with MongoDB Atlas_ Vector Search Unleashed.pdf
Unlock the Future of Search with MongoDB Atlas_ Vector Search Unleashed.pdf
 
How to Get CNIC Information System with Paksim Ga.pptx
How to Get CNIC Information System with Paksim Ga.pptxHow to Get CNIC Information System with Paksim Ga.pptx
How to Get CNIC Information System with Paksim Ga.pptx
 
Best 20 SEO Techniques To Improve Website Visibility In SERP
Best 20 SEO Techniques To Improve Website Visibility In SERPBest 20 SEO Techniques To Improve Website Visibility In SERP
Best 20 SEO Techniques To Improve Website Visibility In SERP
 
Video Streaming: Then, Now, and in the Future
Video Streaming: Then, Now, and in the FutureVideo Streaming: Then, Now, and in the Future
Video Streaming: Then, Now, and in the Future
 
Climate Impact of Software Testing at Nordic Testing Days
Climate Impact of Software Testing at Nordic Testing DaysClimate Impact of Software Testing at Nordic Testing Days
Climate Impact of Software Testing at Nordic Testing Days
 
Why You Should Replace Windows 11 with Nitrux Linux 3.5.0 for enhanced perfor...
Why You Should Replace Windows 11 with Nitrux Linux 3.5.0 for enhanced perfor...Why You Should Replace Windows 11 with Nitrux Linux 3.5.0 for enhanced perfor...
Why You Should Replace Windows 11 with Nitrux Linux 3.5.0 for enhanced perfor...
 
Removing Uninteresting Bytes in Software Fuzzing
Removing Uninteresting Bytes in Software FuzzingRemoving Uninteresting Bytes in Software Fuzzing
Removing Uninteresting Bytes in Software Fuzzing
 
みなさんこんにちはこれ何文字まで入るの?40文字以下不可とか本当に意味わからないけどこれ限界文字数書いてないからマジでやばい文字数いけるんじゃないの?えこ...
みなさんこんにちはこれ何文字まで入るの?40文字以下不可とか本当に意味わからないけどこれ限界文字数書いてないからマジでやばい文字数いけるんじゃないの?えこ...みなさんこんにちはこれ何文字まで入るの?40文字以下不可とか本当に意味わからないけどこれ限界文字数書いてないからマジでやばい文字数いけるんじゃないの?えこ...
みなさんこんにちはこれ何文字まで入るの?40文字以下不可とか本当に意味わからないけどこれ限界文字数書いてないからマジでやばい文字数いけるんじゃないの?えこ...
 
HCL Notes and Domino License Cost Reduction in the World of DLAU
HCL Notes and Domino License Cost Reduction in the World of DLAUHCL Notes and Domino License Cost Reduction in the World of DLAU
HCL Notes and Domino License Cost Reduction in the World of DLAU
 
GraphSummit Singapore | The Art of the Possible with Graph - Q2 2024
GraphSummit Singapore | The Art of the  Possible with Graph - Q2 2024GraphSummit Singapore | The Art of the  Possible with Graph - Q2 2024
GraphSummit Singapore | The Art of the Possible with Graph - Q2 2024
 
How to use Firebase Data Connect For Flutter
How to use Firebase Data Connect For FlutterHow to use Firebase Data Connect For Flutter
How to use Firebase Data Connect For Flutter
 
Full-RAG: A modern architecture for hyper-personalization
Full-RAG: A modern architecture for hyper-personalizationFull-RAG: A modern architecture for hyper-personalization
Full-RAG: A modern architecture for hyper-personalization
 

Graphing, Slope & Intercepts

  • 1. Tables, Graphs, & Equations Cheryl Cresci Department of Education Math Standard 2- End Show Algebraic Reasoning. Grade 8: Determine the slope of a line given two points on the line (as coordinates, in a graph, in a table) Use y-intercept and slope to graph the equation of a line Compare the rates of change in tables and graphs and classify them as linear or nonlinear Write an equation given the tabular or graphic form of a linear problem Analyze the interrelationships among tables, graphs, and equations of lines, paying particular attention to the meaning of intercept and slope in the context of the problem
  • 2. The Coordinate Graph To Review Basics Click Here 15 Distance (thousand Height feet) (thousand feet) 10 Slope TABLES TABLES 5 -15 -10 -5 5 10 15 -5 End Show INTERCEPTS ORDERED -10 PAIRS -15 Functions
  • 3. Click Y-axis Herehttp://ww w.printfreegr aphpaper.co For Practice m/ to Print Activity Graph Paper Click Here 5 Explaining the Basics of a Cartesian Graph Click Here (Try some of the interactive activities at this site as well!) -5 (0,0) Origin 5 X-axis -5
  • 4. Print Graph Paper http://www.print freegraphpaper.c om/ Practice making and using your own graph: Click Here 1. Make the x-axis and label with integers. 2. Make the y-axis and label with integers. 3. Label the four quadrants. 4. Make a simple drawing and list the order pairs on a separate sheet. 5. Give the list of ordered pairs to a partner and see if they re-create your original drawing. (Don’t let them see your picture ahead!) Click here to Coordinate Graph Lesson Click Here next review Tables
  • 5. Distance (thousand feet) Height (thousand feet) Collected data can be entered into a table to then create ordered pairs, lines on a graph, and equations.
  • 6. We could use a table to chart the height of the flowers as time passes.
  • 7. Day(s) 1 2 3 4 5 6 7 8 9 10 Height 2 4 6 8 10 12 14 16 18 20 (mm) This flower is growing at a constant rate; therefore, it is linear. If it is not growing at a constant rate it is non- linear.
  • 8. We can create a table showing the distance traveled with time……
  • 9. Hour(s) 1 2 3 4 Distance 25,000 40,000 55,000 70,000 (Km) Click Here to Review ordered Pairs This airplane is traveling at a constant rate; therefore it is linear.
  • 10. Video on Graphing Ordered Pairs Click here
  • 11. This table can be listed as ordered pairs Day(s) 1 2 3 4 5 6 7 8 9 10 x Height (mm) 2 4 6 8 10 12 14 16 18 20 Y The ordered pairs would be: (x, y) (1,2) (2,4) (3,6) (4,8) (5,10) (6,12) (7,14) (8,16) (9,18) (10,20)
  • 12. This table can be turned into ordered pairs: Hour(s) 1 2 3 4 Distanc 25,000 40,000 55,000 70,000 e (Km) The ordered pairs would be: (x, y) (1, 25,000) (2, 40,000) (3, 55,000) (4, 70,000)
  • 13. Graphing Ordered Pairs (click for review) Use a separate graph for each. (x, y) (1,2) (x, y) (2,4) (1, 25,000) (3,6) (2, 40,000) (4,8) (3, 55,000) (5,10) (4, 70,000) (6,12) (7,14) (8,16) (9,18) (10,20) Click Here if ready for to learn Slope Plot the ordered pairs on graph paper and connect to form a line. If a straight line forms than this graph is linear.
  • 14. Slope Tutorial Click Here
  • 15. How much is the flower growing each day? Day(s) 1 2 3 4 5 6 7 8 9 10 Height 2 4 6 8 10 12 14 16 18 20 (mm)
  • 16. The amount it is growing is 2mm per day. This is the rate of change. The rate of change is also called the slope of the line.
  • 17. y Slope can be found 20 15 from knowing either Height 10 one of these: 5 -10 -5 5 10 x -5 Day(s) a. Two ordered pairs on a -10 graph line. b. Two ordered pairs on a table. Can you determine the slope? Click on Video Lesson to learn how. Video Lesson on Slope Click Here
  • 18. Slope = Slope = change in Y change in X Use your knowledge gained from the video lesson on slope and Determine the slope of the line for the flower example.
  • 19. (You could use any two ordered pairs and you would get the same answer for slope.) If you used the ordered pairs (1,2) and (10, 20): 20 - 2 10 - 1 18 9 18 divided by 9 Slope =2 Can you also see that you can use the rate of change in the table as the slope? Day(s) 1 2 3 4 5 6 7 8 9 10 Height 2 4 6 8 10 12 14 16 18 20 (mm)
  • 20. What is the rate of change? Hour(s) 1 2 3 4 Distance 25,000 40,000 55,000 70,000 (Km) Ready for Intercepts Determine the slope of the line from two Click Here ordered pairs on the graph & compare.
  • 21. Intercepts Click Here
  • 22. Y-intercept …… is where the line crosses the Y-axis. X-intercept…….is where the line crosses the x-axis.
  • 23. Click Here for Video on X & Y Intercepts Click Here when ready to learn Click Here for a Lesson on X & Y Intercepts about Equations (Try some of the practice problems.)
  • 24. Can you determine the intercepts? Day(s) 1 2 3 4 5 6 7 8 9 10 x Height 2 4 6 8 10 12 14 16 18 20 (mm) y
  • 25. The y-intercept is 0. The x-intercept is 0. Click Here when ready to learn about Equations
  • 26. Y= -5x + 17 Y=2x + 4 EQUATIONS Click Here 3x + 4y =10 -9x + 3y =27
  • 27. There is more than one way to find the equation of a line. Equations of a straight line. Point-Slope Formula Click Here Click Here Video Lesson on Writing Equation Given a Point and the Slope Video on Graphing an Equation Click Here
  • 28. If the slope is 2 and passes through the point (2,4) What is the equation of this line? ( Use knowledge from watching video lesson and web page lesson.)
  • 29. The equation is: Y=2x Day(s) 1 2 3 4 5 6 7 8 9 10 x Height 2 4 6 8 10 12 14 16 18 20 (mm) y Can you also see how you could plug in the value for x into the equation, solve, and obtain Y value?
  • 30. If the slope of the line is 15, 000 and passes through the Point (2, 40,000) ….What is the equation of the line?
  • 31. The equation is: Y=15,000x + 10,000
  • 32. Can you see connections? Tables Ordered Pairs Graphs Slope Intercepts Equations Functions Go back and review any section you are not confident with yet…. Review