This document describes the process and principles of acid-base titration. It discusses:
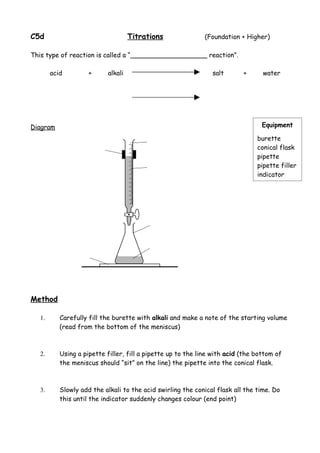
1. The equipment used including burettes, conical flasks, and indicators.
2. The method of slowly adding an alkali to an acid while swirling and monitoring the indicator until the endpoint is reached.
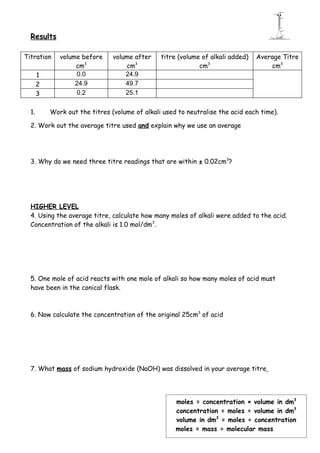
3. Calculations that can be done such as determining moles, concentration, and mass based on the titration results.
4. How a titration curve shows pH changing as a function of alkali added, with the endpoint at neutralization.