Download as PDF, PPTX
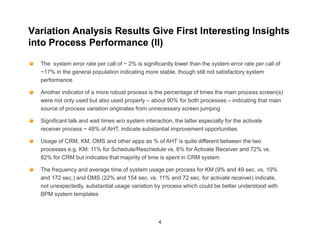
![Appendix: Detailed Clustering Results
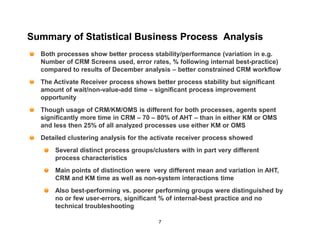
Cluster 4 Cluster 2 Cluster 3 Cluster 5 Cluster 1
Examples [ 62.8 %] 59 Examples [ 18.1 %] 17 Examples [ 8.5 %] 8 Examples [ 8.5 %] 8 Examples [ 2.1 %] 2
Attribute Description Test value Group Overall Attribute Description Test value Group Overall Attribute Description Test value Group Overall Attribute Description Test value Group Overall Attribute Description Test value Group Overall
Continuous attributes : Mean (StdDev) Continuous attributes : Mean (StdDev) Continuous attributes : Mean (StdDev) Continuous attributes : Mean (StdDev) Continuous attributes : Mean (StdDev)
Time in DORIS -1.95 4.44 (24.93) 13.34 (57.03) Time in RIO 5.95 829.94 (204.18) 430.65 (304.00) Time in other applications 8.65 227.25 (54.27) 26.03 (68.41) Time in OMS 8.19 50.75 (29.38) 4.64 (16.57) Time in DORIS 8.39 350.00 (155.56) 13.34 (57.03)
Talk/Wait time w/o system Talk/Wait time w/o system
Time in other applications -3.44 7.24 (21.95) 26.03 (68.41) Call duration 4.87 841.12 (203.17) 474.66 (341.04) 4.59 453.38 (313.41) 146.11 (197.10) 0.46 177.25 (99.41) 146.11 (197.10) Call duration 4.48 1549.50 (154.86) 474.66 (341.04)
interaction interaction
Talk/Wait time w/o system
Time in OMS -3.51 0.00 (0.00) 4.64 (16.57) 3.19 285.06 (236.57) 146.11 (197.10) Call duration 2.5 764.13 (489.49) 474.66 (341.04) Call duration 0.13 489.38 (195.14) 474.66 (341.04) Time in RIO 3.6 1199.50 (310.42) 430.65 (304.00)
interaction
Talk/Wait time w/o system Talk/Wait time w/o system
-5.6 58.02 (73.70) 146.11 (197.10) Time in DORIS -0.26 10.12 (20.71) 13.34 (57.03) Time in RIO 0.92 526.13 (460.92) 430.65 (304.00) Time in other applications -0.13 23.00 (65.05) 26.03 (68.41) 0.46 210.00 (296.98) 146.11 (197.10)
interaction interaction
Time in RIO -6.22 279.71 (116.72) 430.65 (304.00) Time in OMS -1.27 0.00 (0.00) 4.64 (16.57) Time in OMS -0.16 3.75 (10.61) 4.64 (16.57) Time in RIO -0.22 407.63 (185.11) 430.65 (304.00) Time in OMS -0.4 0.00 (0.00) 4.64 (16.57)
Call duration -6.73 291.39 (127.41) 474.66 (341.04) Time in other applications -1.65 1.06 (4.37) 26.03 (68.41) Time in DORIS -0.33 7.00 (14.71) 13.34 (57.03) Time in DORIS -0.28 8.00 (16.14) 13.34 (57.03) Time in other applications -0.54 0.00 (0.00) 26.03 (68.41)
Discrete attributes : [Recall] Accuracy Discrete attributes : [Recall] Accuracy Discrete attributes : [Recall] Accuracy Discrete attributes : [Recall] Accuracy Discrete attributes : [Recall] Accuracy
Was technical trouble- Was technical trouble- Was technical trouble- Was technical trouble-
Was there a system error
shooting necessary during 3.69 [ 73.9 %] 86.4 % 73.40% shooting necessary during 2.2 [ 37.5 %] 35.3 % 17.00% 3.28 [ 100.0 %] 12.5 % 1.10% shooting necessary during 2.58 [ 25.0 %] 50.0 % 17.00% shooting necessary during 1.95 [ 11.1 %] 50.0 % 9.60%
during the call?=Y
call?=N call?=Y call?=Y call?=Y
Was functionality of main Was technical trouble- Was functionality of main
Was there a system error Process followed best-
1.3 [ 63.4 %] 100.0 % 98.90% screen for process used as 0.96 [ 18.9 %] 100.0 % 95.70% shooting necessary during 1.6 [ 18.8 %] 37.5 % 17.00% screen for process used as 1.2 [ 25.0 %] 12.5 % 4.30% 1.25 [ 3.8 %] 100.0 % 56.40%
during the call?=N practice?=Y
intended?=Y call?=Y intended?=N
Request completed in
Was there a user error Was there a user error Process followed best- Was there a user error
0.82 [ 64.6 %] 86.4 % 84.00% 0.94 [ 26.7 %] 23.5 % 16.00% 1.12 [ 12.2 %] 62.5 % 43.60% screen designed for 0.62 [ 8.9 %] 100.0 % 95.70% 0.62 [ 2.5 %] 100.0 % 84.00%
during the call?=N during the call?=Y practice?=N during the call?=N
request?=Y
Request completed in
Process followed best- Process followed best- Was there a user error Process followed best-
0.74 [ 66.0 %] 59.3 % 56.40% 0.85 [ 22.0 %] 52.9 % 43.60% 0.73 [ 13.3 %] 25.0 % 16.00% 0.36 [ 9.4 %] 62.5 % 56.40% screen designed for 0.3 [ 2.2 %] 100.0 % 95.70%
practice?=Y practice?=N during the call?=Y practice?=Y
request?=Y
Request completed in Was functionality of main Was functionality of main
Was there a system error Was there a system error
screen designed for 0.51 [ 75.0 %] 5.1 % 4.30% 0.47 [ 18.3 %] 100.0 % 98.90% screen for process used as 0.62 [ 8.9 %] 100.0 % 95.70% 0.3 [ 8.6 %] 100.0 % 98.90% screen for process used as 0.3 [ 2.2 %] 100.0 % 95.70%
during the call?=N during the call?=N
request?=N intended?=Y intended?=Y
Was functionality of main Request completed in Request completed in
Was there a user error Was there a system error
screen for process used as 0.51 [ 75.0 %] 5.1 % 4.30% screen designed for 0.37 [ 25.0 %] 5.9 % 4.30% screen designed for 0.62 [ 8.9 %] 100.0 % 95.70% 0.28 [ 8.9 %] 87.5 % 84.00% 0.15 [ 2.2 %] 100.0 % 98.90%
during the call?=N during the call?=N
intended?=N request?=N request?=Y
Was technical trouble- Was technical trouble- Was technical trouble-
Was there a user error Was there a system error
shooting necessary during -0.47 [ 55.6 %] 8.5 % 9.60% shooting necessary during 0.34 [ 22.2 %] 11.8 % 9.60% shooting necessary during 0.29 [ 11.1 %] 12.5 % 9.60% -0.28 [ 6.7 %] 12.5 % 16.00% -0.15 [ 0.0 %] 0.0 % 1.10%
during the call?=Y during the call?=Y
call?=Y call?=Y call?=Y
Was functionality of main Request completed in Was functionality of main Was functionality of main
Was there a system error
screen for process used as -0.51 [ 62.2 %] 94.9 % 95.70% screen designed for -0.37 [ 17.8 %] 94.1 % 95.70% screen for process used as -0.62 [ 0.0 %] 0.0 % 4.30% -0.3 [ 0.0 %] 0.0 % 1.10% screen for process used as -0.3 [ 0.0 %] 0.0 % 4.30%
during the call?=Y
intended?=Y request?=Y intended?=N intended?=N
Request completed in Request completed in Request completed in
Was there a system error Process followed best-
screen designed for -0.51 [ 62.2 %] 94.9 % 95.70% -0.47 [ 0.0 %] 0.0 % 1.10% screen designed for -0.62 [ 0.0 %] 0.0 % 4.30% -0.36 [ 7.3 %] 37.5 % 43.60% screen designed for -0.3 [ 0.0 %] 0.0 % 4.30%
during the call?=Y practice?=N
request?=Y request?=N request?=N
Request completed in
Process followed best- Process followed best- Was there a user error Was there a user error
-0.74 [ 58.5 %] 40.7 % 43.60% -0.85 [ 15.1 %] 47.1 % 56.40% -0.73 [ 7.6 %] 75.0 % 84.00% screen designed for -0.62 [ 0.0 %] 0.0 % 4.30% -0.62 [ 0.0 %] 0.0 % 16.00%
practice?=N practice?=Y during the call?=N during the call?=Y
request?=N
Was technical trouble- Was technical trouble-
Was there a user error Was there a user error Process followed best-
-0.82 [ 53.3 %] 13.6 % 16.00% -0.94 [ 16.5 %] 76.5 % 84.00% -1.12 [ 5.7 %] 37.5 % 56.40% shooting necessary during -0.96 [ 0.0 %] 0.0 % 9.60% shooting necessary during -0.64 [ 0.0 %] 0.0 % 17.00%
during the call?=Y during the call?=N practice?=Y
call?=Y call?=Y
Was functionality of main Was technical trouble- Was functionality of main Was technical trouble-
Was there a system error
-1.3 [ 0.0 %] 0.0 % 1.10% screen for process used as -0.96 [ 0.0 %] 0.0 % 4.30% shooting necessary during -1.56 [ 5.8 %] 50.0 % 73.40% screen for process used as -1.2 [ 7.8 %] 87.5 % 95.70% shooting necessary during -0.75 [ 1.4 %] 50.0 % 73.40%
during the call?=Y
intended?=N call?=N intended?=Y call?=N
Was technical trouble- Was technical trouble- Was technical trouble-
Was there a system error Process followed best-
shooting necessary during -3.98 [ 18.8 %] 5.1 % 17.00% shooting necessary during -2.1 [ 13.0 %] 52.9 % 73.40% -3.28 [ 7.5 %] 87.5 % 98.90% shooting necessary during -1.56 [ 5.8 %] 50.0 % 73.40% -1.25 [ 0.0 %] 0.0 % 43.60%
during the call?=N practice?=N
call?=Y call?=N call?=N
8](https://image.slidesharecdn.com/businessprocessanalysisandoptimizationwithpredictiveanalyticscrmcasestudy-1334687987892-phpapp01-120417134427-phpapp01/85/Predictive-Analytics-Business-Process-Analysis-And-Optimization-a-CRM-Case-Study-8-320.jpg)

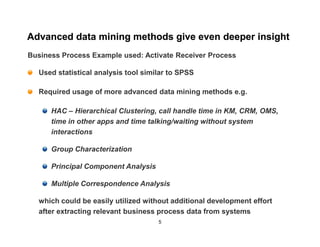
The document analyzes business process performance using statistical analytics, focusing on two CRM case studies: activating a receiver and rescheduling service calls. Key findings highlight significant variations in average handling times and screen usage, with implications for user and system error rates, revealing areas for process improvement. Advanced data mining methods provided detailed insights into process clustering, distinguishing between best and poorer performing groups based on workflow characteristics.