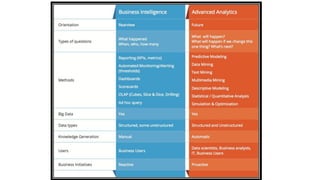
Module I
Business Intelligence - Definition, Need, Use & Components
Business Analytics – Introduction, Components, Types
Business Intelligence v/s Business Analytics
Transaction Processing v/s Analytic Processing
Business Intelligence
• Any business organization needs to continually monitor its business environment
and its own performance, and then rapidly adjust its future plans
• This includes monitoring the industry, the competitors, the suppliers, and the
customers
• Customized reports need to be designed to deliver the required information to every
executive.
• These reports can be converted into customized dashboards that deliver the
information rapidly and in easy-to grasp formats
Business Intelligence
• Business intelligence is a broad set of information technology (IT) solutions that includes tools for
gathering, analyzing, and reporting information to the users about performance of the organization and its
environment
• Consider a retail business chain that sells many kinds of goods and services around the world, online and in
physical stores.
• It generates data about sales, purchases, and expenses from multiple locations and time frames.
• Analyzing this data could help identify fast-selling items, regional-selling items, seasonal items,
fast-growing customer segments, and so on. It might also help generate ideas about what products sell
together, which people tend to buy which products, and so on.
• These insights and intelligence can help design better promotion plans, product bundles, and store layouts,
which in turn lead to a better-performing business.
Need for BI
• Helps the Leadership in making informed and better decisions
• Identifying new business opportunities & analysing gaps in the current
processes
• Helps in creating accurate reports by extracting data right from the data
source
• Saves time otherwise needed in organizing data manually
• Real time reporting for efficient management
• Helps in forecasting
Features of BI
Ranking
reports
What-If analysis
Executive
dashboards
Interactive reports
Geospatial
Mapping
Operational
reports
Open
Integration
Security features
Framework of BI
BI Components
Data
warehouse
Business
Analytics
Business
Performance
Management
User
Interface
Data Warehousing
• A data warehouse (DW) is an organized collection of integrated, subject oriented databases designed to
support decision support functions
• DW is organized at the right level of granularity to provide clean enterprise-wide data in a standardized
format for reports, queries, and analysis
• DW is physically and functionally separate from an operational and transactional database
• DW supports business reporting and data mining activities
• It can facilitate distributed access to up-to-date business knowledge for departments and functions, thus
improving business efficiency and customer service
• DW enables a consolidated view of corporate data, all cleaned and organized.
• DW thus provides better and timely information. It simplifies data access and allows end users to perform
extensive analysis.
Business Analytics
• Business analytics (BA) refers to the skills, technologies, and practices for continuous iterative
exploration and investigation of past business performance to gain insight and drive business
planning
• Business analytics focuses on developing new insights and understanding of business performance
based on data and statistical methods
• Business analytics makes extensive use of analytical modeling and numerical analysis, including
explanatory and predictive modeling, and fact-based management to drive decision making
• Business analytics can answer questions like why is this happening, what if these trends continue,
what will happen next (predict), and what is the best outcome that can happen (optimize)
• BI components include – Reporting and queries; Advanced Analytics; Data, Text and Web mining
Business Performance Management
• Business Performance Management (BPM), otherwise termed as Corporate Performance
Management (CPM) or Enterprise Performance Management, is tuned toward optimization of
overall business performance and achievement of business goals
• It enables an organization to enhance the management of their business performance through the
aid of reports, analytics, Key Performance Indicators, etc. that help them measure and monitor
efficiency and success of their business activities
• The optimisation of comprehensive performance of an organisation is the main aim of BPM
• BPM includes the following processes – Budgeting, Planning & Forecasting; Business Modeling;
Scorecard; Dashboarding; Financial, statutory & management reporting; Risk management;
Predictive analysis; Internal Controls
User Interface
• Various information is organised & presented in a manner which is
easy to understand with the help of a dashboard
• Various trends, exceptions & organisational performance measures
(KPIs) are presented by these dashboards
Dashboards
• It includes multidimensional cube presentations to Virtual reality
• It includes technology similar to Geographical Information Systems
Visualisation Tools
Working of BI
Advantages of BI
• Employees Authorisation
• Link various employees for competent & successful processing of data
• Ease of teamwork & allocation
• Communicating BI to entire organisation
• Evaluate & improve Inputs
• Improved association
• Reduced training requirements
• Ease of Reporting
Disadvantages of BI
• Lost of Historical data
• High Cost attached
• Difficulties in implementation
• Time consuming
• Data privacy issues
BI Applications
CRM
• Maximize the return on
marketing campaigns
• Improve customer
retention (churn analysis)
• Maximize customer value
(cross-, up-selling)
• Identify and delight
highly-valued customers
• Manage brand image
Healthcare and Wellness
• Diagnose disease in
patients
• Treatment effectiveness
• Wellness management
• Manage fraud and abuse
• Public health management
Education
• Student Enrolment
(Recruitment and
Retention)
• Course offerings
• Fund-raising from
Alumni and other donors
BI Applications
Retail
• Optimize inventory
levels at different
locations
• Improve store layout
and sales promotions
• Optimize logistics for
seasonal effects
• Minimize losses due to
limited shelf life
Banking
• Automate the loan
application process
• Detect fraudulent
transactions
• Maximize customer
value (cross-,
up-selling)
• Optimize cash
reserves with
forecasting
Financial Services
• Predict changes in
bond and stock prices
• Assess the effect of
events on market
movements
• Identify and prevent
fraudulent activities in
trading
BI Applications
Insurance
• Forecast claim costs for
better business planning
• Determine optimal rate
plans
• Optimize marketing to
specific customers
• Identify and prevent
fraudulent claim
activities
Manufacturing
• Discover novel patterns
to improve product
quality
• Predict/prevent
machinery failures
Telecom
• Churn management
• Marketing and product
creation
• Network failure
management
• Fraud Management
Business Analytics
• Business analytics (BA) is the iterative, methodical exploration of an organization's
data, with an emphasis on statistical analysis
• Business analytics is used by companies that use data-driven decision-making
• It makes extensive use of data, statistical and quantitative analysis, explanatory &
predictive modeling, and fact based management to drive decision making
• Analytics may be used as input for human decisions or may drive fully automated
decisions
Components of BA
Data
Aggregation
Data Mining
Association & Sequence
Identification
Text Mining
Forecasting
Predictive
Analytics
Optimisation
Data
Visualisation
Types & Techniques of BA
Descriptive Analytics
• Perhaps the most basic and still the most important and widely used kind of analytics is descriptive
analytics
• This deals which uncovering the truth regarding business by analyzing the historical data. A
number of factual information is revealed in this form of analytics
• This is where, the grouping of data, use of descriptive statistics, and a number of visualization
techniques come in handy
• Here for example, by finding frequency, mean, median, mode, maximum, minimum values of a
subject in different scenarios help in covering a lot of information
• This allows the leadership to understand what has happened until now and gives a brief glimpse of
what could happen next.
Types & Techniques of BA
Diagnostic Analytics
• This form of analytics deals with finding the reasons for whatever that has happened in the
business so far
• Methodologies such as Segmentation etc comes in handy where patterns are detected in the
data to give a better insight into the scenario in which the company is present
• For example, running analytics on the customer base of a company and identifying the
different types of customers the company has been dealing with and targeting the specific kind
of customers that might have been pulling back the companies’ growth.
Types & Techniques of BA
Predictive Analytics
• This is that branch of analytics that deals with the future.
• Here, again based on the historical data, a range of sophisticated statistical and machine learning methodologies are put to use to
understand what can happen in the future given certain conditions or the pace at which the current scenario is moving
• This is done by identifying patterns in the data, figuring out the important drivers and features, and finding its relation with the
objective that we are trying to predict
• In none of these methods, time is involved as when time gets involved then a particular kind of predictive analytics is performed
known as forecasting
• Forecasting refers to predicting a value over a fixed period of time where time also acts as a driver i.e. plays a role in deciding what the
predicted value is going to be in the output.
• Sometimes a very specific type of prediction is also performed such as Text Mining where texts are predicted to create products that
can aid the business operation and can help in increasing the profits
• In Predictive Analytics, advanced Machine Learning and Deep Learning algorithm are developed, and sometimes statistical models are
also created
Types & Techniques of BA
Prescriptive Analytics
• The most advanced form of analytics, here not only we try to predict but also try to find a course of
action that is best suited to reach the objective
• While predictable analytics provide us what will happen, prescriptive analytics provide us with the
answer on how to avoid the prediction (in the case the predicted output is something not in the interests
of the company)
• Different strategies are devised here and are put to use to check the different outcomes. This is where
optimization and simulation methodologies are put to use and compared to the previously mentioned
forms of analytics, this is a new and developing form of analytics
• Advanced Machine & Deep Learning methodologies are often used in this type of analytics that allows
us to create different scenarios and find the best course of action.
Important BA Tools
• SQL
– It is among the most important tool as SQL queries allow the user to easily filter out and create subsets of an otherwise large
dataset
– By having the relevant amount of data, the analyst can quickly start working on the cleaning of the data and then creating
models out of it
• Tableau/ QlikView/ PowerBI
– The most important tool for report generation through the means of visualization. Tableau allows the user to quickly create
interesting, complex, and detailed graphs that can magnify the impact of a report
– The good aspect of this tool is that it is easy to use and requires less data preparation in order to get the desired output.
• Birt
– Another useful report based tool allows us to create graphs and dashboards, however, it is relatively complex than tableau as the
user needs to have a decent knowledge of Java to make the most out of it.
Important BA Tools
• Python
– One of the most advanced tools, python allows the user to perform multiple things
– Python can be used to perform basic steps such as data cleaning to a complex aspect of analytics that includes the development of various
kinds of models.
– The development of highly complex machine learning and deep learning model is particularly effective through this tool. Python also allows
us to create reports and has libraries for visualization but it is up to the user to use them or use dedicated visualization tools
• R
– This statistical tool created “by the statisticians for the statisticians”, allows a business analyst to perform all the descriptive and inferential
statistics along with the development of statistical models
– If compared to python it has a bit of a steep learning curve but this eventually pays off as it has a large community of users and is respected in
the world of corporate as well as academia
• MS Excel
– One of the most basic yet widely used and effective tool
– The importance of MS Excel in the field of Business Analytics can be understood from realizing the difference between a sword and a needle
Important BA Tools
• SPSS Modeler(Clementine)
– A data mining tool by SPSS Inc. (IBM)
– Has an intuitive GUI & its point & click modelling capabilities are very comprehensive
• KXEN
– One of the few to drive automated Analytics
– Can work with very large amount of data
– Drawback is its complexity in understanding the results
• WEKA
– Waikato Environment for Knowledge Analysis is a popular machine learning software
– Its written in Java script & is an open source software
– It contains a GUI for interacting with data files & produces visual results & graphs
Advantages of BA
• Improving the decision making process
• Better alignment with strategy
• Realising cost efficiency
• Speeding up of decision making
• Improving competitiveness
• Synchronised financial and operational strategy
• Providing a single, unified view of enterprise information
• Potential increase in revenues
BI v/s BA
• While BI and BA serve similar purposes, and the terms may be used interchangeably, these
practices differ in their fundamental focus
• Business intelligence analytics focuses on descriptive analytics, combining data gathering, data
storage, and knowledge management with data analysis to evaluate past data and providing new
perspectives into currently known information
• Business analytics focuses on prescriptive analytics, using data mining, modelling, and machine
learning to determine the likelihood of future outcomes
• Essentially, business intelligence answers the questions, “What happened?” and “What needs to
change?” and business analytics answers the questions, “Why is this happening?”, “What if this
trend continues?”, “What will happen next?”, and “What will happen if we change something?”
Business analytics and business intelligence solutions tend to overlap in structure and purpose
BI v/s BA
• Lets take an example, you sell T-shirts through an online store. Business intelligence provides
helpful reports of the past and current state of your business. BI tells you that sales of your blue
hood T-Shirts have spiked in the past three weeks. As a result, you decide to make more blue hood
T-Shirts to keep up with demand
• Business analytics asks, “Why did sales of blue hood T-shirts spike?” By mining your website data,
you learn that a majority of traffic has come from a post by an actor who wore your T-shirt. This
insight helps you decide to send complimentary T-shirts to a few other prominent actors in the
vicinity for shoots
• You use the previous sales information to anticipate how many T-shirts you will need to make and
how much supplies you will need to order to keep up with demand if the actors were to share posts
while wearing your T-shirts
Module I.pptx.pdf

Module I.pptx.pdf

  • 1.
    Module I Business Intelligence- Definition, Need, Use & Components Business Analytics – Introduction, Components, Types Business Intelligence v/s Business Analytics Transaction Processing v/s Analytic Processing
  • 2.
    Business Intelligence • Anybusiness organization needs to continually monitor its business environment and its own performance, and then rapidly adjust its future plans • This includes monitoring the industry, the competitors, the suppliers, and the customers • Customized reports need to be designed to deliver the required information to every executive. • These reports can be converted into customized dashboards that deliver the information rapidly and in easy-to grasp formats
  • 3.
    Business Intelligence • Businessintelligence is a broad set of information technology (IT) solutions that includes tools for gathering, analyzing, and reporting information to the users about performance of the organization and its environment • Consider a retail business chain that sells many kinds of goods and services around the world, online and in physical stores. • It generates data about sales, purchases, and expenses from multiple locations and time frames. • Analyzing this data could help identify fast-selling items, regional-selling items, seasonal items, fast-growing customer segments, and so on. It might also help generate ideas about what products sell together, which people tend to buy which products, and so on. • These insights and intelligence can help design better promotion plans, product bundles, and store layouts, which in turn lead to a better-performing business.
  • 4.
    Need for BI •Helps the Leadership in making informed and better decisions • Identifying new business opportunities & analysing gaps in the current processes • Helps in creating accurate reports by extracting data right from the data source • Saves time otherwise needed in organizing data manually • Real time reporting for efficient management • Helps in forecasting
  • 5.
    Features of BI Ranking reports What-Ifanalysis Executive dashboards Interactive reports Geospatial Mapping Operational reports Open Integration Security features
  • 6.
  • 7.
  • 8.
    Data Warehousing • Adata warehouse (DW) is an organized collection of integrated, subject oriented databases designed to support decision support functions • DW is organized at the right level of granularity to provide clean enterprise-wide data in a standardized format for reports, queries, and analysis • DW is physically and functionally separate from an operational and transactional database • DW supports business reporting and data mining activities • It can facilitate distributed access to up-to-date business knowledge for departments and functions, thus improving business efficiency and customer service • DW enables a consolidated view of corporate data, all cleaned and organized. • DW thus provides better and timely information. It simplifies data access and allows end users to perform extensive analysis.
  • 9.
    Business Analytics • Businessanalytics (BA) refers to the skills, technologies, and practices for continuous iterative exploration and investigation of past business performance to gain insight and drive business planning • Business analytics focuses on developing new insights and understanding of business performance based on data and statistical methods • Business analytics makes extensive use of analytical modeling and numerical analysis, including explanatory and predictive modeling, and fact-based management to drive decision making • Business analytics can answer questions like why is this happening, what if these trends continue, what will happen next (predict), and what is the best outcome that can happen (optimize) • BI components include – Reporting and queries; Advanced Analytics; Data, Text and Web mining
  • 10.
    Business Performance Management •Business Performance Management (BPM), otherwise termed as Corporate Performance Management (CPM) or Enterprise Performance Management, is tuned toward optimization of overall business performance and achievement of business goals • It enables an organization to enhance the management of their business performance through the aid of reports, analytics, Key Performance Indicators, etc. that help them measure and monitor efficiency and success of their business activities • The optimisation of comprehensive performance of an organisation is the main aim of BPM • BPM includes the following processes – Budgeting, Planning & Forecasting; Business Modeling; Scorecard; Dashboarding; Financial, statutory & management reporting; Risk management; Predictive analysis; Internal Controls
  • 11.
    User Interface • Variousinformation is organised & presented in a manner which is easy to understand with the help of a dashboard • Various trends, exceptions & organisational performance measures (KPIs) are presented by these dashboards Dashboards • It includes multidimensional cube presentations to Virtual reality • It includes technology similar to Geographical Information Systems Visualisation Tools
  • 12.
  • 13.
    Advantages of BI •Employees Authorisation • Link various employees for competent & successful processing of data • Ease of teamwork & allocation • Communicating BI to entire organisation • Evaluate & improve Inputs • Improved association • Reduced training requirements • Ease of Reporting
  • 14.
    Disadvantages of BI •Lost of Historical data • High Cost attached • Difficulties in implementation • Time consuming • Data privacy issues
  • 15.
    BI Applications CRM • Maximizethe return on marketing campaigns • Improve customer retention (churn analysis) • Maximize customer value (cross-, up-selling) • Identify and delight highly-valued customers • Manage brand image Healthcare and Wellness • Diagnose disease in patients • Treatment effectiveness • Wellness management • Manage fraud and abuse • Public health management Education • Student Enrolment (Recruitment and Retention) • Course offerings • Fund-raising from Alumni and other donors
  • 16.
    BI Applications Retail • Optimizeinventory levels at different locations • Improve store layout and sales promotions • Optimize logistics for seasonal effects • Minimize losses due to limited shelf life Banking • Automate the loan application process • Detect fraudulent transactions • Maximize customer value (cross-, up-selling) • Optimize cash reserves with forecasting Financial Services • Predict changes in bond and stock prices • Assess the effect of events on market movements • Identify and prevent fraudulent activities in trading
  • 17.
    BI Applications Insurance • Forecastclaim costs for better business planning • Determine optimal rate plans • Optimize marketing to specific customers • Identify and prevent fraudulent claim activities Manufacturing • Discover novel patterns to improve product quality • Predict/prevent machinery failures Telecom • Churn management • Marketing and product creation • Network failure management • Fraud Management
  • 18.
    Business Analytics • Businessanalytics (BA) is the iterative, methodical exploration of an organization's data, with an emphasis on statistical analysis • Business analytics is used by companies that use data-driven decision-making • It makes extensive use of data, statistical and quantitative analysis, explanatory & predictive modeling, and fact based management to drive decision making • Analytics may be used as input for human decisions or may drive fully automated decisions
  • 19.
    Components of BA Data Aggregation DataMining Association & Sequence Identification Text Mining Forecasting Predictive Analytics Optimisation Data Visualisation
  • 20.
    Types & Techniquesof BA Descriptive Analytics • Perhaps the most basic and still the most important and widely used kind of analytics is descriptive analytics • This deals which uncovering the truth regarding business by analyzing the historical data. A number of factual information is revealed in this form of analytics • This is where, the grouping of data, use of descriptive statistics, and a number of visualization techniques come in handy • Here for example, by finding frequency, mean, median, mode, maximum, minimum values of a subject in different scenarios help in covering a lot of information • This allows the leadership to understand what has happened until now and gives a brief glimpse of what could happen next.
  • 21.
    Types & Techniquesof BA Diagnostic Analytics • This form of analytics deals with finding the reasons for whatever that has happened in the business so far • Methodologies such as Segmentation etc comes in handy where patterns are detected in the data to give a better insight into the scenario in which the company is present • For example, running analytics on the customer base of a company and identifying the different types of customers the company has been dealing with and targeting the specific kind of customers that might have been pulling back the companies’ growth.
  • 22.
    Types & Techniquesof BA Predictive Analytics • This is that branch of analytics that deals with the future. • Here, again based on the historical data, a range of sophisticated statistical and machine learning methodologies are put to use to understand what can happen in the future given certain conditions or the pace at which the current scenario is moving • This is done by identifying patterns in the data, figuring out the important drivers and features, and finding its relation with the objective that we are trying to predict • In none of these methods, time is involved as when time gets involved then a particular kind of predictive analytics is performed known as forecasting • Forecasting refers to predicting a value over a fixed period of time where time also acts as a driver i.e. plays a role in deciding what the predicted value is going to be in the output. • Sometimes a very specific type of prediction is also performed such as Text Mining where texts are predicted to create products that can aid the business operation and can help in increasing the profits • In Predictive Analytics, advanced Machine Learning and Deep Learning algorithm are developed, and sometimes statistical models are also created
  • 23.
    Types & Techniquesof BA Prescriptive Analytics • The most advanced form of analytics, here not only we try to predict but also try to find a course of action that is best suited to reach the objective • While predictable analytics provide us what will happen, prescriptive analytics provide us with the answer on how to avoid the prediction (in the case the predicted output is something not in the interests of the company) • Different strategies are devised here and are put to use to check the different outcomes. This is where optimization and simulation methodologies are put to use and compared to the previously mentioned forms of analytics, this is a new and developing form of analytics • Advanced Machine & Deep Learning methodologies are often used in this type of analytics that allows us to create different scenarios and find the best course of action.
  • 24.
    Important BA Tools •SQL – It is among the most important tool as SQL queries allow the user to easily filter out and create subsets of an otherwise large dataset – By having the relevant amount of data, the analyst can quickly start working on the cleaning of the data and then creating models out of it • Tableau/ QlikView/ PowerBI – The most important tool for report generation through the means of visualization. Tableau allows the user to quickly create interesting, complex, and detailed graphs that can magnify the impact of a report – The good aspect of this tool is that it is easy to use and requires less data preparation in order to get the desired output. • Birt – Another useful report based tool allows us to create graphs and dashboards, however, it is relatively complex than tableau as the user needs to have a decent knowledge of Java to make the most out of it.
  • 25.
    Important BA Tools •Python – One of the most advanced tools, python allows the user to perform multiple things – Python can be used to perform basic steps such as data cleaning to a complex aspect of analytics that includes the development of various kinds of models. – The development of highly complex machine learning and deep learning model is particularly effective through this tool. Python also allows us to create reports and has libraries for visualization but it is up to the user to use them or use dedicated visualization tools • R – This statistical tool created “by the statisticians for the statisticians”, allows a business analyst to perform all the descriptive and inferential statistics along with the development of statistical models – If compared to python it has a bit of a steep learning curve but this eventually pays off as it has a large community of users and is respected in the world of corporate as well as academia • MS Excel – One of the most basic yet widely used and effective tool – The importance of MS Excel in the field of Business Analytics can be understood from realizing the difference between a sword and a needle
  • 26.
    Important BA Tools •SPSS Modeler(Clementine) – A data mining tool by SPSS Inc. (IBM) – Has an intuitive GUI & its point & click modelling capabilities are very comprehensive • KXEN – One of the few to drive automated Analytics – Can work with very large amount of data – Drawback is its complexity in understanding the results • WEKA – Waikato Environment for Knowledge Analysis is a popular machine learning software – Its written in Java script & is an open source software – It contains a GUI for interacting with data files & produces visual results & graphs
  • 28.
    Advantages of BA •Improving the decision making process • Better alignment with strategy • Realising cost efficiency • Speeding up of decision making • Improving competitiveness • Synchronised financial and operational strategy • Providing a single, unified view of enterprise information • Potential increase in revenues
  • 29.
    BI v/s BA •While BI and BA serve similar purposes, and the terms may be used interchangeably, these practices differ in their fundamental focus • Business intelligence analytics focuses on descriptive analytics, combining data gathering, data storage, and knowledge management with data analysis to evaluate past data and providing new perspectives into currently known information • Business analytics focuses on prescriptive analytics, using data mining, modelling, and machine learning to determine the likelihood of future outcomes • Essentially, business intelligence answers the questions, “What happened?” and “What needs to change?” and business analytics answers the questions, “Why is this happening?”, “What if this trend continues?”, “What will happen next?”, and “What will happen if we change something?” Business analytics and business intelligence solutions tend to overlap in structure and purpose
  • 30.
    BI v/s BA •Lets take an example, you sell T-shirts through an online store. Business intelligence provides helpful reports of the past and current state of your business. BI tells you that sales of your blue hood T-Shirts have spiked in the past three weeks. As a result, you decide to make more blue hood T-Shirts to keep up with demand • Business analytics asks, “Why did sales of blue hood T-shirts spike?” By mining your website data, you learn that a majority of traffic has come from a post by an actor who wore your T-shirt. This insight helps you decide to send complimentary T-shirts to a few other prominent actors in the vicinity for shoots • You use the previous sales information to anticipate how many T-shirts you will need to make and how much supplies you will need to order to keep up with demand if the actors were to share posts while wearing your T-shirts