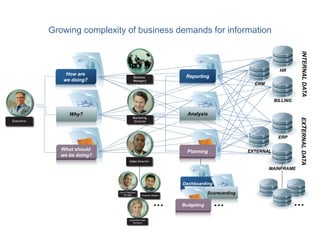
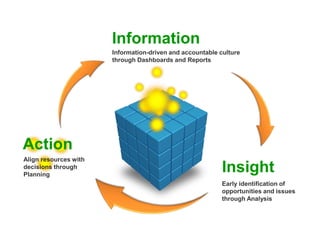
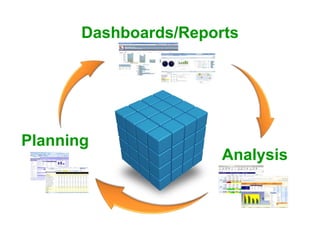
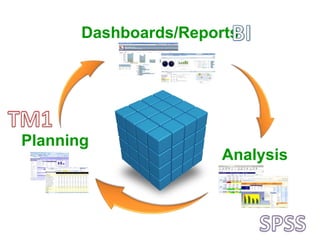
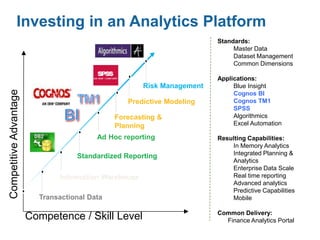
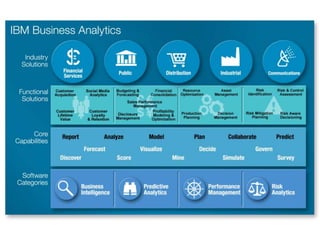
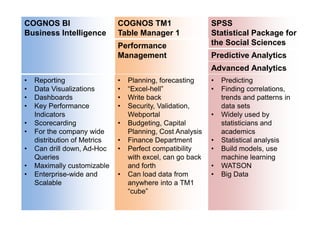
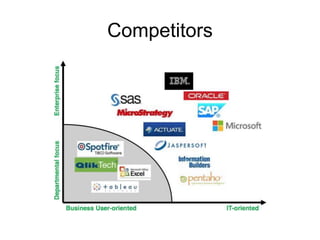
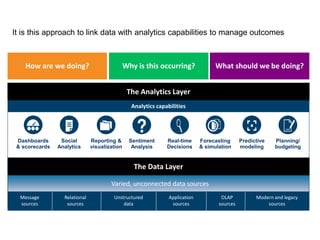
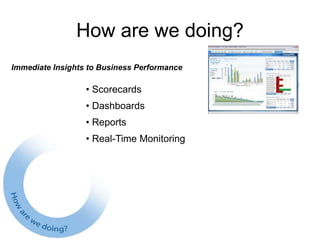
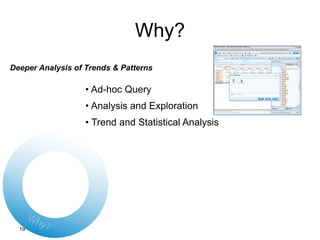
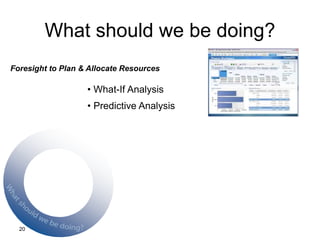
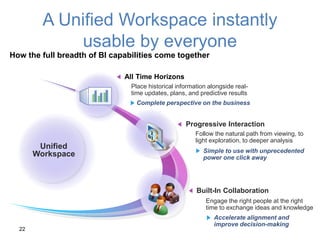
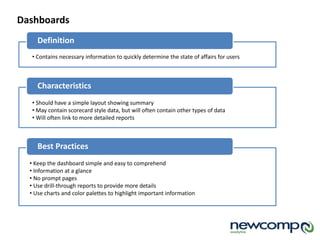
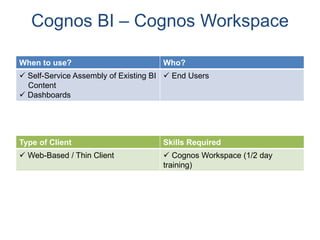
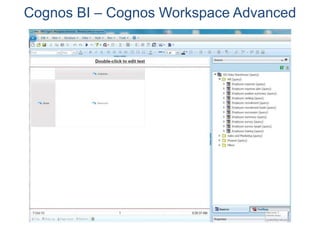
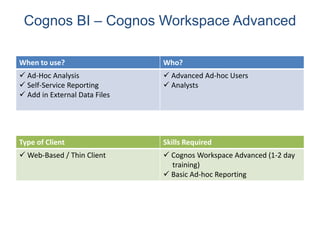
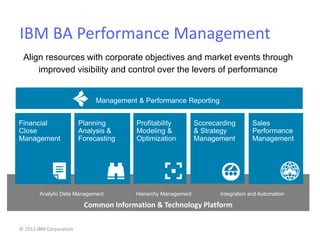
IBM
Business Analytics Portfolio
Presented by:
Natalija Pavic, Account Manager
647 678 5907, npavic@newcomp.com
Growing complexity of business demands for information
Why?
How are
we doing?
What should
we be doing?
…
Analysis
Reporting
Planning
INTERNALDATAEXTERNALDATA
ERP
MAINFRAME
EXTERNAL
BILLING
HR
CRM
…
Dashboarding
Scorecarding
Budgeting …
Information
Information-driven and accountable culture
through Dashboards and Reports
Insight
Early identification of
opportunities and issues
through Analysis
Action
Align resources with
decisions through
Planning
Planning
Analysis
Dashboards/Reports
Planning
Analysis
Dashboards/Reports
Relevant
Information
Actionable
Insights
Smarter
Decisions
Better
Outcomes
Business
Analytics
Investing in an Analytics Platform
Risk Management
Competence / Skill Level
CompetitiveAdvantage
Transactional Data
Forecasting &
Planning
Ad Hoc reporting
Information Warehouse
Standardized Reporting
Predictive Modeling
Standards:
Master Data
Dataset Management
Common Dimensions
Applications:
Blue Insight
Cognos BI
Cognos TM1
SPSS
Algorithmics
Excel Automation
Resulting Capabilities:
In Memory Analytics
Integrated Planning &
Analytics
Enterprise Data Scale
Real time reporting
Advanced analytics
Predictive Capabilities
Mobile
Common Delivery:
Finance Analytics Portal
The Business Analytics “Stack”
Degree of Complexity
ValueandOperationalExcellence
Standard Reporting
Ad hoc reporting
Query/drill down
Alerts
Simulation
Forecasting
Predictive modeling
Optimization
What exactly is the problem?
What will happen next if ?
What if these trends continue?
What could happen…. ?
What actions are needed?
How many, how often, where?
What happened?
Stochastic Optimization
Based on: Competing on Analytics, Davenport and Harris, 2007
COGNOS BI
Business Intelligence
COGNOS TM1
Table Manager 1
SPSS
Statistical Package for
the Social SciencesPerformance
Management Predictive Analytics
Advanced Analytics
• Reporting
• Data Visualizations
• Dashboards
• Key Performance
Indicators
• Scorecarding
• For the company wide
distribution of Metrics
• Can drill down, Ad-Hoc
Queries
• Maximally customizable
• Enterprise-wide and
Scalable
• Planning, forecasting
• “Excel-hell”
• Write back
• Security, Validation,
Webportal
• Budgeting, Capital
Planning, Cost Analysis
• Finance Department
• Perfect compatibility
with excel, can go back
and forth
• Can load data from
anywhere into a TM1
“cube”
• Predicting
• Finding correlations,
trends and patterns in
data sets
• Widely used by
statisticians and
academics
• Statistical analysis
• Build models, use
machine learning
• WATSON
• Big Data
BI TM1 SPSS
• Maximally customizable
• Compatible with all data
• Report creation abilities
not existent with
competitors
• Visualizations are not
the best when
comparing to Tableau or
QlickTek
• Resiliant to scalability,
enterprise ready
• Deep integration with
other IBM products for
the whole stack
• Maximally customizable
• Compatible with all data
• The only software to
have a smooth
transition from and to
excel
• Looks like excel so
friendly for excel users
• Manipulate multiple
datasets easily – true
sandbox
• Can be used by
different departments
for different purposes
• Powerful consolidation
of data
• User-friendly
• Easy to use
• Makes powerful
statistical tools
accessible to a more
commercial user
• Does not compete with
Oracle
• SAP cannot compete
with it yet
• Can be used as a single
user licence by one
user on a desktop
Competitive Comparisons
Competitors
It is this approach to link data with analytics capabilities to manage outcomes
How are we doing? Why is this occurring? What should we be doing?
Dashboards
& scorecards
Social
Analytics
Reporting &
visualization
Sentiment
Analysis
Real-time
Decisions
Predictive
modeling
Forecasting
& simulation
Planning/
budgeting
Analytics capabilities
Message
sources
Relational
sources
Application
sources
OLAP
sources
Modern and legacy
sources
Unstructured
data
Varied, unconnected data sources
The Data Layer
The Analytics Layer
18
How are we doing?
Immediate Insights to Business Performance
• Scorecards
• Dashboards
• Reports
• Real-Time Monitoring
19
Why?
Deeper Analysis of Trends & Patterns
• Ad-hoc Query
• Analysis and Exploration
• Trend and Statistical Analysis
20
What should we be doing?
Foresight to Plan & Allocate Resources
• What-If Analysis
• Predictive Analysis
IBM COGNOS BI
Business Intelligence
22
A Unified Workspace instantly
usable by everyone
Built-In Collaboration
Progressive Interaction
How the full breadth of BI capabilities come together
All Time Horizons
Unified
Workspace
Complete perspective on the business
Simple to use with unprecedented
power one click away
Place historical information alongside real-
time updates, plans, and predictive results
Follow the natural path from viewing, to
light exploration, to deeper analysis
Engage the right people at the right
time to exchange ideas and knowledge
Accelerate alignment and
improve decision-making
Definition
Dashboards
• Contains necessary information to quickly determine the state of affairs for users
Characteristics
• Should have a simple layout showing summary
• May contain scorecard style data, but will often contain other types of data
• Will often link to more detailed reports
Best Practices
• Keep the dashboard simple and easy to comprehend
• Information at a glance
• No prompt pages
• Use drill-through reports to provide more details
• Use charts and color palettes to highlight important information
Definition
Interactive Reports
• Used to support daily decision making
Characteristics
• Fast to load
• Information at a glance
• Easily move from one report to another using drill-through links
Best Practices
• Show only the information needed
• Be conscious of the limited display area
• Avoid `next page`
• Avoid horizontal scrolling
• Minimize vertical scrolling
• Use prompting to limit data or to change layout
Definition
Active Reports
• Used for High level summarized data
• Interactive graphic rich format
• Offline (runs disconnected from Cognos server)
Characteristics
• Meant for `Presentation` type of data
• Package in one file
Best Practices
• Complete requirements are essential
• Design for a specific interface (iPad, Android devices..)
• Graphic Design mentality required
• Story boards, PowerPoint mock ups
• Pay attention to file sizes
Drag-and-drop data,
smart filters, and
intuitive analysis
Modify plans,
budgets, and
forecasts
accordingly
Exchange files
or publish
and extend within
the Cognos Family
Add compelling
visuals, widgets
and themes
Insight to Action
Model scenarios,
test assumptions,
and optimize
Model scenarios,
test assumptions,
and optimize
Cognos Insight
Cognos Insight
Cognos Insight
When to use? Who?
 Personal Desktop Analytics
 Prototyping
 Ad-Hoc Analysis
 Workflow Application Design
 What-if Analysis
 “Throw-away” Analysis
 Data Analysts
 Workflow Contributors
Type of Client Skills Required
 Thick Client
 Can be launched from the Web
 Minimal Training Required (1-2
days)
 Knowledge of Data
Cognos BI – Report Studio
When to use? Who?
 Pixel-Perfect Reports
 Emailed Reports
 Scheduled Reports
 Report Authors
Type of Client Skills Required
 Web-Based / Thin Client  Report Studio
Cognos BI – Active Reports
Cognos BI - Mobile
Cognos BI – Active Reports & Mobile
When to use? Who?
 Mobile Device
 Online or Offline
 End Users
Type of Client Skills Required
 Web-Based (Mobile Browser)
 Native iPad or Android App
 None
Cognos BI – Cognos Workspace
When to use? Who?
 Self-Service Assembly of Existing BI
Content
 Dashboards
 End Users
Type of Client Skills Required
 Web-Based / Thin Client  Cognos Workspace (1/2 day
training)
Cognos BI – Cognos Workspace Advanced
When to use? Who?
 Ad-Hoc Analysis
 Self-Service Reporting
 Add in External Data Files
 Advanced Ad-hoc Users
 Analysts
Type of Client Skills Required
 Web-Based / Thin Client  Cognos Workspace Advanced (1-2 day
training)
 Basic Ad-hoc Reporting
IBM COGNOS TM1
Table Manager 1
Performance Management
© 2012 IBM Corporation
Common Information & Technology Platform
IBM BA Performance Management
Profitability
Modeling &
Optimization
Management & Performance Reporting
Scorecarding
& Strategy
Management
Financial
Close
Management
Sales
Performance
Management
Integration and AutomationHierarchy ManagementAnalytic Data Management
Planning
Analysis &
Forecasting
Align resources with corporate objectives and market events through
improved visibility and control over the levers of performance
Finance IT
Human
Resources Sales Marketing
Customer
ServiceOperations
Product
Development
Performance Management
Finance Operations Sales / Customer
Account
Analysis
&
Close
Financial
Consol
Reporting
&
Analysis
Disclosure
Mgmt
&
XBRL
Sales and
Ops
Planning
Capital
Expend.
Planning
Product
Profitability
Incentive
Comp
Mgmt
Quota
Planning
Territory &
Channel
Mgmt
Planning
Analysis &
Forecasting
Profitability
Modeling &
Optimization
Performance
Reporting &
Scorecarding
Governance, Risk, and Compliance Industry Specific Blueprints Industry Specific Blueprints
41
IBM BA Performance Management Solutions
© 2012 IBM Corporation
Key Contacts For Performance
Management
WHO MAIN CONCERNS
CFO  Accountability & Timeliness
 Integration across all LoBs
 Insightful Info to drive business
VP Planning  Accuracy, Forecast/Actual deltas
 Frequency of collection
 Amount of detail, value of info
Controller  Accuracy
 Adequate Controls
 Flexibility to react
Accounting/Finance Manager  Time spent collating
 No time to check, value add activity
 Evenings and weekend work
CIO / IT  Audit, Controls, IT Standards
 Finance system integration
 Reporting & Data management
VP Sales  Territory Planning challenges
 Complex Compensation plans
 Integration w/ Finance
IBM BA Performance Management – Better
Outcomes
Drive efficiencies and scale
• Eliminate intensely manual efforts
• Structure and automate dynamic processes
• Scale to large user communities and data sets
Gain agility and preparedness
• Link operational and financial performance management
• Support advanced analytic techniques (e.g., scenario
• and predictive analytics, narrative performance reporting)
• Eliminate delays in coordinating around emerging realities
Improve effectiveness and outcomes
• Dramatically reduce risk of errors
• Cost-effectively address compliance
• Drive new confidence in analytics-driven decision making
Confidence
Control
Time
What is TM1?
 Created in 1984
 64-bit In-Memory OLAP Database
 Designed for Writeback
 Supports Real-Time Calculations
 Secure and Centralized
 Integrated with Excel, Cognos BI
IBM Cognos TM1 Solutions
 Compensation Management
 Sales Performance Management
 Staffing Optimization
 Training Certification
 Intranet Employee Portal
 Retail Sales Analysis
 New Product Planning
 Customer Profitability
 Customer Churn Analysis
 Financial Consolidations
 Financial Reporting
 Planning
 Driver Based Budgeting
 Rolling Forecasts
 Risk Analysis
 Demand Analysis
 Inventory Optimization
 Logistics Planning
 Product Profitability
 Production Planning
Financial Operations
Workforce Customer
Complete Performance Management Applications
• Read/Write Planning & What-If
• Ad Hoc Analysis and Formatted Reporting
TM1 Terminology
 Dimension – A collection of Elements and their relationships
to one another (e.g. Chart of Accounts).
 Cube – A collection of dimensions whose intersections (cells)
store data (e.g. Sales).
 Element – A single member within a dimension (e.g. one
account from the Chart of Accounts).
 Attribute – A piece of information that describes an element
(e.g. an inactive flag on an account).
 Subset – A Subset of Elements within a Dimension (e.g. all
revenue accounts)
 Rule – A formula that describes business logic
 Process – An ETL script that can import, export, and
transform data.
TM1 Interfaces
 TM1 Applications / Workflow
 Cognos Insight
 TM1 Perspectives (Excel Add-In)
 TM1 Web
 TM1 Architect
 Performance Modeler
 Cognos BI
TM1 Applications / Workflow
When to use? Who?
 Data input
 Approvals and Rejections
 Email Notification
 Status Reporting
 End Users in a Workflow Process
Type of Client Skills Required
 Web-based / Thin Client for End Users
 Performance Modeler for Admin
 None
TM1 Web
TM1 Web
When to use? Who?
 Data Input
 Ad-Hoc Analysis
 Reporting
 End Users
 Power Users
Type of Client Skills Required
 Web-Based / Thin Client  None
TM1 Perspectives (Excel Add-In)
When to use? Who?
 Template and Report Creation
 Data Input
 Reporting
 Template Authors
 End Users
 Power Users
Type of Client Skills Required
 Excel Add-In
 Requires Client Installation
 Excel
CAFÉ (Excel Add-In)
Cognos Analysis for Excel
CAFÉ (Excel Add-In)
CAFÉ (Excel Add-In)
When to use? Who?
 Ad-Hoc Analysis
 Slice and Dice
 Data Entry
 End Users
 Power Users
Type of Client Skills Required
 Excel Add-In
 Requires Client Installation
 Excel
TM1 Architect
TM1 Architect
When to use? Who?
 Modeling
 Importing and Exporting Data
 Managing Security
 Modelers
 Administrators
Type of Client Skills Required
 Thick Client - Windows
 Requires Client Installation
 TM1 Modeling
Performance Modeler
Performance Modeler
When to use? Who?
 Modeling
 Importing and Exporting Data
 Managing Security
 Workflow Application Design
 Modelers
 Administrators
Type of Client Skills Required
 Thick Client
 Can be launched from the Web
 TM1 Modeling
CUSTOMER
EXPERIENCE
THE DATA-DRIVEN
Selling SPSS:
What does SPSS stand for?
Statistical. Package. for the Social. Sciences.
What does SPSS stand for?
Statistical. Package. for the Social. Sciences.
It should be SPFC:
Solving. Problems. For. Customers.
Purpose
• Introduce focus on
Customer Experience
• Spin the SPSS story
from the Customer
Experience perspective
• Organize SPSS
solutions into the
customer experience
theme
• Define Predictive
Analytics (PA) market
Studies have shown that the objects people chose to surround
themselves with are indicative of their personalities.
Gosling, Sam. Snoop: What Your Stuff Says About You. New York: Basic, 2008. Print.
PERCEPTION. IS. REALITY.
Questions to answer:
• How can we use data to alter the customer
experience?
• How does data impact brand perception?
• How do customer interact with data?
• How is data integrated in the shopping
experience?
OF CUSTOMERS’
EVERYDAY POTENTIAL
INTERACTION WITH AN
ORGANIZATION’S DATA
EXAMPLE
Meet Henry Hipster
• Received phone calls at 8pm
• Bank selling him accounts he has
• Service provider can’t remember him
• Customer service reps annoy him
• Receives Junk Mail
• Mailbox filled with SPAM
NOW
• No-logo philosophy
• Obscure bands
• Whole-foods
• Hipster
Meet Serene Serena
• Trip to Bahamas
• Coupons on the way
• Exclusive product launches
• No problems with service provider
• Pizza remembers favorite order
• Issues resolved in advance
• Receives messages she wants
NOW
• Blogger
• Superstar
• Fan base
• Lucky
Meet Serene Serena
• Trip to Bahamas
• Coupons on the way
• Exclusive product launches
• No problems with service provider
• Pizza remembers favorite order
• Issues resolved in advance
• Receives messages she wants
NOW
• Blogger
• Superstar
• Fan base
• Lucky
By effectively analyzing and
utilizing:
Sell the SPSS solution
as a data-centric way to
improve the customer
experience.
What is the Data-Driven Customer Experience?
Using data, data mining methods, and predictive
analytics to:
• Create the best buying environment for your
customers.
• Facilitate communication with your customers
that is effective and consistent.
• Anticipate and predict customer needs.
Using data to improve the customer
experience by focusing on…
Buying Environment
Communication
Customer Needs
Categorizing and
grouping SPSS solutions
thematically so they are
relevant to Enterprises.
Buying
Environment
Digital
Optimization
Preventing
Fraud/Theft
Targeted
Advertising
Market
Basket
Analysis
Buying
Environment
Digital Optimization
Creating a better user
interface that improves the
sales funnel.
Preventing
Fraud/Theft
Creating a safe
environment for
customers that
encourages
spending.
Targeted Advertising
Creating personalized
message and content to
increase impact.
Market Basket
Analysis
Grouping relevant
items to facilitate
increasing the single
purchase price.
.
Communication
Customer
Segmentation
Targeted
Marketing
Text
Analytics
Churn
Analytics
Communication
Customer Segmentation
Understanding customer micro-
niches to better align products
with customer interests
Targeted Marketing
Sending customers
they want to see in
their preferred
deliver methods to
increase
engagement.
Text Analytics
Understanding customer
sentiment in free form text to
create an informed
communication strategy.
Churn Analytics
Identify
customers at risk
of leaving to
resolve customer
issues faster.
.
Customer
Needs
Recommendation
Engine
Promotional
Analytics
Store
Planning
Merchandising
Analytics
Customer
Needs
Recommendation Engine
Making targeted recommendations to
facilitate customers finding what they
are looking for.
Promotional
Analytics
Identifying ROI for
promotions in order
to continue offering
customer discounts.
Store Planning
Identifying new markets in order to
provide services to new potential
customers.
Merchandising
Analytics
Anticipating demand
in order to stock
inventory levels
appropriately.
.
Buying
Environment
Communication Customer
Needs
Digital Optimization
Preventing
Fraud/Theft
Targeted
Advertising
Market Basket
Analysis
Customer
Segmentation
Targeted
Marketing
Text Analytics
Churn Analytics
Recommendation
Engine
Promotional
Analytics
Store Planning
Merchandising
Analytics
Summary Reference Tables of SPSS Solutions Categories
Big Data Analytics Market Size by
Business Category
Big Data Analytics Market Size by
Business Category
Most Opportunity for Analysis
Gartner Report
Predictive Analytics Market – Global Industry
Analysis from Transparency Market Research
• PA predicted to grow from $2.08B today to $6.54B
in 2019 globally
• Banking, FinServ, Insurance sectors largest market
share
• Retail and manufacturing expected to grow faster
than any other segment
• Fast growing consumer driven digital data
• Need to extract strategically critical information
• Rise in fraud, payment defaults, over or under stock
inventory levels, stringent regulations
Predictive Analytics Market – Global Industry
Analysis from Transparency Market Research
• Companies to adopt predictive models to gain
futuristic insights
• Leading segments: customer intelligence, fraud
and security, campaign management –
accounted for 50% market revenue 2012
• Target Departments: sales and marketing,
customer and channel management, operations
and workforce management, finance and risk
management.
• Finance and Risk 40.9% of revenue share in
2012.
QUESTION
S?
THANK YOU

Business Analytics Training

  • 1.
    IBM Business Analytics Portfolio Presentedby: Natalija Pavic, Account Manager 647 678 5907, npavic@newcomp.com
  • 2.
    Growing complexity ofbusiness demands for information Why? How are we doing? What should we be doing? … Analysis Reporting Planning INTERNALDATAEXTERNALDATA ERP MAINFRAME EXTERNAL BILLING HR CRM … Dashboarding Scorecarding Budgeting …
  • 4.
    Information Information-driven and accountableculture through Dashboards and Reports Insight Early identification of opportunities and issues through Analysis Action Align resources with decisions through Planning
  • 5.
  • 6.
  • 7.
  • 8.
    Investing in anAnalytics Platform Risk Management Competence / Skill Level CompetitiveAdvantage Transactional Data Forecasting & Planning Ad Hoc reporting Information Warehouse Standardized Reporting Predictive Modeling Standards: Master Data Dataset Management Common Dimensions Applications: Blue Insight Cognos BI Cognos TM1 SPSS Algorithmics Excel Automation Resulting Capabilities: In Memory Analytics Integrated Planning & Analytics Enterprise Data Scale Real time reporting Advanced analytics Predictive Capabilities Mobile Common Delivery: Finance Analytics Portal
  • 10.
    The Business Analytics“Stack” Degree of Complexity ValueandOperationalExcellence Standard Reporting Ad hoc reporting Query/drill down Alerts Simulation Forecasting Predictive modeling Optimization What exactly is the problem? What will happen next if ? What if these trends continue? What could happen…. ? What actions are needed? How many, how often, where? What happened? Stochastic Optimization Based on: Competing on Analytics, Davenport and Harris, 2007
  • 11.
    COGNOS BI Business Intelligence COGNOSTM1 Table Manager 1 SPSS Statistical Package for the Social SciencesPerformance Management Predictive Analytics Advanced Analytics • Reporting • Data Visualizations • Dashboards • Key Performance Indicators • Scorecarding • For the company wide distribution of Metrics • Can drill down, Ad-Hoc Queries • Maximally customizable • Enterprise-wide and Scalable • Planning, forecasting • “Excel-hell” • Write back • Security, Validation, Webportal • Budgeting, Capital Planning, Cost Analysis • Finance Department • Perfect compatibility with excel, can go back and forth • Can load data from anywhere into a TM1 “cube” • Predicting • Finding correlations, trends and patterns in data sets • Widely used by statisticians and academics • Statistical analysis • Build models, use machine learning • WATSON • Big Data
  • 12.
    BI TM1 SPSS •Maximally customizable • Compatible with all data • Report creation abilities not existent with competitors • Visualizations are not the best when comparing to Tableau or QlickTek • Resiliant to scalability, enterprise ready • Deep integration with other IBM products for the whole stack • Maximally customizable • Compatible with all data • The only software to have a smooth transition from and to excel • Looks like excel so friendly for excel users • Manipulate multiple datasets easily – true sandbox • Can be used by different departments for different purposes • Powerful consolidation of data • User-friendly • Easy to use • Makes powerful statistical tools accessible to a more commercial user • Does not compete with Oracle • SAP cannot compete with it yet • Can be used as a single user licence by one user on a desktop Competitive Comparisons
  • 13.
  • 14.
    It is thisapproach to link data with analytics capabilities to manage outcomes How are we doing? Why is this occurring? What should we be doing? Dashboards & scorecards Social Analytics Reporting & visualization Sentiment Analysis Real-time Decisions Predictive modeling Forecasting & simulation Planning/ budgeting Analytics capabilities Message sources Relational sources Application sources OLAP sources Modern and legacy sources Unstructured data Varied, unconnected data sources The Data Layer The Analytics Layer
  • 15.
    18 How are wedoing? Immediate Insights to Business Performance • Scorecards • Dashboards • Reports • Real-Time Monitoring
  • 16.
    19 Why? Deeper Analysis ofTrends & Patterns • Ad-hoc Query • Analysis and Exploration • Trend and Statistical Analysis
  • 17.
    20 What should webe doing? Foresight to Plan & Allocate Resources • What-If Analysis • Predictive Analysis
  • 18.
  • 19.
    22 A Unified Workspaceinstantly usable by everyone Built-In Collaboration Progressive Interaction How the full breadth of BI capabilities come together All Time Horizons Unified Workspace Complete perspective on the business Simple to use with unprecedented power one click away Place historical information alongside real- time updates, plans, and predictive results Follow the natural path from viewing, to light exploration, to deeper analysis Engage the right people at the right time to exchange ideas and knowledge Accelerate alignment and improve decision-making
  • 20.
    Definition Dashboards • Contains necessaryinformation to quickly determine the state of affairs for users Characteristics • Should have a simple layout showing summary • May contain scorecard style data, but will often contain other types of data • Will often link to more detailed reports Best Practices • Keep the dashboard simple and easy to comprehend • Information at a glance • No prompt pages • Use drill-through reports to provide more details • Use charts and color palettes to highlight important information
  • 21.
    Definition Interactive Reports • Usedto support daily decision making Characteristics • Fast to load • Information at a glance • Easily move from one report to another using drill-through links Best Practices • Show only the information needed • Be conscious of the limited display area • Avoid `next page` • Avoid horizontal scrolling • Minimize vertical scrolling • Use prompting to limit data or to change layout
  • 22.
    Definition Active Reports • Usedfor High level summarized data • Interactive graphic rich format • Offline (runs disconnected from Cognos server) Characteristics • Meant for `Presentation` type of data • Package in one file Best Practices • Complete requirements are essential • Design for a specific interface (iPad, Android devices..) • Graphic Design mentality required • Story boards, PowerPoint mock ups • Pay attention to file sizes
  • 23.
    Drag-and-drop data, smart filters,and intuitive analysis Modify plans, budgets, and forecasts accordingly Exchange files or publish and extend within the Cognos Family Add compelling visuals, widgets and themes Insight to Action Model scenarios, test assumptions, and optimize Model scenarios, test assumptions, and optimize
  • 24.
  • 25.
  • 26.
    Cognos Insight When touse? Who?  Personal Desktop Analytics  Prototyping  Ad-Hoc Analysis  Workflow Application Design  What-if Analysis  “Throw-away” Analysis  Data Analysts  Workflow Contributors Type of Client Skills Required  Thick Client  Can be launched from the Web  Minimal Training Required (1-2 days)  Knowledge of Data
  • 27.
    Cognos BI –Report Studio
  • 28.
    Cognos BI –Report Studio When to use? Who?  Pixel-Perfect Reports  Emailed Reports  Scheduled Reports  Report Authors Type of Client Skills Required  Web-Based / Thin Client  Report Studio
  • 29.
    Cognos BI –Active Reports
  • 30.
  • 31.
    Cognos BI –Active Reports & Mobile When to use? Who?  Mobile Device  Online or Offline  End Users Type of Client Skills Required  Web-Based (Mobile Browser)  Native iPad or Android App  None
  • 32.
    Cognos BI –Cognos Workspace
  • 33.
    Cognos BI –Cognos Workspace When to use? Who?  Self-Service Assembly of Existing BI Content  Dashboards  End Users Type of Client Skills Required  Web-Based / Thin Client  Cognos Workspace (1/2 day training)
  • 34.
    Cognos BI –Cognos Workspace Advanced
  • 35.
    Cognos BI –Cognos Workspace Advanced When to use? Who?  Ad-Hoc Analysis  Self-Service Reporting  Add in External Data Files  Advanced Ad-hoc Users  Analysts Type of Client Skills Required  Web-Based / Thin Client  Cognos Workspace Advanced (1-2 day training)  Basic Ad-hoc Reporting
  • 36.
    IBM COGNOS TM1 TableManager 1 Performance Management
  • 37.
    © 2012 IBMCorporation Common Information & Technology Platform IBM BA Performance Management Profitability Modeling & Optimization Management & Performance Reporting Scorecarding & Strategy Management Financial Close Management Sales Performance Management Integration and AutomationHierarchy ManagementAnalytic Data Management Planning Analysis & Forecasting Align resources with corporate objectives and market events through improved visibility and control over the levers of performance
  • 38.
    Finance IT Human Resources SalesMarketing Customer ServiceOperations Product Development Performance Management Finance Operations Sales / Customer Account Analysis & Close Financial Consol Reporting & Analysis Disclosure Mgmt & XBRL Sales and Ops Planning Capital Expend. Planning Product Profitability Incentive Comp Mgmt Quota Planning Territory & Channel Mgmt Planning Analysis & Forecasting Profitability Modeling & Optimization Performance Reporting & Scorecarding Governance, Risk, and Compliance Industry Specific Blueprints Industry Specific Blueprints 41 IBM BA Performance Management Solutions
  • 39.
    © 2012 IBMCorporation Key Contacts For Performance Management WHO MAIN CONCERNS CFO  Accountability & Timeliness  Integration across all LoBs  Insightful Info to drive business VP Planning  Accuracy, Forecast/Actual deltas  Frequency of collection  Amount of detail, value of info Controller  Accuracy  Adequate Controls  Flexibility to react Accounting/Finance Manager  Time spent collating  No time to check, value add activity  Evenings and weekend work CIO / IT  Audit, Controls, IT Standards  Finance system integration  Reporting & Data management VP Sales  Territory Planning challenges  Complex Compensation plans  Integration w/ Finance
  • 40.
    IBM BA PerformanceManagement – Better Outcomes Drive efficiencies and scale • Eliminate intensely manual efforts • Structure and automate dynamic processes • Scale to large user communities and data sets Gain agility and preparedness • Link operational and financial performance management • Support advanced analytic techniques (e.g., scenario • and predictive analytics, narrative performance reporting) • Eliminate delays in coordinating around emerging realities Improve effectiveness and outcomes • Dramatically reduce risk of errors • Cost-effectively address compliance • Drive new confidence in analytics-driven decision making Confidence Control Time
  • 41.
    What is TM1? Created in 1984  64-bit In-Memory OLAP Database  Designed for Writeback  Supports Real-Time Calculations  Secure and Centralized  Integrated with Excel, Cognos BI
  • 42.
    IBM Cognos TM1Solutions  Compensation Management  Sales Performance Management  Staffing Optimization  Training Certification  Intranet Employee Portal  Retail Sales Analysis  New Product Planning  Customer Profitability  Customer Churn Analysis  Financial Consolidations  Financial Reporting  Planning  Driver Based Budgeting  Rolling Forecasts  Risk Analysis  Demand Analysis  Inventory Optimization  Logistics Planning  Product Profitability  Production Planning Financial Operations Workforce Customer Complete Performance Management Applications • Read/Write Planning & What-If • Ad Hoc Analysis and Formatted Reporting
  • 43.
    TM1 Terminology  Dimension– A collection of Elements and their relationships to one another (e.g. Chart of Accounts).  Cube – A collection of dimensions whose intersections (cells) store data (e.g. Sales).  Element – A single member within a dimension (e.g. one account from the Chart of Accounts).  Attribute – A piece of information that describes an element (e.g. an inactive flag on an account).  Subset – A Subset of Elements within a Dimension (e.g. all revenue accounts)  Rule – A formula that describes business logic  Process – An ETL script that can import, export, and transform data.
  • 44.
    TM1 Interfaces  TM1Applications / Workflow  Cognos Insight  TM1 Perspectives (Excel Add-In)  TM1 Web  TM1 Architect  Performance Modeler  Cognos BI
  • 45.
  • 46.
    TM1 Applications /Workflow When to use? Who?  Data input  Approvals and Rejections  Email Notification  Status Reporting  End Users in a Workflow Process Type of Client Skills Required  Web-based / Thin Client for End Users  Performance Modeler for Admin  None
  • 47.
  • 48.
    TM1 Web When touse? Who?  Data Input  Ad-Hoc Analysis  Reporting  End Users  Power Users Type of Client Skills Required  Web-Based / Thin Client  None
  • 49.
  • 50.
    TM1 Perspectives (ExcelAdd-In) When to use? Who?  Template and Report Creation  Data Input  Reporting  Template Authors  End Users  Power Users Type of Client Skills Required  Excel Add-In  Requires Client Installation  Excel
  • 51.
    CAFÉ (Excel Add-In) CognosAnalysis for Excel
  • 52.
  • 53.
    CAFÉ (Excel Add-In) Whento use? Who?  Ad-Hoc Analysis  Slice and Dice  Data Entry  End Users  Power Users Type of Client Skills Required  Excel Add-In  Requires Client Installation  Excel
  • 54.
  • 55.
    TM1 Architect When touse? Who?  Modeling  Importing and Exporting Data  Managing Security  Modelers  Administrators Type of Client Skills Required  Thick Client - Windows  Requires Client Installation  TM1 Modeling
  • 56.
  • 57.
    Performance Modeler When touse? Who?  Modeling  Importing and Exporting Data  Managing Security  Workflow Application Design  Modelers  Administrators Type of Client Skills Required  Thick Client  Can be launched from the Web  TM1 Modeling
  • 58.
  • 59.
    What does SPSSstand for? Statistical. Package. for the Social. Sciences.
  • 60.
    What does SPSSstand for? Statistical. Package. for the Social. Sciences. It should be SPFC: Solving. Problems. For. Customers.
  • 61.
    Purpose • Introduce focuson Customer Experience • Spin the SPSS story from the Customer Experience perspective • Organize SPSS solutions into the customer experience theme • Define Predictive Analytics (PA) market
  • 62.
    Studies have shownthat the objects people chose to surround themselves with are indicative of their personalities. Gosling, Sam. Snoop: What Your Stuff Says About You. New York: Basic, 2008. Print.
  • 64.
  • 65.
    Questions to answer: •How can we use data to alter the customer experience? • How does data impact brand perception? • How do customer interact with data? • How is data integrated in the shopping experience?
  • 66.
    OF CUSTOMERS’ EVERYDAY POTENTIAL INTERACTIONWITH AN ORGANIZATION’S DATA EXAMPLE
  • 67.
    Meet Henry Hipster •Received phone calls at 8pm • Bank selling him accounts he has • Service provider can’t remember him • Customer service reps annoy him • Receives Junk Mail • Mailbox filled with SPAM NOW • No-logo philosophy • Obscure bands • Whole-foods • Hipster
  • 68.
    Meet Serene Serena •Trip to Bahamas • Coupons on the way • Exclusive product launches • No problems with service provider • Pizza remembers favorite order • Issues resolved in advance • Receives messages she wants NOW • Blogger • Superstar • Fan base • Lucky
  • 69.
    Meet Serene Serena •Trip to Bahamas • Coupons on the way • Exclusive product launches • No problems with service provider • Pizza remembers favorite order • Issues resolved in advance • Receives messages she wants NOW • Blogger • Superstar • Fan base • Lucky
  • 71.
  • 72.
    Sell the SPSSsolution as a data-centric way to improve the customer experience.
  • 73.
    What is theData-Driven Customer Experience? Using data, data mining methods, and predictive analytics to: • Create the best buying environment for your customers. • Facilitate communication with your customers that is effective and consistent. • Anticipate and predict customer needs.
  • 74.
    Using data toimprove the customer experience by focusing on… Buying Environment Communication Customer Needs
  • 75.
    Categorizing and grouping SPSSsolutions thematically so they are relevant to Enterprises.
  • 76.
  • 77.
    Buying Environment Digital Optimization Creating abetter user interface that improves the sales funnel. Preventing Fraud/Theft Creating a safe environment for customers that encourages spending. Targeted Advertising Creating personalized message and content to increase impact. Market Basket Analysis Grouping relevant items to facilitate increasing the single purchase price. .
  • 78.
  • 79.
    Communication Customer Segmentation Understanding customermicro- niches to better align products with customer interests Targeted Marketing Sending customers they want to see in their preferred deliver methods to increase engagement. Text Analytics Understanding customer sentiment in free form text to create an informed communication strategy. Churn Analytics Identify customers at risk of leaving to resolve customer issues faster. .
  • 80.
  • 81.
    Customer Needs Recommendation Engine Making targetedrecommendations to facilitate customers finding what they are looking for. Promotional Analytics Identifying ROI for promotions in order to continue offering customer discounts. Store Planning Identifying new markets in order to provide services to new potential customers. Merchandising Analytics Anticipating demand in order to stock inventory levels appropriately. .
  • 82.
    Buying Environment Communication Customer Needs Digital Optimization Preventing Fraud/Theft Targeted Advertising MarketBasket Analysis Customer Segmentation Targeted Marketing Text Analytics Churn Analytics Recommendation Engine Promotional Analytics Store Planning Merchandising Analytics Summary Reference Tables of SPSS Solutions Categories
  • 83.
    Big Data AnalyticsMarket Size by Business Category
  • 84.
    Big Data AnalyticsMarket Size by Business Category
  • 85.
  • 86.
  • 87.
  • 88.
    Predictive Analytics Market– Global Industry Analysis from Transparency Market Research • PA predicted to grow from $2.08B today to $6.54B in 2019 globally • Banking, FinServ, Insurance sectors largest market share • Retail and manufacturing expected to grow faster than any other segment • Fast growing consumer driven digital data • Need to extract strategically critical information • Rise in fraud, payment defaults, over or under stock inventory levels, stringent regulations
  • 89.
    Predictive Analytics Market– Global Industry Analysis from Transparency Market Research • Companies to adopt predictive models to gain futuristic insights • Leading segments: customer intelligence, fraud and security, campaign management – accounted for 50% market revenue 2012 • Target Departments: sales and marketing, customer and channel management, operations and workforce management, finance and risk management. • Finance and Risk 40.9% of revenue share in 2012.
  • 90.