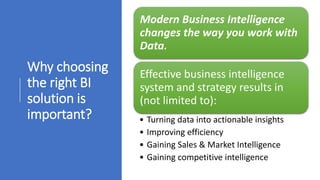
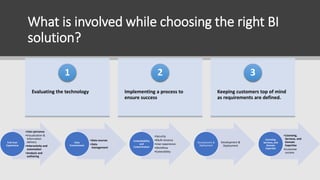
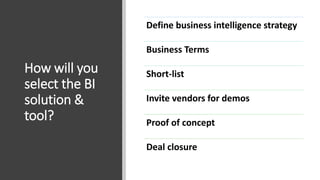
A Business Intelligence requirement
gathering checklist
To choose the right Business Intelligence and Analytics solution & tools for the organization.
Why choosing
the right BI
solution is
important?
Modern Business Intelligence
changes the way you work with
Data.
Effective business intelligence
system and strategy results in
(not limited to):
• Turning data into actionable insights
• Improving efficiency
• Gaining Sales & Market Intelligence
• Gaining competitive intelligence
What is involved while choosing the right BI
solution?
Evaluating the technology
1
Implementing a process to
ensure success
2
Keeping customers top of mind
as requirements are defined.
3
•User personas
•Visualization &
Information
delivery
•Interactivity and
automation
•Analysis and
authoring
End-User
Experience
•Data sources
•Data
management
Data
Environment
•Security
•Multi-tenancy
•User experience
•Workflow
•Extensibility
Embeddability
and
Customization
Development &
Deployment
Development &
Deployment
•Licensing,
Services, and
Domain
Expertise
•Customer
success
Licensing,
Services, and
Domain
Expertise
The checklist
Data
Inquiry
Data
Manipulati
on
Data
Analysis
Reporting Graphics
Data
Security
Documents
Data Inquiry
Simple Ad Hoc real time inquiry
The ability to enter and execute a query retrieving information,
containing information having, simple sums, counts and averages,
grouped by specified values.
Computed Columns
The ability to have columns of information that are calculated
and not stored.
Prompted Ad Hoc inquiries
The ability to execute predefined inquiries, which prompt you for
constraints, but always retrieve the same columns of information
Scheduled data extracts
The ability to have queries executed at predetermined times, or
related to business events.
External Sources of Information
The ability to integrate information from outside the Data
Warehouse. Examples:
Spreadsheets Files from outside sources, vendors, suppliers,
catalogs Files external to the Data Warehouse such as VSAM files,
IMS databases, flat files, other databases.
Import information for personal use
The ability import inquiries into P/C based packages for further
analysis. Examples:
Import into a spreadsheet Import into a personal database
Retrieve small amounts of
information
A few hundred rows of information, which may fit comfortably
into a spreadsheet
Retrieve large amounts of information
A few thousand, or more rows of information, not likely to fit
comfortably into a spreadsheet. May be stored in a personal
database for further analysis.
Use Summary Information
Information that is aggregated to pre- determined levels.
Example: Product sales by region and time
Use Detail Information
Information captured at the detail level, perhaps at a transaction
level.
Data
Manipulation
Workgroup
Databases
The ability to extract information for local
storage and further analysis
Custom Forms
Presentation
The ability to view and update information
using a custom form
Spreadsheet View
The ability to view information in a row and
column format
Interactive
Updates
The ability to change information in real
time
Batch Updates
The ability to store changes for processing
later
Data Warehouse
Write Back
The ability to have changes made put back
into the Data Warehouse.
Data
Analysis
Forecasting
Budgeting
Time Series Analysis The ability to perform a time based analysis
Business Modeling/What If
scenarios
The ability to create models to reflect possible
outcomes.
Goal Seeking
The ability to define a desired goal, and have
various factors evaluated to achieve that goal.
Regression Analysis
The ability to analyze how different variables
affect an outcome, and use that data to predict
outcomes for other data series.
Statistical Functions
Use simple and advanced statistical functions,
like skew and variance.
Financial Functions Use financial functions like IRR and NPV
Segmentation
The ability to define groups based on a criteria,
and then re-use that group for further analysis.
Reporting
Report Types
Columnar Information listed in columns by column heading
Cross Tab or Pivoted Information listed in Columns, but data values can form column headings
Banded
Information listed in horizontal bands,with each band having it’s own
contentand possibly spanning multiple lines.
Aggregation Having the ability to create totals, and sum duplicate rows of information
Computed Columns
The ability to have columns of information that are calculated from
queried data.
Complex Calculations
The ability to have complex calculations Examples:
Percent of Total Rolling Sums Period Comparisons
Drill Up and Drill Down
The ability to view information at a specific level, and drill to other levels
of information on a selected value. Example: Drill Country ->Region -
>District.
Mixed Text and Graphics The ability to produce reports that contain both text and graphics
Cosmetic Control
The ability to control fonts, bolding, or display report data in specialized
forms
Database Publishing
The ability to create documents that are driven by report data. Examples:
Product Catalogs
Exception Reporting
The ability to produce reports that only report on specific business
problems. Examples:
Product Sales drop by 10% Customers having Late Payments
Controlled Calculations
The ability to control the calculations used, so that everyone uses the
same formulas.
Report Templates
The ability to create report layouts that server as starting points for
creating custom reports
Prompted Reports The ability to create reports that prompt you for content and constraints.
Reporting Preferences The ability to set preferences for constraints, or content.
Graphics
Chart Types
Pie
Bar
Stacked Bar
Line
High/Low
Radar
Area
Histograms
Other
Combination
The ability to mix chart types on a single chart. Example: A Bar chart having a
Line Chart
superimposed on it.
2D 2 Dimension Charts for Data Analysis
3D 3 Dimension Charts for presentation
Multiple Scales The ability to have multiple scales displayed for different data series.
Split Scales
The ability to have scales change their range to reflect vastly different data
series
Median Line The ability to place a line showing the median for comparison purposes
Custom text Placement The ability to randomly place text for annotation purposes
Slide Shows The ability to create slide shows for presentation purposes
Custom Drawing
The ability to perform drawing functions to adjust the look of a graphic, or
create new objects
Maps The ability to create geographical diagrams
Clip Art
Chart Templates The ability to create templates for common chart generation
Automatic Update
The ability for charts to automatically reflect new information when the data
changes.
Data Security
Database
level
The ability to protect access to the database in
general
Table level
The ability to protect which tables of
information can be accessed
Field Level
The ability to protect which fields on a table
can be viewed Example:HR can see employee
personal
information, but others cannot.
Field
Content
The ability to protect data according to the
content of the data. Example: Managers can
only see information
for their departments data
Documents
Small Text Only
Small Text and Graphics
Large Text Only
Large Text and Graphics
Group editing of documents
Automation
Task automation
The ability to automate frequently
used tasks. Usually in the form of
macros and small applications that
serve as assists
Complete/Advanced
Automation
The ability to fully automate a
business function requiring many
steps
Scheduled Automation
The ability to have common tasks
executed at predetermined times or
according to Business Events
Profitability-
Accessibility
Remote access to
tools
The ability to use BI tools from remote
locations. Examples:
Mobile Devices VPN over Internet
Stand Alone access to
BI Tools
The ability to use the tools when not
connected to the network Examples:
Laptops Smart Phones Tablets
Internal Collaboration
The ability to share BI work with persons
inside the company. Examples:
Email Publish to a group in a Portal
External Collaboration
The ability to send BI work to persons
outside the company.
External Access
The ability to have external resources
use the BI applications. Examples:
Suppliers checking inventory levels
Vendors Checking Returns
How will you
select the BI
solution &
tool?
Define business intelligence strategy
Business Terms
Short-list
Invite vendors for demos
Proof of concept
Deal closure

A Business Intelligence requirement gathering checklist

  • 1.
    A Business Intelligencerequirement gathering checklist To choose the right Business Intelligence and Analytics solution & tools for the organization.
  • 2.
    Why choosing the rightBI solution is important? Modern Business Intelligence changes the way you work with Data. Effective business intelligence system and strategy results in (not limited to): • Turning data into actionable insights • Improving efficiency • Gaining Sales & Market Intelligence • Gaining competitive intelligence
  • 3.
    What is involvedwhile choosing the right BI solution? Evaluating the technology 1 Implementing a process to ensure success 2 Keeping customers top of mind as requirements are defined. 3 •User personas •Visualization & Information delivery •Interactivity and automation •Analysis and authoring End-User Experience •Data sources •Data management Data Environment •Security •Multi-tenancy •User experience •Workflow •Extensibility Embeddability and Customization Development & Deployment Development & Deployment •Licensing, Services, and Domain Expertise •Customer success Licensing, Services, and Domain Expertise
  • 4.
  • 5.
    Data Inquiry Simple AdHoc real time inquiry The ability to enter and execute a query retrieving information, containing information having, simple sums, counts and averages, grouped by specified values. Computed Columns The ability to have columns of information that are calculated and not stored. Prompted Ad Hoc inquiries The ability to execute predefined inquiries, which prompt you for constraints, but always retrieve the same columns of information Scheduled data extracts The ability to have queries executed at predetermined times, or related to business events. External Sources of Information The ability to integrate information from outside the Data Warehouse. Examples: Spreadsheets Files from outside sources, vendors, suppliers, catalogs Files external to the Data Warehouse such as VSAM files, IMS databases, flat files, other databases. Import information for personal use The ability import inquiries into P/C based packages for further analysis. Examples: Import into a spreadsheet Import into a personal database Retrieve small amounts of information A few hundred rows of information, which may fit comfortably into a spreadsheet Retrieve large amounts of information A few thousand, or more rows of information, not likely to fit comfortably into a spreadsheet. May be stored in a personal database for further analysis. Use Summary Information Information that is aggregated to pre- determined levels. Example: Product sales by region and time Use Detail Information Information captured at the detail level, perhaps at a transaction level.
  • 6.
    Data Manipulation Workgroup Databases The ability toextract information for local storage and further analysis Custom Forms Presentation The ability to view and update information using a custom form Spreadsheet View The ability to view information in a row and column format Interactive Updates The ability to change information in real time Batch Updates The ability to store changes for processing later Data Warehouse Write Back The ability to have changes made put back into the Data Warehouse.
  • 7.
    Data Analysis Forecasting Budgeting Time Series AnalysisThe ability to perform a time based analysis Business Modeling/What If scenarios The ability to create models to reflect possible outcomes. Goal Seeking The ability to define a desired goal, and have various factors evaluated to achieve that goal. Regression Analysis The ability to analyze how different variables affect an outcome, and use that data to predict outcomes for other data series. Statistical Functions Use simple and advanced statistical functions, like skew and variance. Financial Functions Use financial functions like IRR and NPV Segmentation The ability to define groups based on a criteria, and then re-use that group for further analysis.
  • 8.
    Reporting Report Types Columnar Informationlisted in columns by column heading Cross Tab or Pivoted Information listed in Columns, but data values can form column headings Banded Information listed in horizontal bands,with each band having it’s own contentand possibly spanning multiple lines. Aggregation Having the ability to create totals, and sum duplicate rows of information Computed Columns The ability to have columns of information that are calculated from queried data. Complex Calculations The ability to have complex calculations Examples: Percent of Total Rolling Sums Period Comparisons Drill Up and Drill Down The ability to view information at a specific level, and drill to other levels of information on a selected value. Example: Drill Country ->Region - >District. Mixed Text and Graphics The ability to produce reports that contain both text and graphics Cosmetic Control The ability to control fonts, bolding, or display report data in specialized forms Database Publishing The ability to create documents that are driven by report data. Examples: Product Catalogs Exception Reporting The ability to produce reports that only report on specific business problems. Examples: Product Sales drop by 10% Customers having Late Payments Controlled Calculations The ability to control the calculations used, so that everyone uses the same formulas. Report Templates The ability to create report layouts that server as starting points for creating custom reports Prompted Reports The ability to create reports that prompt you for content and constraints. Reporting Preferences The ability to set preferences for constraints, or content.
  • 9.
    Graphics Chart Types Pie Bar Stacked Bar Line High/Low Radar Area Histograms Other Combination Theability to mix chart types on a single chart. Example: A Bar chart having a Line Chart superimposed on it. 2D 2 Dimension Charts for Data Analysis 3D 3 Dimension Charts for presentation Multiple Scales The ability to have multiple scales displayed for different data series. Split Scales The ability to have scales change their range to reflect vastly different data series Median Line The ability to place a line showing the median for comparison purposes Custom text Placement The ability to randomly place text for annotation purposes Slide Shows The ability to create slide shows for presentation purposes Custom Drawing The ability to perform drawing functions to adjust the look of a graphic, or create new objects Maps The ability to create geographical diagrams Clip Art Chart Templates The ability to create templates for common chart generation Automatic Update The ability for charts to automatically reflect new information when the data changes.
  • 10.
    Data Security Database level The abilityto protect access to the database in general Table level The ability to protect which tables of information can be accessed Field Level The ability to protect which fields on a table can be viewed Example:HR can see employee personal information, but others cannot. Field Content The ability to protect data according to the content of the data. Example: Managers can only see information for their departments data
  • 11.
    Documents Small Text Only SmallText and Graphics Large Text Only Large Text and Graphics Group editing of documents
  • 12.
    Automation Task automation The abilityto automate frequently used tasks. Usually in the form of macros and small applications that serve as assists Complete/Advanced Automation The ability to fully automate a business function requiring many steps Scheduled Automation The ability to have common tasks executed at predetermined times or according to Business Events
  • 13.
    Profitability- Accessibility Remote access to tools Theability to use BI tools from remote locations. Examples: Mobile Devices VPN over Internet Stand Alone access to BI Tools The ability to use the tools when not connected to the network Examples: Laptops Smart Phones Tablets Internal Collaboration The ability to share BI work with persons inside the company. Examples: Email Publish to a group in a Portal External Collaboration The ability to send BI work to persons outside the company. External Access The ability to have external resources use the BI applications. Examples: Suppliers checking inventory levels Vendors Checking Returns
  • 14.
    How will you selectthe BI solution & tool? Define business intelligence strategy Business Terms Short-list Invite vendors for demos Proof of concept Deal closure