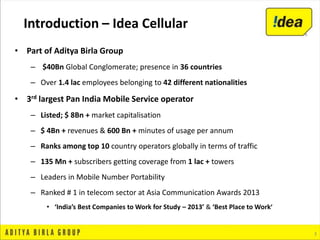
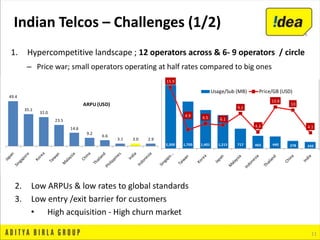
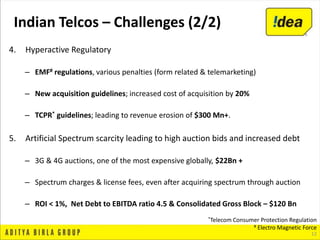
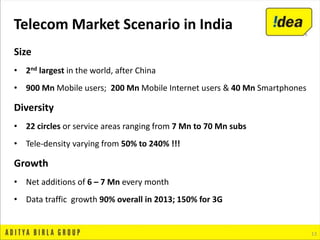
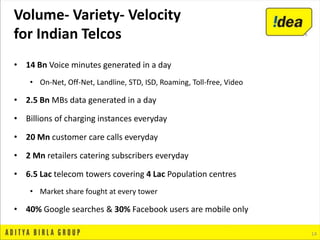
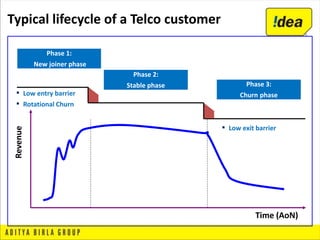
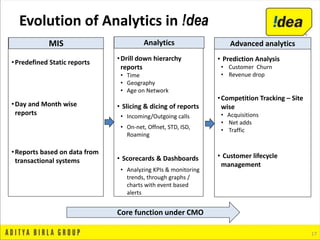
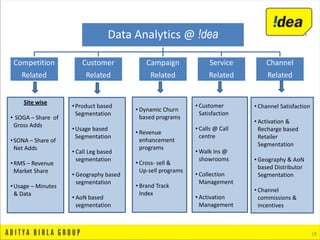
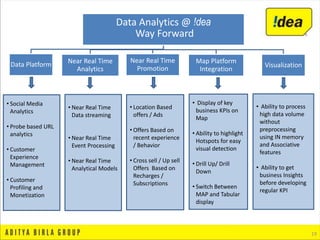
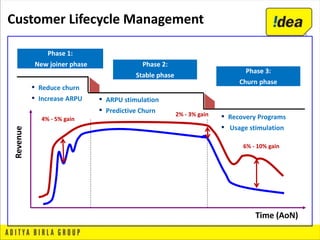
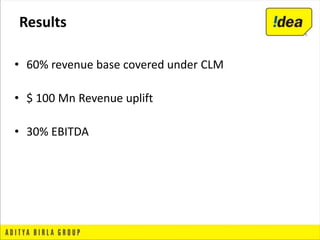
Business Analytics
A Strategic Imperative
SAS Forum India 2014
23rd April – Grand Hyatt, Mumbai
1
• Introduction to Idea Cellular
• Data transforming world around us
– Data Analytics drivers & emerging trends
• Strategic importance of analytics for an Indian Telco
– Challenges faced by Indian Telcos
• Data Analytics at !dea
– CLM @ !dea
• Benefits
Contents
Introduction
to
Idea Cellular
3
• Part of Aditya Birla Group
– $40Bn Global Conglomerate; presence in 36 countries
– Over 1.4 lac employees belonging to 42 different nationalities
• 3rd largest Pan India Mobile Service operator
– Listed; $ 8Bn + market capitalisation
– $ 4Bn + revenues & 600 Bn + minutes of usage per annum
– Ranks among top 10 country operators globally in terms of traffic
– 135 Mn + subscribers getting coverage from 1 lac + towers
– Leaders in Mobile Number Portability
– Ranked # 1 in telecom sector at Asia Communication Awards 2013
• ‘India’s Best Companies to Work for Study – 2013’ & ‘Best Place to Work’
Introduction – Idea Cellular
Data Transforming
World Around Us
2009
2011
2015
2020
5
Global Data growing exponentially
0.8 ZB
1.9 ZB
7.9 ZB
35 ZB
CAGR (2009-20) 41.0%
Implication on an organisation
• Need for large storage capacity
• Need for quick retrieval of data
• Enable informed decision making
effectively, leveraging large datasets.
Data captured by organisations to understand customers, suppliers, partners & operations.
1 Zettabyte (ZB) = 1 Bn Terabyte (TB) Source : Nasscom Big data report
6
Managing Volume, Variety & Velocity
Volume • Volume - Large quantity of data
• 22 Bn GB of data is generated everyday globally
• Variety - Diverse set of data
• Competition & Customer related
• Campaign & Channel related
• Social Networking feeds
• Velocity – Speed of data inflow
• 14 Bn + Mobile Minutes generated everyday in India
• 30 Mn + passengers travel from rail everyday in India
• 20 Mn + ATM /POS transactions everyday in India
• 17 Mn + internet searches everyday in India
Source : RBI & comScore Indian Digital Future 2013
Key Industries using Data Analytics
Financial
Services
Retail Healthcare /Pharma Manufacturing Telecom
7
Data Analytics across Industries
•Claims & Renewal
Analytics
•Sales Force
Analytics
•Collection &
Recovery
Scorecards
•Portfolio
Analytics
•Pricing & Risk
Analytics
•Demand
Forecasting
•Marketing Mix
Analytics
•Performance
Analysis
•Category
Management
•Trade Promotion
Optimization
•Evidence Based
Medicine
•Drug Treatment
Effectiveness
•Clinical Analytics
•Average Length of
Stay
•Key Opinion
Analysis
• Collection
Management
• Subscriber Profiling
• Competition
Benchmarking
• Churn Management
• Revenue Assurance
• Customized
Offerings & Up-
Selling
• Demand
Forecasting & SKU
Rationalisation
• Media ROI
Optimizations
• Route &
Distribution
Optimization
• Vendor
Performance
Management
8
Drivers for Data Analytics
• Sales Reporting & Tracking
• Cost Reduction
• Risk Management
• Better view to Financial data
• Regulatory Compliance
Drivers for
BI & Analytics
• Innovation
• Competitive Differentiation
• Reducing costs & Increasing Efficiencies
• Growth
• Insights for future strategy
Organization
Benefits
• Increased focus on Predictive Analytics
– Historical events Vs forecasting future trends
• Real Time Analytics
– Quicker decision making with help of real time data.
• Social Media Analytics
– Focus on deriving customer insights based on social media behaviour
– Real time inputs from Facebook, Twitter, Linkedln etc.
• Integration of ERP & Analytics Software
– Integration of data generation and data analysis through BI mart
• Drive appropriate Variables & KPIs for enhanced business results
9
Emerging Trends in Data Analytics
Data Analytics
@
Indian Telco
1. Hypercompetitive landscape ; 12 operators across & 6- 9 operators / circle
– Price war; small operators operating at half rates compared to big ones
11
Indian Telcos – Challenges (1/2)
49.4
35.1
32.0
23.5
14.6
9.2
6.6
3.1 3.0 2.9
ARPU (USD)
15.9
4.9 6.5 6.1
9.1
4.3
10.8
10
4.1
2,300 1,700 1,401 1,215 717 465 440 278 242
Usage/Sub (MB) Price/GB (USD)
2. Low ARPUs & low rates to global standards
3. Low entry /exit barrier for customers
• High acquisition - High churn market
4. Hyperactive Regulatory
– EMF# regulations, various penalties (form related & telemarketing)
– New acquisition guidelines; increased cost of acquisition by 20%
– TCPR* guidelines; leading to revenue erosion of $300 Mn+.
5. Artificial Spectrum scarcity leading to high auction bids and increased debt
– 3G & 4G auctions, one of the most expensive globally, $22Bn +
– Spectrum charges & license fees, even after acquiring spectrum through auction
– ROI < 1%, Net Debt to EBITDA ratio 4.5 & Consolidated Gross Block – $120 Bn
12
Indian Telcos – Challenges (2/2)
*Telecom Consumer Protection Regulation
# Electro Magnetic Force
Size
• 2nd largest in the world, after China
• 900 Mn Mobile users; 200 Mn Mobile Internet users & 40 Mn Smartphones
Diversity
• 22 circles or service areas ranging from 7 Mn to 70 Mn subs
• Tele-density varying from 50% to 240% !!!
Growth
• Net additions of 6 – 7 Mn every month
• Data traffic growth 90% overall in 2013; 150% for 3G
13
Telecom Market Scenario in India
• 14 Bn Voice minutes generated in a day
• On-Net, Off-Net, Landline, STD, ISD, Roaming, Toll-free, Video
• 2.5 Bn MBs data generated in a day
• Billions of charging instances everyday
• 20 Mn customer care calls everyday
• 2 Mn retailers catering subscribers everyday
• 6.5 Lac telecom towers covering 4 Lac Population centres
• Market share fought at every tower
• 40% Google searches & 30% Facebook users are mobile only
14
Volume- Variety- Velocity
for Indian Telcos
Typical lifecycle of a Telco customer
Phase 1:
New joiner phase
Phase 2:
Stable phase Phase 3:
Churn phase
Time (AoN)
Revenue
▪ Low entry barrier
▪ Rotational Churn
▪ Low exit barrier
Data Analytics
@
!dea
17
Evolution of Analytics in !dea
•Predefined Static reports
•Day and Month wise
reports
•Reports based on data from
transactional systems
•Drill down hierarchy
reports
• Time
• Geography
• Age on Network
• Slicing & dicing of reports
• Incoming/Outgoing calls
• On-net, Offnet, STD, ISD,
Roaming
• Scorecards & Dashboards
• Analyzing KPIs & monitoring
trends, through graphs /
charts with event based
alerts
• Prediction Analysis
• Customer Churn
• Revenue drop
•Competition Tracking – Site
wise
• Acquisitions
• Net adds
• Traffic
• Customer lifecycle
management
MIS Analytics Advanced analytics
Core function under CMO
Data Analytics @ !dea
Competition
Related
Customer
Related
Campaign
Related
Service
Related
Channel
Related
18
Site wise
• SOGA – Share of
Gross Adds
•SONA – Share of
Net Adds
•RMS – Revenue
Market Share
•Usage – Minutes
& Data
•Product based
Segmentation
•Usage based
Segmentation
• Call Leg based
segmentation
• Geography based
segmentation
• AoN based
segmentation
• Dynamic Churn
based programs
• Revenue
enhancement
programs
• Cross- sell &
Up-sell programs
• Brand Track
Index
• Channel Satisfaction
• Activation &
Recharge based
Retailer
Segmentation
• Geography & AoN
based Distributor
Segmentation
• Channel
commissions &
incentives
• Customer
Satisfaction
• Calls @ Call
centre
• Walk ins @
showrooms
• Collection
Management
• Activation
Management
Data Analytics @ !dea
Way Forward
Data Platform Near Real Time
Analytics
Near Real Time
Promotion
Map Platform
Integration
Visualization
19
• Social Media
Analytics
• Probe based URL
analytics
• Customer
Experience
Management
• Customer
Profiling and
Monetization
• Near Real Time
Data streaming
• Near Real Time
Event Processing
• Near Real Time
Analytical Models
• Location Based
offers / Ads
• Offers Based on
recent experience
/ Behavior
• Cross sell / Up sell
Offers Based on
Recharges /
Subscriptions
• Ability to process
high data volume
without
preprocessing
using IN memory
and Associative
features
• Ability to get
business Insights
before developing
regular KPI
• Display of key
business KPIs on
Map
• Ability to highlight
Hotspots for easy
visual detection
• Drill Up/ Drill
Down
• Switch Between
MAP and Tabular
display
Customer Lifecycle Management
@
!dea
Industrialised systems and processes
 Measuring real time campaign impact on
top-line and bottom-line
 Clear Targets

Campaign library & product catalogues
to drive competitive edge; !dea IPR

CLM Objectives & Deliverables
21
Test offers against each segment to find positive contribution to
bottom line. Let customer decide the best offer !!!
Micro segments (50-100K) based on similarity of usage behaviour
through intensive data mining. Exclusive offers to each micro-
segment to prevent value destruction !!!
Target customers at all stage of lifecycle. Up-sell, cross-sell, retain
and train through creative offerings. !!!
Tested offers to be scaled to entire set of micro-segments &
analyze results on real time basis. Build library of performing
offers !!!
Micro-
Segmentation
2
Creative
campaigns
4
Scale & Speed
Don’t guess,
Test !
1
3
How CLM in !dea is different?
22
Usage Leg based segmentation
Value
levers
Share of
Wallet
Usage
stimulation
Retention
Type (SMS, Voice, VAS)
Time (Weekend, Night))
Volume (MoU, Count)
Duration/Frequency
Outgoing/Incoming
Primary dimension
Primary usage Sub-usage
>3
mths
Internet/
text users
Internet/
text non
users
Mr. Local
Mr. STD
Mr. VAS
Mr. Balanced
xx
xx
xx
xx
xx
xx
High
Users
< 3
mths
xx
xx
AONMOU/VLR
All
subs
Mr. STD
Mr. VAS
Mr. Balanced
xx
xx
Mr. Local
Micro Segmentation Approach
23
xx
xx
Campaigns targeting value levers
Automation Advantages
• Create & analyze segments with more than 1400 variable options.
– More than 4000 campaigns launched in a month.
• Automation of communication at touch points
– DND scrubbing, scheduling, script banks & vernacular scripts
• Automated tracking of promotions
– 15 Mn+ subscribers doing 25 Mn+ segmented recharges valuing $ 22 Mn +
• Ability to create ‘Dynamic Campaigns’
• Creation of ‘Recurring Campaigns’
25
Total Impact (ROI) of the offer
Not considered right now
ROI
• Incremental
Contribution
Gross Revenue
• Incremental
Revenue
• Loyalty
Benefits
Costs
• Incremental
Direct Costs
• Incremental
Network
Costs
• Execution
Costs
Customer Lifecycle Management
Phase 1:
New joiner phase Phase 2:
Stable phase
Phase 3:
Churn phase
Time (AoN)
Revenue
2% - 3% gain
6% - 10% gain
4% - 5% gain
▪ Reduce churn
▪ Increase ARPU ▪ ARPU stimulation
▪ Predictive Churn
▪ Recovery Programs
▪ Usage stimulation
Results
• 60% revenue base covered under CLM
• $ 100 Mn Revenue uplift
• 30% EBITDA
Thanks

Business Analytics: A Strategic Imperative

  • 1.
    Business Analytics A StrategicImperative SAS Forum India 2014 23rd April – Grand Hyatt, Mumbai
  • 2.
    1 • Introduction toIdea Cellular • Data transforming world around us – Data Analytics drivers & emerging trends • Strategic importance of analytics for an Indian Telco – Challenges faced by Indian Telcos • Data Analytics at !dea – CLM @ !dea • Benefits Contents
  • 3.
  • 4.
    3 • Part ofAditya Birla Group – $40Bn Global Conglomerate; presence in 36 countries – Over 1.4 lac employees belonging to 42 different nationalities • 3rd largest Pan India Mobile Service operator – Listed; $ 8Bn + market capitalisation – $ 4Bn + revenues & 600 Bn + minutes of usage per annum – Ranks among top 10 country operators globally in terms of traffic – 135 Mn + subscribers getting coverage from 1 lac + towers – Leaders in Mobile Number Portability – Ranked # 1 in telecom sector at Asia Communication Awards 2013 • ‘India’s Best Companies to Work for Study – 2013’ & ‘Best Place to Work’ Introduction – Idea Cellular
  • 5.
  • 6.
    2009 2011 2015 2020 5 Global Data growingexponentially 0.8 ZB 1.9 ZB 7.9 ZB 35 ZB CAGR (2009-20) 41.0% Implication on an organisation • Need for large storage capacity • Need for quick retrieval of data • Enable informed decision making effectively, leveraging large datasets. Data captured by organisations to understand customers, suppliers, partners & operations. 1 Zettabyte (ZB) = 1 Bn Terabyte (TB) Source : Nasscom Big data report
  • 7.
    6 Managing Volume, Variety& Velocity Volume • Volume - Large quantity of data • 22 Bn GB of data is generated everyday globally • Variety - Diverse set of data • Competition & Customer related • Campaign & Channel related • Social Networking feeds • Velocity – Speed of data inflow • 14 Bn + Mobile Minutes generated everyday in India • 30 Mn + passengers travel from rail everyday in India • 20 Mn + ATM /POS transactions everyday in India • 17 Mn + internet searches everyday in India Source : RBI & comScore Indian Digital Future 2013
  • 8.
    Key Industries usingData Analytics Financial Services Retail Healthcare /Pharma Manufacturing Telecom 7 Data Analytics across Industries •Claims & Renewal Analytics •Sales Force Analytics •Collection & Recovery Scorecards •Portfolio Analytics •Pricing & Risk Analytics •Demand Forecasting •Marketing Mix Analytics •Performance Analysis •Category Management •Trade Promotion Optimization •Evidence Based Medicine •Drug Treatment Effectiveness •Clinical Analytics •Average Length of Stay •Key Opinion Analysis • Collection Management • Subscriber Profiling • Competition Benchmarking • Churn Management • Revenue Assurance • Customized Offerings & Up- Selling • Demand Forecasting & SKU Rationalisation • Media ROI Optimizations • Route & Distribution Optimization • Vendor Performance Management
  • 9.
    8 Drivers for DataAnalytics • Sales Reporting & Tracking • Cost Reduction • Risk Management • Better view to Financial data • Regulatory Compliance Drivers for BI & Analytics • Innovation • Competitive Differentiation • Reducing costs & Increasing Efficiencies • Growth • Insights for future strategy Organization Benefits
  • 10.
    • Increased focuson Predictive Analytics – Historical events Vs forecasting future trends • Real Time Analytics – Quicker decision making with help of real time data. • Social Media Analytics – Focus on deriving customer insights based on social media behaviour – Real time inputs from Facebook, Twitter, Linkedln etc. • Integration of ERP & Analytics Software – Integration of data generation and data analysis through BI mart • Drive appropriate Variables & KPIs for enhanced business results 9 Emerging Trends in Data Analytics
  • 11.
  • 12.
    1. Hypercompetitive landscape; 12 operators across & 6- 9 operators / circle – Price war; small operators operating at half rates compared to big ones 11 Indian Telcos – Challenges (1/2) 49.4 35.1 32.0 23.5 14.6 9.2 6.6 3.1 3.0 2.9 ARPU (USD) 15.9 4.9 6.5 6.1 9.1 4.3 10.8 10 4.1 2,300 1,700 1,401 1,215 717 465 440 278 242 Usage/Sub (MB) Price/GB (USD) 2. Low ARPUs & low rates to global standards 3. Low entry /exit barrier for customers • High acquisition - High churn market
  • 13.
    4. Hyperactive Regulatory –EMF# regulations, various penalties (form related & telemarketing) – New acquisition guidelines; increased cost of acquisition by 20% – TCPR* guidelines; leading to revenue erosion of $300 Mn+. 5. Artificial Spectrum scarcity leading to high auction bids and increased debt – 3G & 4G auctions, one of the most expensive globally, $22Bn + – Spectrum charges & license fees, even after acquiring spectrum through auction – ROI < 1%, Net Debt to EBITDA ratio 4.5 & Consolidated Gross Block – $120 Bn 12 Indian Telcos – Challenges (2/2) *Telecom Consumer Protection Regulation # Electro Magnetic Force
  • 14.
    Size • 2nd largestin the world, after China • 900 Mn Mobile users; 200 Mn Mobile Internet users & 40 Mn Smartphones Diversity • 22 circles or service areas ranging from 7 Mn to 70 Mn subs • Tele-density varying from 50% to 240% !!! Growth • Net additions of 6 – 7 Mn every month • Data traffic growth 90% overall in 2013; 150% for 3G 13 Telecom Market Scenario in India
  • 15.
    • 14 BnVoice minutes generated in a day • On-Net, Off-Net, Landline, STD, ISD, Roaming, Toll-free, Video • 2.5 Bn MBs data generated in a day • Billions of charging instances everyday • 20 Mn customer care calls everyday • 2 Mn retailers catering subscribers everyday • 6.5 Lac telecom towers covering 4 Lac Population centres • Market share fought at every tower • 40% Google searches & 30% Facebook users are mobile only 14 Volume- Variety- Velocity for Indian Telcos
  • 16.
    Typical lifecycle ofa Telco customer Phase 1: New joiner phase Phase 2: Stable phase Phase 3: Churn phase Time (AoN) Revenue ▪ Low entry barrier ▪ Rotational Churn ▪ Low exit barrier
  • 17.
  • 18.
    17 Evolution of Analyticsin !dea •Predefined Static reports •Day and Month wise reports •Reports based on data from transactional systems •Drill down hierarchy reports • Time • Geography • Age on Network • Slicing & dicing of reports • Incoming/Outgoing calls • On-net, Offnet, STD, ISD, Roaming • Scorecards & Dashboards • Analyzing KPIs & monitoring trends, through graphs / charts with event based alerts • Prediction Analysis • Customer Churn • Revenue drop •Competition Tracking – Site wise • Acquisitions • Net adds • Traffic • Customer lifecycle management MIS Analytics Advanced analytics Core function under CMO
  • 19.
    Data Analytics @!dea Competition Related Customer Related Campaign Related Service Related Channel Related 18 Site wise • SOGA – Share of Gross Adds •SONA – Share of Net Adds •RMS – Revenue Market Share •Usage – Minutes & Data •Product based Segmentation •Usage based Segmentation • Call Leg based segmentation • Geography based segmentation • AoN based segmentation • Dynamic Churn based programs • Revenue enhancement programs • Cross- sell & Up-sell programs • Brand Track Index • Channel Satisfaction • Activation & Recharge based Retailer Segmentation • Geography & AoN based Distributor Segmentation • Channel commissions & incentives • Customer Satisfaction • Calls @ Call centre • Walk ins @ showrooms • Collection Management • Activation Management
  • 20.
    Data Analytics @!dea Way Forward Data Platform Near Real Time Analytics Near Real Time Promotion Map Platform Integration Visualization 19 • Social Media Analytics • Probe based URL analytics • Customer Experience Management • Customer Profiling and Monetization • Near Real Time Data streaming • Near Real Time Event Processing • Near Real Time Analytical Models • Location Based offers / Ads • Offers Based on recent experience / Behavior • Cross sell / Up sell Offers Based on Recharges / Subscriptions • Ability to process high data volume without preprocessing using IN memory and Associative features • Ability to get business Insights before developing regular KPI • Display of key business KPIs on Map • Ability to highlight Hotspots for easy visual detection • Drill Up/ Drill Down • Switch Between MAP and Tabular display
  • 21.
  • 22.
    Industrialised systems andprocesses  Measuring real time campaign impact on top-line and bottom-line  Clear Targets  Campaign library & product catalogues to drive competitive edge; !dea IPR  CLM Objectives & Deliverables 21
  • 23.
    Test offers againsteach segment to find positive contribution to bottom line. Let customer decide the best offer !!! Micro segments (50-100K) based on similarity of usage behaviour through intensive data mining. Exclusive offers to each micro- segment to prevent value destruction !!! Target customers at all stage of lifecycle. Up-sell, cross-sell, retain and train through creative offerings. !!! Tested offers to be scaled to entire set of micro-segments & analyze results on real time basis. Build library of performing offers !!! Micro- Segmentation 2 Creative campaigns 4 Scale & Speed Don’t guess, Test ! 1 3 How CLM in !dea is different? 22
  • 24.
    Usage Leg basedsegmentation Value levers Share of Wallet Usage stimulation Retention Type (SMS, Voice, VAS) Time (Weekend, Night)) Volume (MoU, Count) Duration/Frequency Outgoing/Incoming Primary dimension Primary usage Sub-usage >3 mths Internet/ text users Internet/ text non users Mr. Local Mr. STD Mr. VAS Mr. Balanced xx xx xx xx xx xx High Users < 3 mths xx xx AONMOU/VLR All subs Mr. STD Mr. VAS Mr. Balanced xx xx Mr. Local Micro Segmentation Approach 23 xx xx Campaigns targeting value levers
  • 25.
    Automation Advantages • Create& analyze segments with more than 1400 variable options. – More than 4000 campaigns launched in a month. • Automation of communication at touch points – DND scrubbing, scheduling, script banks & vernacular scripts • Automated tracking of promotions – 15 Mn+ subscribers doing 25 Mn+ segmented recharges valuing $ 22 Mn + • Ability to create ‘Dynamic Campaigns’ • Creation of ‘Recurring Campaigns’
  • 26.
    25 Total Impact (ROI)of the offer Not considered right now ROI • Incremental Contribution Gross Revenue • Incremental Revenue • Loyalty Benefits Costs • Incremental Direct Costs • Incremental Network Costs • Execution Costs
  • 27.
    Customer Lifecycle Management Phase1: New joiner phase Phase 2: Stable phase Phase 3: Churn phase Time (AoN) Revenue 2% - 3% gain 6% - 10% gain 4% - 5% gain ▪ Reduce churn ▪ Increase ARPU ▪ ARPU stimulation ▪ Predictive Churn ▪ Recovery Programs ▪ Usage stimulation
  • 28.
    Results • 60% revenuebase covered under CLM • $ 100 Mn Revenue uplift • 30% EBITDA
  • 29.