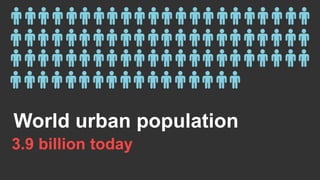
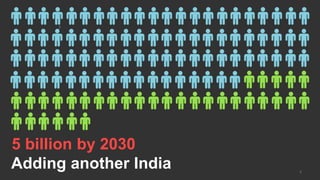
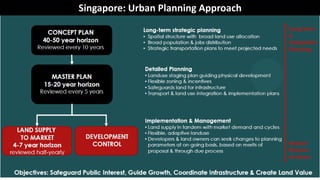
SlideShare a Scribd company logo
Building Cities That Work:
Lessons from East Asia
Abhas Jha
World urban population
3.9 billion today
5 billion by 2030
Adding another India
3
3
4
4
6.3 billion by 2050
And another China
Storyline: Challenges and opportunities of urbanization/
the need for cities to work in order to benefit their
growing populations
Check ratings
Cities present both challenges and
opportunities. To harness their
potential for growth and prosperity,
cities need to work.
Storyline: Challenges and opportunities of urbanization/
the need for cities to work in order to benefit their
growing populations
Check ratings
• Adopt a Long-Term, Integrated Planning Approach
• Ensure Planning is Evidence-Based
• Capitalize on Scale
• Harness Density
• Explore Innovative Financing Solutions
• Enable Land Markets to Function Effectively
Overview
Adopt a Long-Term, Integrated Planning Approach
SINGAPORE: PLANNING APPROACHSingapore: Urban Planning Approach
• Many cities are unable to translate plans to implementation
• Use of land use planning and urban design to shape neighborhoods and
respond to needs
Singapore land area = 719 km
Singapore’s use of detailed planning to shape
mixed-used district character along riverfront
Source: Urban Redevelopment Authority, Singapore (2015).
Shape vibrant district level neighborhoods and facilitate
development needs
Singapore: Urban Planning Approach
Integrated Land Use and Transport Planning
8 in 10
households
living within a
10 minute
walk from a
train station
75%
of all
journeys in
peak hours
undertaken
on public
transport
85%
of public
transport
journeys (less
than 20 km)
completed
within 60
minutesLeft: Copenhagen’s “Finger Plan”
established infrastructure along desired
growth corridors (Sustainable Cities
Collective); Above and Right:
Singapore’s integrated infrastructure
and land use planning (Alain Bertaud) is
driven by clear performance targets
(Land Transport Authority’s Land
Transport Master Plan)
Ensure Planning is Evidence-Based
Singapore: ePlanner
13
Pop Base Pop +100%
People/km2
Transit Network
TODaround
MetroStation
(Job+100%,
Pop+100%)
BikeFacilities
JobAccessibility
Line 123 only No No 12%
Line 123 + Bus Yes Yes 46%
Line 123456 +
Bus
No No 32%
Line 123456 +
Bus
Yes Yes 51%
Source: The 3V Framework (World Bank)
Measuring Job Accessibility
Indonesia: City Planning Labs
• First successful slum-typology classification at city scale
• Spatially Representative Slum Survey: nuancing urban poverty
• Better design for city wide slum upgrading
Philippines: Slum Mapping
Beijing: Green Horizons
• Collaboration between IBM and Beijing
• Uses Internet of Things and cognitive
computing to improve air quality
management and forecasting.
• Enables authorities to better plan long-
term interventions to tackle air pollution
Capitalize on Scale
Metropolitan areas continue to power national
economic growth
• In 2014, 60% of metro areas outperformed in
employment creation
• 1/3 of world’s 300 largest metro economies
outpaced in GDP per capita and employment
growth rates
Metropolitan Regions: Economic Powerhouses
USA: Economic Mega-Regions
49 MRs created 57% of
national GDP, home to
just 32% of
population. 95% of
China’s population
growth from 2000-2010
occurred in these MRs.
China: Metropolitan Regions
*Figures as at 2010; Source: Chreod 2013
The Yangtze River Economic Belt accounts for
20% of China’s GDP and is responsible for
one-third of its imports and exports.
The Manila urban area in the Philippines includes 85
municipalities and cities in seven provinces.
Manila: Urban Expansion
India: Peripheral Industrial Growth
• Growth of economic activities highest in suburban villages
• Pace of growth in high-tech and export-oriented manufacturing
is fastest in peripheries of large metropolises
Source: Economic Census 2005 and 1998
The city continuously transforms itself to higher value added sectors by implementing proactive reform policy, and enhancing governance capabilities
Source: Porter, Neo and Ketels (2013). Remaking Singapore. Havard Business School 9-710-483.
Transport
& Logistics
Electronics
Assembly
Petro-
chemicals
Finance
IT
Headquarters
Business
Services
Pharmaceuticals Aerospace
Industrial
Evolution
Assets and
Changing
Conditions
1958-1985
Becoming an Asian Tiger
• British base/ strategic
location
• Entrepôt
• Lose labor market rules
• FDI attraction: let foreign
firms co-invest into joint
ventures to limit risks
• Fiscal policy: under-valued
currency to boost exports
• Wages increase/ 1985
depression
• Key public investments to
decrease costs of living
for residents
• Increased productivity
through skills
development and
investments in
infrastructure
• Nurture a knowledge system to
become a global education hub
• Invest in research and
development
• Invest in quality of life (garden
city, casino, etc.)
1985-1990
Recession and Reform
1991-2010
Singapore Maturing
time
Singapore: Economic Evolution (1950 – 2010)
Most firms in Silicon Valley can
be traced back by this powerful
ecosystem and network, with
Fairchild (founded by ‘the
traitorous eight’) in the center
Source: Endeavor
Silicon Valley: Ecosystem Growth
Harness Density
 Urban planners often justify keeping low FARs citing lack
adequate infrastructure – where additional density will
exacerbate infrastructure shortfalls.
 However, people will move closer to economic
opportunities
 Planners can make this process less traumatic by
accommodating density and related infrastructure
 Or they can be rigid – exacerbating housing affordability,
and connectivity to jobs.
• In the context of rapid movement of people into cities,
redevelopment becomes important
26
India: Density Challenges
Shanghai exhibits relatively low urban densities away from the inner core, as
compared to Seoul—matching Seoul’s density pattern would enable
Shanghai to accommodate millions more residents
0
5,000
10,000
15,000
20,000
25,000
30,000
35,000
40,000
0 100 200 300 400 500 600
Density(inhab/km2)
Built up area (km2)
Shanghai: Urban Sprawl and Declining Densities
Shanghai Seoul
Density vs. Liveability
Taming Density
Clockwise from Left: High-rise buildings in the Central Business District are
interspersed with low-rise conservation shophouses (CLC, Singapore); Green
spaces mitigate against density in public housing towns (SG Asia City.com);
Singapore’s green cover has increased by almost one third between 1986 and
2007 (NParks, Singapore).
Transit-Oriented Development (TOD)
Left: Hudson Yards, New York; Tanjong Pagar Mass Rapid Transit Station, Singapore; High-density
developments around Curitiba’s BRT line.
TOD: Density Around Mass Transit
Mumbai Current FSI
Draft plans to revise FSI and zones
based on transport corridors
• Rational, integrated, more granular and
contextual plans
• Higher densities complemented with
open space, conserved heritage,
greenery
• Responsive to short teem needs,
implementable, enforceable
• Safeguard long term goals
• Inclusive
Sources: Left: World Bank (2013); Right: Municipal Corporation of Greater Mumbai (2015).
Making density, land use and unlock development
potential through granular planning
India: Unlocking Development Potential
Explore Innovative Financing Solutions
$4.5 trillion/yearneeded to fill urban infrastructure financing gap
$125 billion
ODA is only a small
part of the solution
Cities are generating, receiving, and spending very small fractions of what is needed.
Tokyo: Land Value Capture
Above: Tokyo Station in the early 20th century (tokyostationhotel.jp);
Below: the Marunouchi area today (shinjukustation.com)
Plan for Tokyo Station area, showing high-rise, mixed-use
developments maximizing density around the railway and subway
lines (JR East).
Bangkok: BTS Skytrain PPP
Clockwise from Left: Bangkok’s Mass Transit System (Wikipedia); The elevated BTS provides commuters with an alternative to street-level traffic (dreamtime.com); Siam
station connects the Silom and Sukhumvit BTS Lines in downtown Bangkok (Bangkok.com).
Transit-Oriented Development in Curtiba, showing high-
density uses concentrated along the transit corridor
Sao Paolo: Payment for Density Bonus
Enable Land Markets to Function Effectively
Dysfunctional land markets affect delivery of public
services and infrastructure
0%
5%
10%
15%
20%
25%
30%
35%
40%
Manhattan
HongKong
Barcelona
Paris
Amsterdam
Athens
Guadalajara
Medellin
Brussels
Tokyo
Helsinki
Beijing
Copenhagen
St.Petersburg
Singapore
Brazilia
Auckland
Bangkok
Kigali
Chandigarn
Kolkata
Abuja
Ouagadougou
Dakar
AddisAbaba
Georgetown
Nairobi
Accra
Yeravan
Bangui
Share of urban land allocated to streets
Source: UN HABITAT, “The relevance of street patterns and public space in urban areas,” Working Paper (April 2013)
• Publicly-owned land, if effectively used, can help to
generate local revenues
• In India, Mumbai Port Trust holds 809 hectares of
land in a prime location.
• Only 52% of land is used for port operations.
• Remainder is vacant, abandoned, or leased out at
outdated, below-market rates
• Trust’s land operations are inefficient
• 200ha alone has an estimated value of
US$25billion. If land were managed for its
economic value, it could help to finance much-
needed infrastructure in Mumbai
Source: Peterson and Thawakar (2013)
India: Mumbai Port Trust
Land Sharing to Resolve Conflicts and Create
Inclusive Cities• Accommodate commercial development on
land occupied by slum dwellers, without
evicting existing occupants who have the right
to remain on site.
• Bangkok in 1970s/80s: Slum dwellers in
“battle for living space” with developers
• 7 successful land sharing schemes re-housed
almost 10,000 low-income families on the same
sites they were occupying
• Key shared characteristics:
• Original settlements largely on public land;
• Arrangements mediated by local and international housing
professionals, civil society org’s and public authorities (e.g.
National Housing Authority of Thailand);
• Self-financing of a portion of new land and housing costs
through loans
Source: Angel & Boonyabancha (1988)
Bangkok: Land Sharing Scheme
Tanzania: Local Government Revenue Collection Information System
• 7 Tanzanian cities rolled-out an
innovative Local Government
Revenue Collection Information
System (LGRCIS), an electronic
and Geographic Information System
(GIS) based tool which supports
collection from multiple revenue
sources.
• The system now allows proper
identification of tax payers,
defaulters, invoicing, bill generation
and facilitated online payment
through a single gateway.
• 30% average increase in own-
source revenues.
Key Messages
Some planning is better than none; implementation is as, if not more,
important than good plans.
Cities are expanding to form metropolitan regions. To harness the growth
potential of these areas, more holistic, strategic planning and governance
structures are needed.
Density need not be feared. If planned in tandem with infrastructure and
mass transit, and “tamed” with good urban design, high-density urban areas
are efficient and liveable.
Innovative municipal financing can fund urban development, but institutions
(including land markets) must create an enabling environment.
Thank you
@abhaskjha.

More Related Content

What's hot

National urban transport policy
National urban transport policyNational urban transport policy
National urban transport policy
Shubham Jain
 
Aim, objective and methodology of transit oriented development (TOD)
Aim, objective and methodology of transit oriented development (TOD)Aim, objective and methodology of transit oriented development (TOD)
Aim, objective and methodology of transit oriented development (TOD)
padamatikona swapnika
 
Public Private Partnership - in Road Sector
Public Private Partnership - in Road SectorPublic Private Partnership - in Road Sector
Public Private Partnership - in Road Sector
Bathla Tuition Centre
 
National Urban Transport Policy
National Urban Transport PolicyNational Urban Transport Policy
National Urban Transport PolicyAshu Kedia
 
The role of SPV in Transportation Sector
The role of SPV in Transportation SectorThe role of SPV in Transportation Sector
The role of SPV in Transportation SectorJaspal Singh
 
World TOD (Transit-Oriented Development) Resource
World TOD (Transit-Oriented Development) ResourceWorld TOD (Transit-Oriented Development) Resource
World TOD (Transit-Oriented Development) Resource
WRI Ross Center for Sustainable Cities
 
Problems in metropolitan cities by vakharia_siddhi
Problems in metropolitan cities by vakharia_siddhiProblems in metropolitan cities by vakharia_siddhi
Problems in metropolitan cities by vakharia_siddhi
Siddhi Vakharia
 
TOD - Transit Oriented Development
TOD - Transit Oriented DevelopmentTOD - Transit Oriented Development
TOD - Transit Oriented Development
Shruthi Kshirasagar
 
Land use transportation relation
Land use  transportation relationLand use  transportation relation
Land use transportation relation
Siddhi Vakharia
 
TRANSPORT: INITIATIVES FOR INDIA - Prof. Ralph Gakenheimer
TRANSPORT: INITIATIVES FOR INDIA - Prof. Ralph GakenheimerTRANSPORT: INITIATIVES FOR INDIA - Prof. Ralph Gakenheimer
TRANSPORT: INITIATIVES FOR INDIA - Prof. Ralph Gakenheimer
IPPAI
 
8 rajnish glasgow 9th june
8  rajnish glasgow   9th june8  rajnish glasgow   9th june
8 rajnish glasgow 9th juneREPUTE101
 
Hot Topics: Transit Oriented Development
Hot Topics: Transit Oriented DevelopmentHot Topics: Transit Oriented Development
Hot Topics: Transit Oriented Development
Jesse Souki
 
Sustainable transportation for smart cities
Sustainable transportation for smart citiesSustainable transportation for smart cities
Sustainable transportation for smart cities
JIT KUMAR GUPTA
 
TRANSIT ORIENTED DEVELOPMENT
TRANSIT ORIENTED DEVELOPMENTTRANSIT ORIENTED DEVELOPMENT
TRANSIT ORIENTED DEVELOPMENT
Ridam Shah
 
CCS Mid Term Presentation - The Private Metro
CCS Mid Term Presentation - The Private MetroCCS Mid Term Presentation - The Private Metro
CCS Mid Term Presentation - The Private MetroSumit Bhagat
 
Construction Projects Feasibility studies
Construction Projects Feasibility studiesConstruction Projects Feasibility studies
Construction Projects Feasibility studies
Subhendu Datta
 
New Urban Forms and Strategies: Regional Urban Design
New Urban Forms and Strategies:  Regional Urban Design New Urban Forms and Strategies:  Regional Urban Design
New Urban Forms and Strategies: Regional Urban Design
Penn Institute for Urban Research
 
Urban Carrying Capacity Assessment for metropolitan area: Case study of Patna...
Urban Carrying Capacity Assessment for metropolitan area: Case study of Patna...Urban Carrying Capacity Assessment for metropolitan area: Case study of Patna...
Urban Carrying Capacity Assessment for metropolitan area: Case study of Patna...
IRJET Journal
 
Special purpose vehicle (SPV)
Special purpose vehicle (SPV)Special purpose vehicle (SPV)
Special purpose vehicle (SPV)
Centre for Public Policy Research
 

What's hot (20)

Jaipuria key note
Jaipuria key noteJaipuria key note
Jaipuria key note
 
National urban transport policy
National urban transport policyNational urban transport policy
National urban transport policy
 
Aim, objective and methodology of transit oriented development (TOD)
Aim, objective and methodology of transit oriented development (TOD)Aim, objective and methodology of transit oriented development (TOD)
Aim, objective and methodology of transit oriented development (TOD)
 
Public Private Partnership - in Road Sector
Public Private Partnership - in Road SectorPublic Private Partnership - in Road Sector
Public Private Partnership - in Road Sector
 
National Urban Transport Policy
National Urban Transport PolicyNational Urban Transport Policy
National Urban Transport Policy
 
The role of SPV in Transportation Sector
The role of SPV in Transportation SectorThe role of SPV in Transportation Sector
The role of SPV in Transportation Sector
 
World TOD (Transit-Oriented Development) Resource
World TOD (Transit-Oriented Development) ResourceWorld TOD (Transit-Oriented Development) Resource
World TOD (Transit-Oriented Development) Resource
 
Problems in metropolitan cities by vakharia_siddhi
Problems in metropolitan cities by vakharia_siddhiProblems in metropolitan cities by vakharia_siddhi
Problems in metropolitan cities by vakharia_siddhi
 
TOD - Transit Oriented Development
TOD - Transit Oriented DevelopmentTOD - Transit Oriented Development
TOD - Transit Oriented Development
 
Land use transportation relation
Land use  transportation relationLand use  transportation relation
Land use transportation relation
 
TRANSPORT: INITIATIVES FOR INDIA - Prof. Ralph Gakenheimer
TRANSPORT: INITIATIVES FOR INDIA - Prof. Ralph GakenheimerTRANSPORT: INITIATIVES FOR INDIA - Prof. Ralph Gakenheimer
TRANSPORT: INITIATIVES FOR INDIA - Prof. Ralph Gakenheimer
 
8 rajnish glasgow 9th june
8  rajnish glasgow   9th june8  rajnish glasgow   9th june
8 rajnish glasgow 9th june
 
Hot Topics: Transit Oriented Development
Hot Topics: Transit Oriented DevelopmentHot Topics: Transit Oriented Development
Hot Topics: Transit Oriented Development
 
Sustainable transportation for smart cities
Sustainable transportation for smart citiesSustainable transportation for smart cities
Sustainable transportation for smart cities
 
TRANSIT ORIENTED DEVELOPMENT
TRANSIT ORIENTED DEVELOPMENTTRANSIT ORIENTED DEVELOPMENT
TRANSIT ORIENTED DEVELOPMENT
 
CCS Mid Term Presentation - The Private Metro
CCS Mid Term Presentation - The Private MetroCCS Mid Term Presentation - The Private Metro
CCS Mid Term Presentation - The Private Metro
 
Construction Projects Feasibility studies
Construction Projects Feasibility studiesConstruction Projects Feasibility studies
Construction Projects Feasibility studies
 
New Urban Forms and Strategies: Regional Urban Design
New Urban Forms and Strategies:  Regional Urban Design New Urban Forms and Strategies:  Regional Urban Design
New Urban Forms and Strategies: Regional Urban Design
 
Urban Carrying Capacity Assessment for metropolitan area: Case study of Patna...
Urban Carrying Capacity Assessment for metropolitan area: Case study of Patna...Urban Carrying Capacity Assessment for metropolitan area: Case study of Patna...
Urban Carrying Capacity Assessment for metropolitan area: Case study of Patna...
 
Special purpose vehicle (SPV)
Special purpose vehicle (SPV)Special purpose vehicle (SPV)
Special purpose vehicle (SPV)
 

Similar to Building Cities That Work Lessons from EAP Draft 14 Dec

Smart city
Smart citySmart city
Smart city
MANAV BADOGA
 
Necessity of Smart City
Necessity of Smart CityNecessity of Smart City
Necessity of Smart City
kalyanibedekar
 
resilience.io WASH Sector Protoype Debut Event
resilience.io WASH Sector Protoype Debut Eventresilience.io WASH Sector Protoype Debut Event
resilience.io WASH Sector Protoype Debut Event
Ecological Sequestration Trust
 
Mega cities and sustainability
Mega cities and sustainabilityMega cities and sustainability
Mega cities and sustainability
rcwells
 
impact of MRTS on Landuse in Patna
impact of MRTS on Landuse in Patnaimpact of MRTS on Landuse in Patna
impact of MRTS on Landuse in Patna
Archit Nishant
 
Module 5 Infrastructure Management System And Policy For Smart Citys.pptx
Module 5 Infrastructure Management System And Policy For Smart Citys.pptxModule 5 Infrastructure Management System And Policy For Smart Citys.pptx
Module 5 Infrastructure Management System And Policy For Smart Citys.pptx
SilasChaudhari
 
Smart Cities – how to master the world's biggest growth challenge
Smart Cities – how to master the world's biggest growth challengeSmart Cities – how to master the world's biggest growth challenge
Smart Cities – how to master the world's biggest growth challenge
Boston Consulting Group
 
Smart city
Smart citySmart city
Smart Cities (India)
Smart Cities (India)Smart Cities (India)
Smart Cities (India)
Rathnavel Ponnuswami
 
Норлиза Хашим - City as our future
Норлиза Хашим - City as our futureНорлиза Хашим - City as our future
Норлиза Хашим - City as our future
Anna Odintsova
 
Webinar - Why the Smart Cities Misison Matters for India
Webinar - Why the Smart Cities Misison Matters for IndiaWebinar - Why the Smart Cities Misison Matters for India
Webinar - Why the Smart Cities Misison Matters for India
WRI Ross Center for Sustainable Cities
 
Smart city employment
Smart city employmentSmart city employment
Smart city employment
Vikas Razdan
 
civil ppt rp.pptx
civil ppt rp.pptxcivil ppt rp.pptx
civil ppt rp.pptx
vibha79
 
Urban planning for smart cities - Smart tools for Smart Cities
Urban planning for smart cities - Smart tools for Smart CitiesUrban planning for smart cities - Smart tools for Smart Cities
Urban planning for smart cities - Smart tools for Smart Cities
Vivek Pai
 
Understanding The Idea Of Satellite Cities With High Technology In India.pdf
Understanding The Idea Of Satellite Cities With High Technology In India.pdfUnderstanding The Idea Of Satellite Cities With High Technology In India.pdf
Understanding The Idea Of Satellite Cities With High Technology In India.pdf
himaninavimumbaihous
 
Urban Real Estate & Development in India
Urban Real Estate & Development in IndiaUrban Real Estate & Development in India
Urban Real Estate & Development in India
Nitin Narang
 
Delhi_master_plan.pptx
Delhi_master_plan.pptxDelhi_master_plan.pptx
Delhi_master_plan.pptx
aditiyadav760155
 
Transforming the Urban Space through TOD: The 3V Approach
Transforming the Urban Space through TOD: The 3V ApproachTransforming the Urban Space through TOD: The 3V Approach
Transforming the Urban Space through TOD: The 3V Approach
WRI Ross Center for Sustainable Cities
 

Similar to Building Cities That Work Lessons from EAP Draft 14 Dec (20)

ChettaAlwaysWins
ChettaAlwaysWinsChettaAlwaysWins
ChettaAlwaysWins
 
Smart city
Smart citySmart city
Smart city
 
Necessity of Smart City
Necessity of Smart CityNecessity of Smart City
Necessity of Smart City
 
resilience.io WASH Sector Protoype Debut Event
resilience.io WASH Sector Protoype Debut Eventresilience.io WASH Sector Protoype Debut Event
resilience.io WASH Sector Protoype Debut Event
 
Mega cities and sustainability
Mega cities and sustainabilityMega cities and sustainability
Mega cities and sustainability
 
impact of MRTS on Landuse in Patna
impact of MRTS on Landuse in Patnaimpact of MRTS on Landuse in Patna
impact of MRTS on Landuse in Patna
 
Module 5 Infrastructure Management System And Policy For Smart Citys.pptx
Module 5 Infrastructure Management System And Policy For Smart Citys.pptxModule 5 Infrastructure Management System And Policy For Smart Citys.pptx
Module 5 Infrastructure Management System And Policy For Smart Citys.pptx
 
Smart Cities – how to master the world's biggest growth challenge
Smart Cities – how to master the world's biggest growth challengeSmart Cities – how to master the world's biggest growth challenge
Smart Cities – how to master the world's biggest growth challenge
 
Smart city
Smart citySmart city
Smart city
 
Smart Cities (India)
Smart Cities (India)Smart Cities (India)
Smart Cities (India)
 
Норлиза Хашим - City as our future
Норлиза Хашим - City as our futureНорлиза Хашим - City as our future
Норлиза Хашим - City as our future
 
Webinar - Why the Smart Cities Misison Matters for India
Webinar - Why the Smart Cities Misison Matters for IndiaWebinar - Why the Smart Cities Misison Matters for India
Webinar - Why the Smart Cities Misison Matters for India
 
Smart city employment
Smart city employmentSmart city employment
Smart city employment
 
civil ppt rp.pptx
civil ppt rp.pptxcivil ppt rp.pptx
civil ppt rp.pptx
 
TeenTitans1
TeenTitans1TeenTitans1
TeenTitans1
 
Urban planning for smart cities - Smart tools for Smart Cities
Urban planning for smart cities - Smart tools for Smart CitiesUrban planning for smart cities - Smart tools for Smart Cities
Urban planning for smart cities - Smart tools for Smart Cities
 
Understanding The Idea Of Satellite Cities With High Technology In India.pdf
Understanding The Idea Of Satellite Cities With High Technology In India.pdfUnderstanding The Idea Of Satellite Cities With High Technology In India.pdf
Understanding The Idea Of Satellite Cities With High Technology In India.pdf
 
Urban Real Estate & Development in India
Urban Real Estate & Development in IndiaUrban Real Estate & Development in India
Urban Real Estate & Development in India
 
Delhi_master_plan.pptx
Delhi_master_plan.pptxDelhi_master_plan.pptx
Delhi_master_plan.pptx
 
Transforming the Urban Space through TOD: The 3V Approach
Transforming the Urban Space through TOD: The 3V ApproachTransforming the Urban Space through TOD: The 3V Approach
Transforming the Urban Space through TOD: The 3V Approach
 

More from Abhas Jha

Metro Governance6 (00000002)
Metro Governance6 (00000002)Metro Governance6 (00000002)
Metro Governance6 (00000002)Abhas Jha
 
China Urbanization_Abhas Boston_27 March 2013
China Urbanization_Abhas Boston_27 March 2013China Urbanization_Abhas Boston_27 March 2013
China Urbanization_Abhas Boston_27 March 2013Abhas Jha
 
Building Resilience in an Urban World
Building Resilience in an Urban WorldBuilding Resilience in an Urban World
Building Resilience in an Urban WorldAbhas Jha
 
Urban Floods In The 21st Century Gp 2011
Urban Floods In The 21st Century Gp 2011Urban Floods In The 21st Century Gp 2011
Urban Floods In The 21st Century Gp 2011
Abhas Jha
 
Instruments for Disaster Risk Financing
Instruments for Disaster Risk FinancingInstruments for Disaster Risk Financing
Instruments for Disaster Risk FinancingAbhas Jha
 
Ten Lessons
Ten LessonsTen Lessons
Ten Lessons
Abhas Jha
 

More from Abhas Jha (6)

Metro Governance6 (00000002)
Metro Governance6 (00000002)Metro Governance6 (00000002)
Metro Governance6 (00000002)
 
China Urbanization_Abhas Boston_27 March 2013
China Urbanization_Abhas Boston_27 March 2013China Urbanization_Abhas Boston_27 March 2013
China Urbanization_Abhas Boston_27 March 2013
 
Building Resilience in an Urban World
Building Resilience in an Urban WorldBuilding Resilience in an Urban World
Building Resilience in an Urban World
 
Urban Floods In The 21st Century Gp 2011
Urban Floods In The 21st Century Gp 2011Urban Floods In The 21st Century Gp 2011
Urban Floods In The 21st Century Gp 2011
 
Instruments for Disaster Risk Financing
Instruments for Disaster Risk FinancingInstruments for Disaster Risk Financing
Instruments for Disaster Risk Financing
 
Ten Lessons
Ten LessonsTen Lessons
Ten Lessons
 

Building Cities That Work Lessons from EAP Draft 14 Dec

  • 1. Building Cities That Work: Lessons from East Asia Abhas Jha
  • 3. 5 billion by 2030 Adding another India 3 3
  • 4. 4 4 6.3 billion by 2050 And another China
  • 5. Storyline: Challenges and opportunities of urbanization/ the need for cities to work in order to benefit their growing populations Check ratings Cities present both challenges and opportunities. To harness their potential for growth and prosperity, cities need to work.
  • 6. Storyline: Challenges and opportunities of urbanization/ the need for cities to work in order to benefit their growing populations Check ratings • Adopt a Long-Term, Integrated Planning Approach • Ensure Planning is Evidence-Based • Capitalize on Scale • Harness Density • Explore Innovative Financing Solutions • Enable Land Markets to Function Effectively Overview
  • 7. Adopt a Long-Term, Integrated Planning Approach
  • 8. SINGAPORE: PLANNING APPROACHSingapore: Urban Planning Approach
  • 9. • Many cities are unable to translate plans to implementation • Use of land use planning and urban design to shape neighborhoods and respond to needs Singapore land area = 719 km Singapore’s use of detailed planning to shape mixed-used district character along riverfront Source: Urban Redevelopment Authority, Singapore (2015). Shape vibrant district level neighborhoods and facilitate development needs Singapore: Urban Planning Approach
  • 10. Integrated Land Use and Transport Planning 8 in 10 households living within a 10 minute walk from a train station 75% of all journeys in peak hours undertaken on public transport 85% of public transport journeys (less than 20 km) completed within 60 minutesLeft: Copenhagen’s “Finger Plan” established infrastructure along desired growth corridors (Sustainable Cities Collective); Above and Right: Singapore’s integrated infrastructure and land use planning (Alain Bertaud) is driven by clear performance targets (Land Transport Authority’s Land Transport Master Plan)
  • 11. Ensure Planning is Evidence-Based
  • 13. 13 Pop Base Pop +100% People/km2 Transit Network TODaround MetroStation (Job+100%, Pop+100%) BikeFacilities JobAccessibility Line 123 only No No 12% Line 123 + Bus Yes Yes 46% Line 123456 + Bus No No 32% Line 123456 + Bus Yes Yes 51% Source: The 3V Framework (World Bank) Measuring Job Accessibility
  • 15. • First successful slum-typology classification at city scale • Spatially Representative Slum Survey: nuancing urban poverty • Better design for city wide slum upgrading Philippines: Slum Mapping
  • 16. Beijing: Green Horizons • Collaboration between IBM and Beijing • Uses Internet of Things and cognitive computing to improve air quality management and forecasting. • Enables authorities to better plan long- term interventions to tackle air pollution
  • 18. Metropolitan areas continue to power national economic growth • In 2014, 60% of metro areas outperformed in employment creation • 1/3 of world’s 300 largest metro economies outpaced in GDP per capita and employment growth rates Metropolitan Regions: Economic Powerhouses
  • 20. 49 MRs created 57% of national GDP, home to just 32% of population. 95% of China’s population growth from 2000-2010 occurred in these MRs. China: Metropolitan Regions *Figures as at 2010; Source: Chreod 2013 The Yangtze River Economic Belt accounts for 20% of China’s GDP and is responsible for one-third of its imports and exports.
  • 21. The Manila urban area in the Philippines includes 85 municipalities and cities in seven provinces. Manila: Urban Expansion
  • 22. India: Peripheral Industrial Growth • Growth of economic activities highest in suburban villages • Pace of growth in high-tech and export-oriented manufacturing is fastest in peripheries of large metropolises Source: Economic Census 2005 and 1998
  • 23. The city continuously transforms itself to higher value added sectors by implementing proactive reform policy, and enhancing governance capabilities Source: Porter, Neo and Ketels (2013). Remaking Singapore. Havard Business School 9-710-483. Transport & Logistics Electronics Assembly Petro- chemicals Finance IT Headquarters Business Services Pharmaceuticals Aerospace Industrial Evolution Assets and Changing Conditions 1958-1985 Becoming an Asian Tiger • British base/ strategic location • Entrepôt • Lose labor market rules • FDI attraction: let foreign firms co-invest into joint ventures to limit risks • Fiscal policy: under-valued currency to boost exports • Wages increase/ 1985 depression • Key public investments to decrease costs of living for residents • Increased productivity through skills development and investments in infrastructure • Nurture a knowledge system to become a global education hub • Invest in research and development • Invest in quality of life (garden city, casino, etc.) 1985-1990 Recession and Reform 1991-2010 Singapore Maturing time Singapore: Economic Evolution (1950 – 2010)
  • 24. Most firms in Silicon Valley can be traced back by this powerful ecosystem and network, with Fairchild (founded by ‘the traitorous eight’) in the center Source: Endeavor Silicon Valley: Ecosystem Growth
  • 26.  Urban planners often justify keeping low FARs citing lack adequate infrastructure – where additional density will exacerbate infrastructure shortfalls.  However, people will move closer to economic opportunities  Planners can make this process less traumatic by accommodating density and related infrastructure  Or they can be rigid – exacerbating housing affordability, and connectivity to jobs. • In the context of rapid movement of people into cities, redevelopment becomes important 26 India: Density Challenges
  • 27. Shanghai exhibits relatively low urban densities away from the inner core, as compared to Seoul—matching Seoul’s density pattern would enable Shanghai to accommodate millions more residents 0 5,000 10,000 15,000 20,000 25,000 30,000 35,000 40,000 0 100 200 300 400 500 600 Density(inhab/km2) Built up area (km2) Shanghai: Urban Sprawl and Declining Densities Shanghai Seoul
  • 29. Taming Density Clockwise from Left: High-rise buildings in the Central Business District are interspersed with low-rise conservation shophouses (CLC, Singapore); Green spaces mitigate against density in public housing towns (SG Asia City.com); Singapore’s green cover has increased by almost one third between 1986 and 2007 (NParks, Singapore).
  • 30. Transit-Oriented Development (TOD) Left: Hudson Yards, New York; Tanjong Pagar Mass Rapid Transit Station, Singapore; High-density developments around Curitiba’s BRT line.
  • 31. TOD: Density Around Mass Transit
  • 32. Mumbai Current FSI Draft plans to revise FSI and zones based on transport corridors • Rational, integrated, more granular and contextual plans • Higher densities complemented with open space, conserved heritage, greenery • Responsive to short teem needs, implementable, enforceable • Safeguard long term goals • Inclusive Sources: Left: World Bank (2013); Right: Municipal Corporation of Greater Mumbai (2015). Making density, land use and unlock development potential through granular planning India: Unlocking Development Potential
  • 34. $4.5 trillion/yearneeded to fill urban infrastructure financing gap $125 billion ODA is only a small part of the solution Cities are generating, receiving, and spending very small fractions of what is needed.
  • 35. Tokyo: Land Value Capture Above: Tokyo Station in the early 20th century (tokyostationhotel.jp); Below: the Marunouchi area today (shinjukustation.com) Plan for Tokyo Station area, showing high-rise, mixed-use developments maximizing density around the railway and subway lines (JR East).
  • 36. Bangkok: BTS Skytrain PPP Clockwise from Left: Bangkok’s Mass Transit System (Wikipedia); The elevated BTS provides commuters with an alternative to street-level traffic (dreamtime.com); Siam station connects the Silom and Sukhumvit BTS Lines in downtown Bangkok (Bangkok.com).
  • 37. Transit-Oriented Development in Curtiba, showing high- density uses concentrated along the transit corridor Sao Paolo: Payment for Density Bonus
  • 38. Enable Land Markets to Function Effectively
  • 39. Dysfunctional land markets affect delivery of public services and infrastructure 0% 5% 10% 15% 20% 25% 30% 35% 40% Manhattan HongKong Barcelona Paris Amsterdam Athens Guadalajara Medellin Brussels Tokyo Helsinki Beijing Copenhagen St.Petersburg Singapore Brazilia Auckland Bangkok Kigali Chandigarn Kolkata Abuja Ouagadougou Dakar AddisAbaba Georgetown Nairobi Accra Yeravan Bangui Share of urban land allocated to streets Source: UN HABITAT, “The relevance of street patterns and public space in urban areas,” Working Paper (April 2013)
  • 40. • Publicly-owned land, if effectively used, can help to generate local revenues • In India, Mumbai Port Trust holds 809 hectares of land in a prime location. • Only 52% of land is used for port operations. • Remainder is vacant, abandoned, or leased out at outdated, below-market rates • Trust’s land operations are inefficient • 200ha alone has an estimated value of US$25billion. If land were managed for its economic value, it could help to finance much- needed infrastructure in Mumbai Source: Peterson and Thawakar (2013) India: Mumbai Port Trust
  • 41. Land Sharing to Resolve Conflicts and Create Inclusive Cities• Accommodate commercial development on land occupied by slum dwellers, without evicting existing occupants who have the right to remain on site. • Bangkok in 1970s/80s: Slum dwellers in “battle for living space” with developers • 7 successful land sharing schemes re-housed almost 10,000 low-income families on the same sites they were occupying • Key shared characteristics: • Original settlements largely on public land; • Arrangements mediated by local and international housing professionals, civil society org’s and public authorities (e.g. National Housing Authority of Thailand); • Self-financing of a portion of new land and housing costs through loans Source: Angel & Boonyabancha (1988) Bangkok: Land Sharing Scheme
  • 42. Tanzania: Local Government Revenue Collection Information System • 7 Tanzanian cities rolled-out an innovative Local Government Revenue Collection Information System (LGRCIS), an electronic and Geographic Information System (GIS) based tool which supports collection from multiple revenue sources. • The system now allows proper identification of tax payers, defaulters, invoicing, bill generation and facilitated online payment through a single gateway. • 30% average increase in own- source revenues.
  • 43. Key Messages Some planning is better than none; implementation is as, if not more, important than good plans. Cities are expanding to form metropolitan regions. To harness the growth potential of these areas, more holistic, strategic planning and governance structures are needed. Density need not be feared. If planned in tandem with infrastructure and mass transit, and “tamed” with good urban design, high-density urban areas are efficient and liveable. Innovative municipal financing can fund urban development, but institutions (including land markets) must create an enabling environment.

Editor's Notes

  1. Source: World Urbanization Prospects Database (2014 revision)
  2. Source: World Urbanization Prospects Database (2014 revision)
  3. Source: World Urbanization Prospects Database (2014 revision)
  4. “Work” in the sense that they are sustainable – not only economically, but financially as well - , resilient and inclusive.
  5. As an overarching principle, cities should adopt a planning approach that is long term and integrated. A master plan is only as good as
  6. Singapore’s urban planning approach adopts a long-term, integrated view. Starting with the Concept Plan, which takes into consideration the needs of the country over a 40-50 year timeframe, planners define broad land use allocations to meet future needs. This translates into the more detailed Master Plan, a statutory document which defines land use and allowable density for each individual parcel of land. Planning in itself is not able to achieve urban development goals. In Singapore, planning visions are realized through government land sales as well as development control, which ensures that land is developed in accordance with the Master Plan and any special planning or urban design guidelines.
  7. Here we can see how the master plan (image on left) provides a detailed land use plan that shapes urban development.
  8. A textbook example of integration of transport and land-use planning is Copenhagen’s Finger Plan. Through this plan, rail infrastructure drives urban growth along desired corridors, and these corridors ultimately shape the form and activity of sustainable urban development. In Singapore: Integration of Infrastructure and Land Use Plans with Vision & Clear Targets
  9. Innovative City Planning Labs project funded by the World Bank in Indonesia. The project has several aims, including the delivery of spatial analytics that can feed into urban planning and investment decisions. These four maps show how we can use a poverty map to overlay infrastructure accessibility. They also are an easy way the multi-dimensionality of poverty in outskirt areas of Semarang. Accessibility mapping shows spatial gaps in services helping agencies decide where infrastructure would be best developed and high poverty slums can be prioritized.
  10. Challenge Slums are diverse. One type of intervention does not fit all slums. But how do we identify a topology of slum characters? What are the different types of slums? Geospatial Solution A statistical analysis of various slum settlement attributes (mostly) related to objects found inside slums was combined with a linear index and other spatial relations into a model. Impact This is the first successful attempt in classifying slums in an objective typology on the basis of their physical characteristics using satellite imagery at city scale. 6 typologies are defined; being used for an ongoing slum survey. Data available to support project design for slum upgrading
  11. IBM has been working with Beijing on a “Green Horizons” initiative, which leverages cognitive computing and the Internet of Things (IoT) to enable city governments, utility companies, and industry to improve their relationship with the environment. Initiative has also been introduced in other cities, including Delhi in India and Johannesburg, South Africa. IBM’s air quality management system has its roots in a collaboration with the Beijing Environmental Protection Bureau which is grappling with reducing air pollution in the broader Jing-Jin-Ji (JJJ) region - shorthand for Beijing-Tianjin-Hebei – one of the world’s most populous, industrialized and polluted regions. In order to achieve its goal of reducing levels of ultrafine Particulate Matter (PM 2.5) by 25% by 2017, the Beijing Environmental Protection Bureau needed a way to fine tune its clean air action plan while protecting sustained economic growth and jobs for over 100 million people in the JJJ region. A clear blue sky has a PM2.5 reading of 0. A typical busy city might score between 40 and 60, and the threshold of lung irritation and sensitivity is around 100 – near heavy industrial activity. Anything above 200 is hazardous to public health and published figures for Beijing have in the past exceeded 600. IBM’s researchers helped to develop a system capable of generating predictive models showing where pollution is coming from, where it will likely go, and what will be its potential effect. Not only that, but using scenario modelling, they came up with a way to create hypothetical ‘what if’ scenarios - enabling city officials to try out the effectiveness of different action plans to achieve a balance between environmental and economic concerns. The system works by using IoT technologies to gather data from environmental and weather monitoring stations as well as meteorological satellites and traffic cameras. Machine learning technologies ingest and learn from the data, constantly self-configuring and automatically adjusting the predictive models to different seasons and topographies. The system is able to generate highly accurate pollution forecasts, down to the nearest kilometer, 72 hours ahead of time and as well as pollution trend forecasts up to 10 days into the future. Armed with this information, city officials can calculate the most targeted, effective and sustainable responses. Measures include short term limitations on urban traffic and construction activity as well as long term improvements to industrial production and power generation - such as switching to cleaner energy sources and installing filtering systems. Spraying water into the atmosphere and issuing public health alerts are part of the action plan for the most severe predictions. Selective, temporary reductions in industrial activity are also considered for large scale events such as the 2022 Winter Olympics to be jointly hosted by Beijing and the northern city of Zhangjiakou. https://www.wired.com/2015/03/opinion-us-embassy-beijing-tweeted-clear-air/
  12. The image of global nighttime lights can be a proxy for urban settlements. Image source: NASA, Nighttime lights Text source: Brookings Institution, Global Metro Monitor 2014
  13. https://www.washingtonpost.com/news/wonk/wp/2016/12/12/the-radical-new-map-that-would-really-reflect-life-in-the-u-s/?utm_term=.c0755f8b3fb7 Researchers used algorithms to analyze data on the commuting paths of more than 4 million Americans from the U.S. Census. They then created maps of what they call economic “mega-regions” — cities, satellite cities, towns and suburbs that are woven together into the communities where Americans live, work and spend their free time. The researchers argue that these, rather than the current states, are the real units that make up the U.S. economy. In the map here, each “mega-region” is labeled with a different color. All have one or more cities at their centers — the blue area is centered around Chicago, for example, while the forest green stretch encompasses Baltimore and Washington, D.C. The map shows that San Francisco, Oakland and Sacramento are all main employment centers, as well as Stockton, Modesto and Santa Rosa. It also shows that commutes and living arrangements broadly connect the area into an economic mega-region. “The reality is that cities, suburbs, exurbs, and rural areas are all extensively connected to one another — not only by commuter traffic, but by all sorts of economic and social connections. While a voter in downtown Boston and a voter in rural Maine might not feel like they have very much in common, our research suggests that they are actually part of an interlocking regional system,” he says. Because the maps offer a clear snapshot of economic linkages, they may also prove to be useful for business leaders and policymakers, the researchers say. They provide far more insight into how a given real estate development, retail business plan or newly constructed train line would affect local economies, compared with the data on metro regions that the Census regularly tracks.
  14. Metropolitan Regions in China have also been shown to drive economic growth. The recognition of the prominence of such MRs has led to new regional plans, such as the Yangtze River Economic Belt.
  15. Growth in Metropolitan Regions will pose challenges in terms of governance. In Manila, the urban area includes 85 municipalities and cities across seven provinces. [Note – this refers not just to Metro Manila but the larger urban footprint Similarly, less than 40 percent of the built-up land and population of the Jakarta urban area are within Jakarta’s provincial boundaries]
  16. India is also witnessing growth in metropolitan areas. In this graph you can see that manufacturing is suburbanizing from the cores of large metropolitan areas to their immediate peripheries -- growth of economic activities is highest in suburban villages marked in green. The pace of the growth in high tech and export oriented manufacturing jobs is fastest in areas that are classified as in the periphery of the largest metropolises. What we know from international experience is that the types of agglomeration economies offered by places evolves as an economy matures. For instance, Sao Paulo – brazil’s largest agglomeration was concentrated in manufacturing – relying a lot on localization economies – in the 1980s, a period when brazil was at its manufacturing heyday. However, today, Sao Paulo now has concentrations of financial services – which benefit from urbanization economies. The basic point here is that industries tend to reshuffle across urban areas with economic development – often starting off in large metropolitan areas that act as nurseries – and then move to smaller cities as production gets standardized. New York provides another interesting example – which now specialize in finance – but was a meat packing and textiles center in the 1930s. The question for policy makers to consider then is, how can this metropolitan growth be harnessed? What must be done in order for the benefits of agglomeration economies to be reaped?
  17. Concerted effort and planning is required for metropolitan regions to reap the benefits of agglomeration economies. As MRs in India continue to grow, and as the face of industry continues to change, policy makers have to be aware of and prepare for these shifts. Taking the example of Singapore - after two decades of rapid economic growth (Asian Tiger –a similar growth model by Japan/Korea/Taiwan: labor-intensive exports industrial upgrade), Singapore had its first economic depression in 1985, due to rising labor costs, high unemployment, and there were wide-spread discontent in the city. Govt implemented proactive reform policy, and enhanced governance capabilities and delivered huge public investments into increasing labor skills, and infrastructure. Singapore was able to re-invent itself towards a knowledge economy. The aerospace industry is a good case study in developing and implementing this holistic approach to economic evolution. Making use of land around Seletar Airport, a former military base, Seletar Aeropsace Park (SAP) is now home to about 30 local and international aerospace companies. Spread over 300ha, the industrial park hosts a wide range of activities along different points of the value chain – maintenance, repair and overhaul; design and manufacture of aircraft systems; business and general aviation activities; as well as a regional aerospace campus that houses educational and training institutes. Companies such as Rolls Royce benefit from being in a well-integrated environment, which allows for economies of scale and increased efficiency. The success of SAP is not only because the government set aside an adequate amount of land. It is also about identifying the right growth sectors, attracting strategic companies and ensuring a pipeline of talent from local tertiary institutions
  18. A huge success of the eight PhDs’ Intel, AMD and other giants were direct spinoffs of Fairchild Noyce (from Fairchild) was Steve Jobs’ mentor when Steve Jobs was cast out of Apple in 1985 Some of these “eight” went into other related fields, e.g. Kleiner founded the venture capital giant: Kleiner & Perkins  We need to foster a healthy ecosystem that connects ideas, talents money, In that initial one, back in 1998, Jobs began by going to a whiteboard to draw a biographical timeline of the Valley. There were Bill Hewlett and Dave Packard back in 1938, developing an audio oscillator in their Palo Alto garage, and in the process giving birth to Silicon Valley (though it wasn’t called as such until the early 1970s, when silicon became the main element in microchips); there was brilliant-but-pathological William Shockley, who founded the first semiconductor company in 1956, in Mountain View; there were the “Traitorous Eight” — including Gordon Moore, Bob Noyce and Gene Kleiner — who bolted from Shockley to launch Fairchild Semiconductor in 1957, which led to the most famous of the “Fairchildren” spin-offs, a company called Intel  INTC -0.44% , started by Moore and Noyce in 1968, as well as the Valley’s first major venture-capital firm, Kleiner Perkins Caufield & Byers, co-founded by Kleiner and Tom Perkins four years later. http://www.ecosysteminsights.org/lessons-from-silicon-valley-how-to-cultivate-high-growth-industries/
  19. Shanghai’s spatial layout increasingly impacts its competiveness and livability: urban sprawl has led to declining densities, increasing economic distance, and weakened agglomeration benefits.
  20. A densely populated city does not have to submit to a grim fate. If it is well thought out and planned, the city can offer its residents a very high quality of life. In fact, in the best case, the city can use its density to its advantage. Economists studying cities routinely find, after controlling for other variables, that workers in denser places earn higher wages and are more productive. American economists like Paul Romer and Edward Glaesar have proposed a link between density and a city’s capacity for innovation. In addition, dense cities which are well planned are sustainable cities. Studies show that a doubling of density results in a 30 per cent reduction in energy use per capita. The lower-density cities of the United States (typically ten persons per hectare or less) use about five times more energy per capita in gasoline than the cities of Europe, which are in turn about five times denser on average. A compact city with good public transport, walkability, and a reduced need to drive long distances to reach destinations adds to environmental sustainability.
  21. Promoting density does not mean that city dwellers should live in cramped and crowded urban spaces. In Singapore, urban planners use a “checkerboard planning” approach that intersperses high-rise buildings with low rise buildings and open spaces. This gives a feeling of spaciousness and prevents city-dwellers from being literally ‘walled-in’. Another way to create respite is to intersperse the urban environment with a variety of flora. Basically, where there is space, plant trees! This translates into greenery that can be found on pavements and road dividers, building facades and even rooftops. These green boundaries also help demarcate areas within a district, and give each one a unique look and feel.
  22. Being able to harness density is a key principle of Transit-Oriented Development, or TOD, which is an integrated land use and transport strategy to achieve a more sustainable, competitive, and socially inclusive city. It is used to achieve well-designed, high-density mixed-use, mixed-income, pedestrian and bike-friendly urban development, organized around mass transit stations.
  23. TOD can help to increase ridership for mass transit by providing customers that live, work, and play in high-density developments located in close proximity to transit stations. In addition, access to high-quality transit service links residents to an increased number of employment opportunities, providing economic opportunities for many. In the high-density city of Hong Kong, 43% of residents live within 500m of a transit station, while 57% of jobs are located within 500m of a transit stop; such distributions have occurred due in part to both organic and planned TOD. As a result, Hong Kong’s high-quality transit system is one of the most successful transit networks in the world: in 2000, it was estimated that roughly 90% of all motorized trips taken in Hong Kong were made by public transit, a huge majority market share. When TOD is implemented successfully, transit ridership is increased, and residents have access to a variety of housing and employment opportunities through transit networks.
  24. Municipal Finance is cardinal to city success: it forms the “resource fulcrum” on which rapid urban development and management rests.   The disconnect between what is needed and current realities is extremely large: total urban infrastructure financing needs are in excess of $4.5 trillion per annum, much of which will be in the developing world but cities are generating, receiving and spending small fractions of what is needed.
  25. Land-value capture generally refers to financing mechanisms that allow the public sector to leverage resources against the appreciation of land value resulting from public improvements. There are several ways that this can be done; broadly speaking LVC can be tax and fee-based (e.g. property tax, land tax), or it can be development-based (e.g. land readjustment, air rights sales etc.) Tokyo, Japan provides one of the best examples in LVC using revenues from real estate development to finance rail investment. In the case of Tokyo Station in Marunouchi, a regulatory arrangement has enabled landowners to transfer or “sell” a portion of its unused air development right (i.e. the additional FAR to develop a taller building) to an adjacent parcel or to a landowner in the designated project area. the LVC in Tokyo is realized through land readjustments and market negotiations between municipal government and private landowners. Local authorities gain private land for transit development, and landowners are compensated through development perks and increased property values.
  26. A good example of a PPP-financing arrangement is the congestion-relieving Skytrain system or BTS in Bangkok, Thailand. This system is operated by a private company with concessions and close partnership with the city government.
  27. Potentially innovative and flexible redevelopment scheme, if political will exists
  28. The Tanzania Strategic Cities Project (TSCP) supports 7 cities to improve their own source revenue collection efficiency, by introducing an innovative Local Government Revenue Collection Information System (LGRCIS). LGRCIS is an electronic and Geographic Information System (GIS) based tool which supports revenue collection from multiple sources (eg. service levy, property tax, business license etc.).   Before 2014, cities relied on manual tax assessments. Officials undertook field surveys, but the information gathered was inaccurate and limited. Many potential taxpayers were left off the rolls. The assessments were easily manipulated for personal gain, as were the payments that utilized cumbersome paper-based processes. As a result, revenue channels only generated limited resources. Cities are caught in a vicious cycle - unable to fund their development plans, and thus incapable of building the conducive environments for enhanced productivity and businesses they needed to generate further revenues.   The government started laying the foundations for LGRCIS in 2013. The system now allows proper identification of tax payers, defaulters, invoicing, receipting, bill generation and facilitated electronic/online payment through a single gateway. Reporting and analysis by geography, payers, or revenue types are enabled. LGRCIS radically improved how taxes are collected, with gains in transparency, accountability and customer-focus. Further, the LGRCIS will be used as the enabling and integrated platform for urban planning, O&M, and cost recovery.   By end FY2015, the results are remarkable. In one year, cities have seen OSR increase on an average of 30%; and in Mwanza, even up to 80%. The increased revenue are critical in meeting shortfalls from central government transfers, and are ploughed back into development projects. The initial success of the LGRCIS demonstrated its transformative potential. LGRCIS is now being scaled up country-wide, both through other Bank operations and by the government.